A Comparison of Swedish and
Non-Swedish Customers’
Perception of Grocery
In-store Self-Scanner
ACHELOR THESIS WITHIN: Business Administration UMBER OF CREDITS: 15 Credits
ROGRAMME OF STUDY: International Management UTHOR: Patricia Olufunmilayo Awe
UTOR: Dr. Rudrajeet Pal ÖNKÖPING May 2018
A Study of Personal Shopping
Solution
Bachelor Thesis in Business Administration
Title: A Comparison of Swedish and Non-Swedish Customers’ Perception of Grocery In-store Self-Scanner: A Study of personal shopping solution
Authors: Patricia Olufunmilayo Awe Tutor: Dr. Rudrajeet Pal
Date: 2018-05-22
Key terms: Instore Grocery Shopping, Self-Scanner, Consumer Satisfaction, Customer Perceive Service Quality, Behavioural theories, TAM
Abstract
Background:
The advancement in digital products and digital services is a mixed feeling in the retailing markets. Emerging technologies are disrupting the mode of operation in a grocery store and one of this technology is scanner, an efficient tool of service. Self-scanner is a technology-based self-service alternative decision where the customer scan their goods and pay for their shopping without grocery attendant support. It is used progressively by retailer especially the big supermarket to deliver superior customers value and service to minimize the check-out period. The study found that older men and women likely to use self-scanner than the younger people (Lee et al., 2010). This study found that customer experienced several problems during service encounter with the self-scan check out (Lee et al., 2010). Among the problem is, customers technological skills and ability, level of technology, lack of system reliability and poor design of self-scanner technology. For the retailer, there is a problem of theft rockets and customer aggressive behaviour.
Purpose:
The study intends to examine how digitalization (e.g. self-scanner) affects consumers in-store shopping behaviour. To ensure that the purpose of this study is achieved, and test the relationship between Swedish and non-Swedish customers’ behaviour and perceived service quality, the theories of buyer behaviour (e.g. TAM and diffusion of innovation) are used as the fundamental theoretical model.
Method:
The study employs a survey as a tool for examining the factors affecting the use of grocery self-scanners between the Swedish and Non-Swedish customers. The questions were organised by themes and carefully designed to provide answers to the research questions as well as the constructs derived from TAM and Innovation Diffusion Theory. The survey questions focus on consumer’s self-scanner experience using the 5-Likert scale questions to measure the perception of self-scanner usefulness, ease-of-use, complexity and relative advantage. Also, the demographic information of the respondents was obtained through a series of demographic questions which were formulated and included in the questionnaire. The survey question was answered by 74 respondents through a paper-based questionnaire and Google online survey link distributed to the respondents via email address, Facebook messenger and WhatsApp platforms. All the respondents of the online survey were the people living in Sweden only. To analyse the data collected through the survey, Partial Least Squares (PLS) technique of structural equation modelling was applied using SmartPLS 3.0 statistics software student version. The study checks the reliability of the data by running a reliability test for Cronbach Alpha and compare the result with the rule of thumb. Further, variance Structural Equation Modelling (SEM) were conducted based on the independent and dependent variables for structural relationship.
Conclusion:
The result implies that non-Swedish users tend to use self-scanners at the grocery stores more than their Swedish counterparts if they perceived the device as ease to use. It could be observed from the results that perceived relative advantage has a greater influence on self-scanning experience of non-Swedish users than their non-Swedish counterparts. To reduce the rejection rates of using the self-scanning
devices at the grocery store by the customers, the study suggests that the device and the process of usage should be made simple and convenient for the users.
Acknowledgements
I am thankful to the Almighty God for making my thesis process possible. The process of writing this thesis has been challenging, but it has added value to my knowledge. Every activity of writing this thesis has been a value-adding activity. I would like to appreciate the following individuals who have contributed to the success of this thesis through their suggestions and constructive comments that I received to make the work looks better.
Firstly, I would like to thank my tutor, Dr. Rudrajeet Pal, for all his valuable comments, suggestions, guidance and time. Your feedback and constructive criticism were very helpful for the improvement of the thesis. I would also thank other groups in the class, especially my opponent, who gave me positive comments and suggestions for the improvement of my work. Secondly, a big thank you to all the people that had participated in the questionnaire survey. Without their support, time and cooperation, it would have been impossible to complete the thesis within the timeframe allotted to it. I say more grease to your elbow!
Finally, I am greatly indebted to my husband, Dr. Samuel Awe, for guiding and supporting me in the process of performing and writing this thesis. I am also grateful to Mr. Sunday Olaleye, who has spent his valuable time to read through my write-up and providing academic support and encouragement. I would especially like to thank my beloved children, Stephen, Emmanuel, Timothy, Samson and Abigael, for their prayers and support during the rigorous academic work. I love you all!
Thank You.
Patricia Awe Jönköping 21st May 2018
Table of Contents
Abstract
i
Acknowledgements
ii
1.
Introduction
1
Background 1
Problem Statement and Research Gap 4
Research Purpose and Questions 6
Limitation 6
2.
Theoretical Framework
7
2.1 Self-scanning Technology 7
2.1.1 Advantages and disadvantages of Self-scanning 7
2.2 Service 9
2.2.1 Service Encounters 10
2.2.2 Service Quality and Customer Satisfaction 10
2.3 Instore Grocery Buying Behaviour 11
2.4 Applied Behavioural Theories 12
2.4.1 Theory of Planned Behaviour Model 12
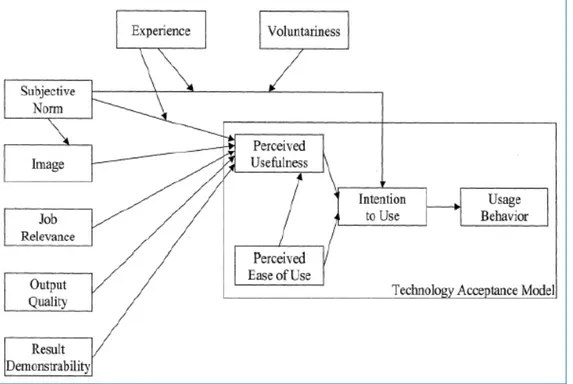
2.4.2 Technology Acceptance Model (TAM) 13
2.4.3 Theory of Innovation Diffusion 15
3.
Research Model and Hypotheses
17
3.1 Conceptual Model 17 3.2 Perceived Usefulness 18 3.3 Perceived Ease-of-Use 18 3.4 Relative Advantage 19 3.5 Complexity 19
4.
Methodology
21
4.1 Research Approach 21 4.1.1 Sampling method 214.1.2 Research Design and Questionnaire Survey 22
4.1.3 Administration of questionnaire 24
4.2 Research Methodology and Data Analysis 24
4.3 Data reliability 25
4.4 Data validity 26
5.
Results
27
5.1 Results 27
5.1.1 Demographic Information of Respondents 27
5.1.2 Measurement Model Evaluation 28
5.1.3 Structural Model Evaluation 30
5.1.4 Multigroup Analysis 32
6.
Discussion and conclusions
35
6.1 Discussion of Findings 35
6.1.1 Limitations and Future Research Issues 37
6.2 Conclusions 38
Figures
Figure 1 Swedish grocery stores offering self-scanning from 2010 to 2016……….2
Figure 2 Summary of Population Statistics 1960–2017……….5
Figure 3 Theory of Planned Behaviour………..13
Figure 4 Technology Acceptance Model, TAM………14
Figure 5 The Technology Acceptance Model 2, TAM2………15
Figure 6 A model of five stages in the Innovation-Decision Process………16
Figure 7 Proposed conceptual self-scanning model………...17
Figure 8 Demographic information of the respondents……….28
Figure 9 Conceptual framework and tested hypothesis……….32
Figure 10 Multigroup analysis (Swedish and non-Swedish) ……….34
Tables
Table 1 Consumers’ self-checkout experience as a function of gender and age…….8Table 2 Formulated questionnaires based on the proposed model variables………...23
Table 3 Likert’s scale………...23
Table 4 Demographic information………...24
Table 5 Overall Confirmatory Factor Analysis (CFA) for the measurement model...29
Table 6 Latent variable correlations………....30
Table 7 Standardized path coefficients for self-scanner model………...31
Table 8 Swedish and non-Swedish multigroup data analysis………..34
Appendix
Appendix 1 Survey questionnaire………511. Introduction
___________________________________________________________________________________
The purpose of this chapter is to provide the reader with background information, to get a deeper knowledge of the phenomena self-scanning technology and to understand the research theme of this thesis. The problem leading to the writing of the thesis will be presented, as well as three main specific research questions. Finally, the chapter contains limitation of the research to ease the understanding of the thesis work.
______________________________________________________________________ Background
The constant change in retailing field is attracting more input from the academia, media and professional regarding a consistent change through global digitilization. The advancement in digital products and digital services is a mixed feeling in the retailing markets. Emerging technologies are disrupting the mode of operation in a grocery store and one of this technology is self-scanner, an efficient tool of self-service (Demoulin and Djelassi, 2016). Self-scanning is a technology-based self-service alternative decision where the customers scan their goods and pay for their shopping without employee’s support. It is used progressively by retailer especially the big supermarket to deliver superior customers value and service to minimize the check-out period. Previous study found that older men and women are likely to use self-scanner than the younger people (Lee et al., 2010). This study also found that customer experienced several problems during service encounter with the self-scan check out, and among the problems encountered by the customers are customer’s technological skills and ability, level of technology, lack of system reliability and poor design of self-scanner technology. For the retailer, there is a problem of theft rockets and customer aggressive behaviour.
Nevertheless, contrary to the perceived benefit offered, some researchers have proposed there is a tendency in wrong model that leads to customers to feel frustrated and annoyed (Meuter et al., 2000). These researchers further explained that few of the customers that make use of self-scanning discovered failure in technology, service design problems, process failures, technology design problems and customer driven failures as a kind of dissatisfaction. On the other hand, customers believe that self-scan check-out have advantages for both retailers and customers. Digitalization played important roles in retailing or grocery stores. It helps to improve their services to their
potential customers, reduce costs and management operations. According to the study conducted by Renko et al. (2014), the authors opined that self-scanning technology brings some benefits to the customers by not staying long on the queue at check-out, fast in-service delivery, price error free, and loyal card program. Retailer said that National living wage could lead to reduction of staff, decrease in store numbers, and implementation of self-scanning and self-service technology (Werner et al., 2017). Self-service technology is viewed as a technological interface that allows customers to render an independent service without interacting with service employees (Marzocchi and Zammit, 2006; Meuter et al., 2003). In Sweden, the application of self-scanner has been gaining ground among the retailers, especially among grocery stores. The first grocery stores in Sweden without the presence of cashiers is Green Matmarknad in Malmö, where customers pay for their items via automatic self-checkout systems (Guibourg, 2012). Speaking with the Metro Newspaper, the founder of Green Matmarknad, Daniel Waidzunas, believed that all stores in Sweden will have self-checkout machines within a couple of years, and that this technology will provide an opportunity to the staff of several stores to engage in other tasks or duties in the stores. Although, many Swedish shoppers still believed in the traditional way of queuing before paying for their items but with time they will adapt to the self-scanning technology. Figure 1 shows the statistical share of grocery stores offering self-scanning or self-checkout in Sweden from 2010 to 2016. According to this figure, self-scanning process has shown an increasing trend from 2010 to 2016, which is an indication that the use of this technology will be on the increase in Sweden.
Figure 1 Swedish grocery stores offering self-scanning from 2010 to 2016. (https://www.statista.com/statistics/710839/)
Presently, there are challenges of shop-lifting and checking-out manipulation by the grocery customers. The insight from this study will advance the use of grocery scanner and solve the problem that is distracting its use. This study will be significant because retailing sector is playing an important role in the economy of Sweden, also making life easy for the customers and will bring more profit and quick return on investment (ROI). Besides, this investigation will be of interest to the Swedish grocery retailers, researchers and technology practitioners since it will be a roadmap to their success. This topic is researchable and have the potential to contribute to the growing literature in retailing. The theory of buyer behaviour will be expanded with demographics and psychographics variables and produce a novel knowledge of customer grocery shopping behaviour in the context of grocery instore scanner. Furthermore, the Technology Acceptance Model 3 (TAM3) (Lai, 2017; Venkatesh and Bala, 2008) is adopted to examine the determinants of perceived ease of use and perceived usefulness, which include system characteristics, social influence, individual differences and facilitating conditions. Also, the theory of Diffusion of Innovation (DOI) (Roger, 2003) is used to examine the impact of self-scanning technology relative advantage and complexity on the perceived usefulness of the technology between the Swedish and non-Swedish grocery store consumers. The study intends to combine the theory of diffusion of innovation with the technology acceptance model to investigate customer’s instore self-scanning experience, since there is no report found in the literature where the two theories had been combined to study the consumer’s grocery instore self-scanning experience. However, two constructs are selected each from TAM (perceived usefulness and perceived ease of use) and DOI (relative advantage and complexity) to produce a conceptual model used in the current investigation. Since self-scanning technology is already in use in many stores all over Sweden, this study intends to investigate the factors that could enhance the continuous use of a self-scanning checkout at the grocery stores in Sweden. This is the reason why perceived usefulness, perceived-ease-of-use, relative advantage and complexity were selected and combined to observe their influences on the grocery instore costumer’s experience. The grocery research domain is of interest because of the pre-knowledge about customer behaviour which is based on different theoretical proposition and real-life retail business.
Problem Statement and Research Gap
Self-scanning represents a form of self-service, a form of customer participation in service creation and a technology-based service delivery device (Marzocchi and Zammit, 2006). To efficiently use this technology, shoppers must be willing to perform a role as service co-creator, which implies that consumers undertake partial responsibility for the quality of the service itself. Besides, customers should be willing to use self-service solutions and have a positive attitude towards using the technology as a way of achieving their goals more easily rather than seeing it as a hindrance.
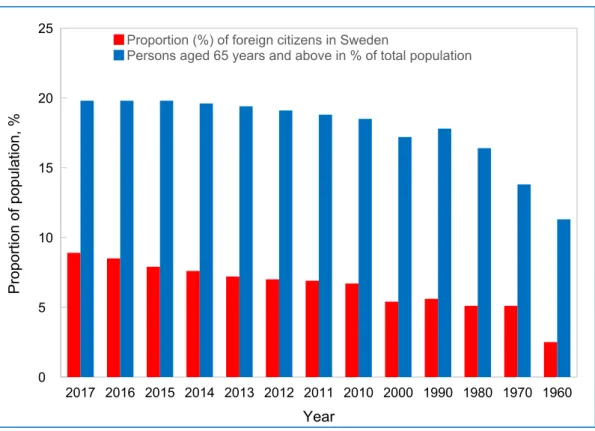
According to the Swedish population statistics (Statistics Sweden, 2018) summarized in Figure 2, it can be inferred that the Swedish population over the age of 65 years has increased from 11.3% to 19.8% from 1960 to 2017. It can also be concluded from the figure that the population of foreign citizens living in Sweden has increased by 256% over the same period of year. The above information could imply that the acceptance and usage of self-scanning technology at the grocery stores may vary among Swedish populace based on the different demographic segments of the Swedish population. For instance, Kadhim (2018)investigated how the Electronics Health Records (EHRs) can be improved to motivate foreigners living in Sweden to use the system. The author concluded that non-Swedish patients were not interested to use EHRs system because of Swedish language difficulty. In a similar study, Islam (2012) identified various ways by which smartcard users can be facilitated to access the control and services of different organizations in a better way. The study revealed that Swedish people were more adaptive to smartcard than their foreign counterparts (i.e. non-Swedish) living in Sweden. Based on the above information, one could suggest that, continuous acceptance and usage of self-scanners between the Swedish and non-Swedish may significantly be influenced by their educational background, income, age, perceived complexity, perceived benefits, language difficulty, perceived ease-of-use, perceived risk and perceived enjoyment of the technology (Kadhim, 2018; Dean, 2008; Roy and Sinha, 2014).
Several studies have been conducted by various scholars on the acceptance of technological innovation in the retail stores (Bitner et al., 2002; Dabholkar et al., 2003; Lai, 2017; Meuter et al., 2005; Marzocchi and Zammit, 2006; Demoulin and Djelassi, 2016). Although, previous study showed that demographic factors such as age, gender and education had no influence on the usage of self-checkout counters (Dabholkar et al.,
2003), but recent studies have shown that the extent of adoption of self-service technologies differed across demographic groups (Leng and Wee, 2017; Lee et al. 2010; Wang et al., 2012). Dean (2008) concluded that customers who accept self-service technologies are usually younger people, who have better education with higher remunerations. Based on the above analysis and to the best of the author’s knowledge, there is no study available in the literature focusing on the comparison of Swedish and non-Swedish Customers’ perception of grocery instore scanner experience, which is the core of this thesis.
2017 2016 2015 2014 2013 2012 2011 2010 2000 1990 1980 1970 1960 Year 0 5 10 15 20 25 Proportion of population, %
Proportion (%) of foreign citizens in Sweden
Persons aged 65 years and above in % of total population
Figure 2 Summary of Population Statistics 1960–2017 (Statistics Sweden, 2018) In line with the current trends in digitalization research domain, this study dwell on personal shopping solution with focus on retailing grocery in-store scanner. This study will build on extant studies and examine the grocery customer behaviour towards an emerging technology of scanner. The study will investigate demographics and psychographics of grocery customers and compare between the youth, young adult and the senior in Sweden; and also compare between Swedish and non-Swedish resident in Sweden. Further, the study will be grounded in the theory of buyer behaviour as the fundamental theoretical model and examine the grocery scanner use based on 5 Likert scale. The study is positioned to ascertain the usefulness and use of grocery scanner based on different age groups and gender. The insight from this study will be useful for
the retailers to have better understanding of their customer’s attitudinal behaviour in respect of grocery scanner and offer suggestion for a meaningful segmentation that can impact the sales and revenue of the retailers and the convenience of the grocery customers.
Research Purpose and Questions
The study intends to examine how digitalization affect consumer’s instore shopping behaviour. To ensure that the purpose of this study is achieved, and test the relationship between gender and age group, Swedish and non-Swedish customers’ behaviour and perceive service quality, the underlisted research questions will guide this study:
Are there differences in perceived usefulness and perceived ease of use between Swedish users and non-Swedish users of instore self-scanning?
Are there differences between Swedish users and non-Swedish users of instore self-scanning in how they perceive the characteristics of self-scanning in Sweden (that is, ease of use, usefulness, relative advantage and complexity)?
Limitation
The purposive sampling employed in this study will limit the generalizability of findings. This study will not be generalizable to all areas of retailing stores. The study is limited by financial resources and geographical boundary. The theory of plan behaviour will not be investigated in this study, but it will be used as a complementary theory to explain some of the findings where it is necessary. It is pertinent to state that two constructs, taken from each of TAM and DOI, are used to study the self-scanner grocery instore experience between the Swedish and non-Swedish retail customers. Therefore, it is not all the characteristics of the two models (TAM and DOI) were used to investigate the current research problem.
2. Theoretical Framework
_____________________________________________________________________________________
This chapter presents a theoretical framework to understand the subject of the thesis. The chapter provides a review of literature on the most important subjects of the thesis which include self-scanning technology, service encounter, service quality and consumers satisfaction. Furthermore, a comprehensive literature study on the relevant behavioural theories, such as the theory of planned behaviour, technology acceptance model and theory of innovation diffusion are discussed.
______________________________________________________________________
2.1 Self-scanning Technology
Self-scanning can be described as an innovative technology-based service delivery device, a form of self-service that involves customer participation in service creation (Marzocchi and Zammit, 2006). Self-scanning is installed by companies to improve their productivity (Walker et al., 2002; Demoulin and Djelassi, 2016), and simultaneously enhancing customer satisfaction by providing new and convenient service channels (Meuter et al., 2003; Orel and Kara, 2014). The impact and benefit of self-scanning on service delivery and customer satisfaction can be identified as an ambiguous, which implies that it can be beneficial and at the same time unfavourable. For instance, the US grocery chains Albertsons and Jewel-Osco have removed the self-service technology in some of their stores to enhance customers experience and provide a service that promotes more human interaction (Demoulin and Djelassi, 2016). A similar trend was noticed in Canadian grocery stores, where some of the retailing stores have removed self-service technology from their stores, a typical example of this is Previgo (Sherman, 2014). Furthermore, in France which is one of the European countries, most customers find self-service technology as inappropriate, therefore they prefer the conventional checkout (Demoulin and Djelassi, 2016). From the above explanation, it can be inferred that the grocery store owners need to understand the benefits accrue to them by using self-scanning technology as well as how the technology can improve customers satisfaction.
2.1.1 Advantages and disadvantages of Self-scanning
Self-scanning is one of the self-service technology (SST) which has been noted to provide several advantages to both customers and retailers. These advantages among others include, (i) ease of use, (ii) offer flexibility and customize services, (iii) avoid service personnel, (iv) it saves time, (v) it saves money, (vi) it improves service quality perception (Bitner et al., 2000a; Meuter et al., 2000, 2003). Lee et al. (2012) asserted that the benefits of using self-service technologies is based on limited waiting time and, it saves time for the actual service. Another benefit of using self-service technology is that customers feel of overseeing service delivery process and they are being responsible for the service by themselves (Dabholkar et al., 2003; Sarel and Marmorstein, 2003). Because of technological accuracy, self-scanning technology could prevent a wrong price mistake that a service employee could make in a retail store (Yan et al., 2013; Dabholkar et al., 2003; Dabholkar, 1996). However, by using SST customers could avoid having interactions with the service employee, and as well avoid a long queue at the traditional service counter (Lee et al., 2012).
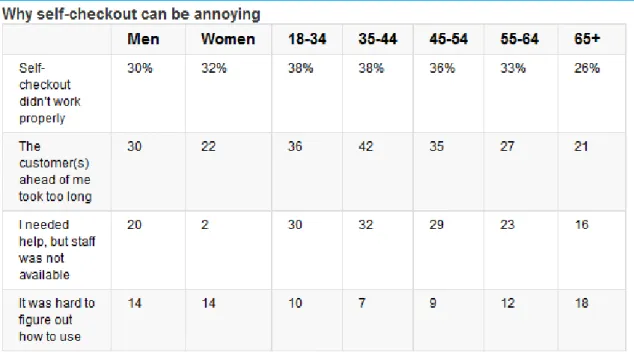
Table 1 Consumers’ self-checkout experience as a function of gender and age (Consumer Reports, 2015).
The major disadvantage of using SST has been identified as the technological failure associated with technology-based encounters (Forbes, 2008; Meuter et al., 2000). This failure could occur because of technology malfunctioning of the self-scanning device.
However, when this difficulty is not properly managed by the retail store, customers may lose hope in using such technological device, which will also lead to a reduction in customer’s satisfaction and hence lower customer usage of the device. For instance, according to the survey conducted by Consumer Reports (2015) at different grocery stores (Table 1), the study revealed that about 30% of respondents complained that self-scanner malfunctioning while 22% were irritated because there was no service employee available to assist them. It was also observed that 14% found it difficult to navigate through the device.
Despite the above disadvantages of SSTs, many sectors are investing in it with a view of reducing labour cost, increasing customers satisfaction and improving service quality (Bitner et al., 2002). By using customers as resources, organisations aim at achieving not only more efficient business processes but also positive effects on customer satisfaction and customer loyalty (Klier et al., 2016). Nevertheless, for the firms to achieve their goals or benefits, they need to let the customer familiarize with the use of the technology (Meuter et al., 2005).
2.2 Service
To begin with, it is vital to have a clear understanding of what is service and what service quality is all about. To evaluate the impact and benefit of service quality of self-scanning on the customer satisfaction which is an essential part of this study, it is important to have a comprehensive understanding of what service is. According to Grönroos (2001, p46), “a service is a process consisting of a series of more or less intangible activities that normally, but not necessarily always, take place in the interactions between the customer and service employees and/or physical resources or goods and/or systems of the service provider, which are provided as solutions to customer problems”. Hill (1977) defines services as changes in the condition of a person or something in the possession of the customer. Lovelock (1991) believes a service is “a process or performance rather than a thing”. However, most scholars view services as activities, deeds or processes, and interactions (Zeithaml and Bitner, 2003; Vargo and Lusch, 2004).Most of the definitions centre on the customer and on the fact that services are provided as solutions to customer problems (Grönroos, 2000). From these definitions, three core dimensions of services are identified as (1) activities; (2) interactions (which we could say are what separate services from physical products);
and (3) solutions to customer problems (Grönroos, 2001; Edvardsson et al., 2005;). It can also be deduced from these definitions that service is tangible and intangible activities, and its main purpose is to provide solutions to the customer’s problems to accomplish customers’ needs and expectations.
2.2.1 Service Encounters
Service encounter or the moment of truth (Normann 1991) occurs whenever a customer interacts with the service organization. And it consists of remote encounter, telephone encounters and face to face encounters. Service encounters, sometimes referred to as “real-time marketing”, are the promises kept or broken (Wilson et al., 2016). According to Ramachandran and Chidambaram (2012), service encounter is called service scape which means physical environment where service is been delivered. Heinonen, (2008) asserts that service encounter occurs whenever a customer interacts with a company personally or through technology, for example, the internet, email, or telephone. Service encounters have been classified as traditional service encounter and remote service encounter. In traditional service encounter, customers have a direct interaction with the service employees and the input of customer in the service process is quite low (Bitner et al., 2000b). But in remote service encounter, customers’ interactions occur through a technology interface, where customer’s involvement in the service process is extensive (Heinonen, 2008). Several scholars have concluded that customer interaction and participation in service delivery has increased with the use of self-service technologies, such as online banking, automated filing of legal claims, or self-scanning at retail stores (Heinonen, 2008; Bitner et al., 2000a; Meuter et al., 2000; Lee et al., 2012).
2.2.2 Service Quality and Customer Satisfaction
It is a general belief that success in the marketplace relied solidly on the ability of an organization to create satisfied customers, which is a fundamental core of any business enterprise (Parasuraman et al.,1985; Arnold et al., 2005; Jashireh et al., 2016). To create satisfied customers, business organizations must provide quality and reliable services and products. However, satisfied customers are expected in return to demonstrate behaviours that are positive to the firm, such as future patronage and making recommendations to others (Jashireh et al., 2016). Many scholars have defined service quality in different ways. For instance, Patrick et al. (1996) explained that service
quality can be referred to as the difference between customers’ expectations for service performance prior to the service encounter and their perceptions of the service received. Service quality can also be defined as the customers’ overall impression of the relative inferiority/superiority of a service provider and its services (Bitner, 1990) and it is often considered similar to the customer’s overall attitude towards the company (Parasuraman et al., 1985). Consequently, service quality can be interpreted as the difference between customers’ expectation and perceptions of services delivered by service firms (Wang and Shieh, 2013). In their own definition, Nitecki et al. (2000) refers to service quality as “meeting or exceeding customer expectations, or as the difference between customer perceptions and expectations of service”. However, when perceived service is compared with the expected service, it results to customers perceived service quality (Grönroos, 1984). Bitner et al. (1990) opined that perceived service quality is a result of individual service encounter between the service provider and the customer, during which the customer evaluates quality and develops satisfaction or dissatisfaction. Because of the recognized importance of customer satisfaction, for example, better service quality enhances perceived service value and satisfaction; improves the service provider's customer retention and financial performance; and increases a firm's corporate image (Nguyen and Leblanc, 1998; Jashireh et al., 2016). Based on the above information, this thesis will examine how satisfied customers are when using self-scanning devices at the grocery stores.
2.3 Instore Grocery Buying Behaviour
The study of consumer behaviour is very important in marketing because it gives an indication on how firms could construct innovative and smarter marketing strategies by gaining an understanding of the factors that influence consumers’ decision making (Khaniwale, 2015). Several scholars have studied consumer behaviour because it has a direct impact on the overall performance of the businesses (Kotler and Keller, 2012), and also because its understanding has become crucial especially due to fierce competition in retail industry worldwide (Dudovskiy, 2015). Consumer behaviour examines how emotions, attitudes and preferences affect buying behaviour. The study of consumer behaviour attempts to investigate the characteristics of individual consumers such as demographics, personality lifestyles and behavioural variables such
as usage rates, usage occasion, loyalty, brand advocacy, and willingness to provide referrals, to understand people's wants and consumption (Gopal and Jindoliya, 2016). Customers buying behaviour is a key branch of customer behaviour as many organizations wanted to know why customers are buying their goods and services. The main purpose of studying consumer buying behaviour is to learn how individual costumers, groups or organizations choose, buy, use and dispose ideas, goods and services to satisfy their needs and wants (Gopal and Jindoliya, 2016), and the factors such as their previous experience, taste, price and branding on which the consumers base their purchasing decisions (Kotler and Keller, 2012; Dudovskiy, 2015). Acebron et al. (2000) investigated the impact of previous experience on buying behaviour of fresh foods, particularly mussels, and they found out that personal habits and previous experience of the consumers have a direct impact on the consumers’ purchase decision in the example of purchasing fresh mussels. The authors also discovered that the image of the product has a crucial impact on the purchasing decision of the consumer and further recommended that the product image should continuously be improved to encourage the consumers towards purchasing (Dudovskiy, 2015). However, with the increasing technology advancement, the growing globalization, increasing socio-economic involvement of businesses in foreign countries and the rising political interference in corporate world, it is becoming extremely difficult for business organizations to manage and develop their business (Bianchi and Andrews, 2012; Khaniwale, 2015). Various organizations have employed several strategies to optimize the utilization of the available resources, and simultaneously strive to reduce their costs and generate maximum revenue. This study intends to investigate how self-scanning technology at the grocery stores influences consumer buying behaviours.
2.4 Applied Behavioural Theories
2.4.1 Theory of Planned Behaviour Model
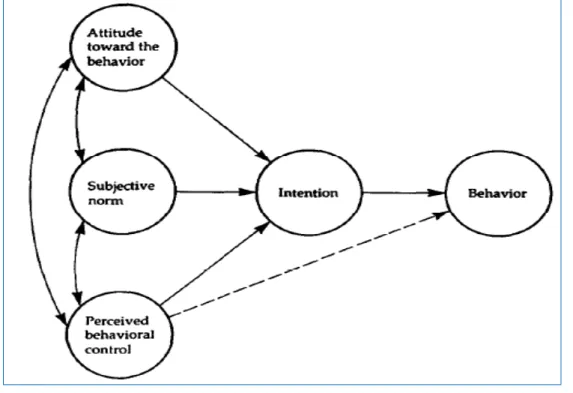
The “Theory of Planned Behaviour” (TPB) is a well-known social-psychological model used to study and predict human intentions and behaviour in situations where an individual might lack control over his own behaviour (Al-Lozi and Papazafeiropoulou 2012). TPB was proposed by Ajzen (1991) (Figure 3) and was a refinement of the “Theory of Reasoned Action” (TRA) developed by Ajzen and Fishbein, (1980). The only difference between the theory of reasoned action and the theory of planned action
is the inclusion of a third determinant of behavioural intention, called the perceived behavioural control (PBC) as shown in Figure 3. Ajzen (1991) defines perceived behavioural control as “People's perception of the ease or difficulty of performing the behaviour of interest which in turn depends on the self-efficacy which is the judgments of how well one can execute courses of action required to deal with prospective situations”. PBC is the control which consumers perceive that may limit their behaviour, for instance, can I use a self-scanning device for my shopping and what are the requirements? Moreover, TPB measures the direct impact of the customers’ intentions on the actual behaviour, and these intentions are affected by the attitude and subjective norm a customer holds before engaging in a behaviour (Figure 3). Several scholars have considered TPB as a very useful and powerful model for explaining and predicting human behaviour, because it provides more information to explain behaviour (Taylor and Tod 1995; Al-Lozi and Papazafeiropoulou 2012). Consequently, TPB offers good prediction while using few predictors and gives a comprehensive understanding of the phenomena as it includes variables with very different conceptual scope (Al-Lozi and Papazafeiropoulou 2012). Although, TPB will not be exclusively used in this study, but it will be employed as a complementary theory to interpret some of the findings where it is applicable.
Figure 3 Theory of Planned Behaviour (Ajzen, 1991)
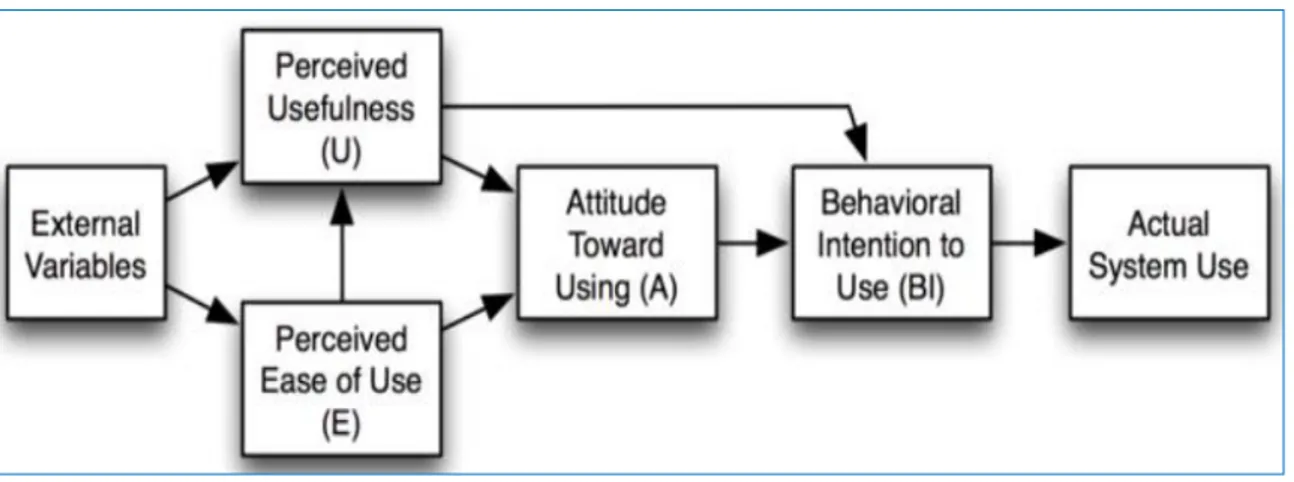
The technology acceptance model (TAM) was developed by Davis (1989), which is an adaptation of the “Theory of Reasoned Action”, proposed by Ajzen and Fishbein (1980), that tries to describe people’s actions by identifying the causal connections between various constructs, namely attitudes, beliefs,behaviours and intentions (Figure 4). TAM was developed to specifically explain and predict user’s behaviour to use a technological innovation, especially in the user acceptance of information technology (Sharma and Mishra, 2014). Different from the theory of reasoned action, TAM was made of two major variables, that is, independent variables that include “perceived usefulness” and “perceived ease-of-use”; and the dependent variable, i.e., “Attitude towards using” (Figure 4). TAM has been used extensively in technology adoption studies due to its simplicity (Elliott et al., 2012). However, several scholars have
debated on the suitability of TAM to study all cases of information technology or information systems adoption and implementation (Bagozzi, 2007; Lee et al., 2011; Kiwanuka, 2015). For instance, Bagozzi (2007) has argued that TAM does not include a complete theory and method for identifying the determinants of perceived usefulness and perceived ease of use, as well as other bases for technology acceptance. The model also neglects the influence of group, social, and cultural aspects of decision making.
Figure 4 Technology Acceptance Model, TAM (Davis, 1989)
Moreover, TAM has been modified several times to empirically validate certain assumptions. For instance, Venkatesh and Davis (2000) extended the original TAM by adding social influence and cognitive instrumental processes as influencers of technology acceptance (Figure 5). Similarly, Venkatesh and Bala (2008) developed an integrated model of technology acceptance called TAM 3, by combining TAM2 (Venkatesh and Davis, 2000) and the model of the determinants of perceived ease of use (Venkatesh, 2000). TAM3 was developed by using the four determinants of perceived
usefulness and perceived ease of use, which are the individual differences, system characteristics, social influence, and facilitating conditions (Lai, 2017).
Due to the limitations that one model or theory may have, Oliveira and Martins (2011) suggested that it is essential to use at least two theories to attain a better understanding of multifaceted novel information technology adoption. Hence, many scholars have developed their own models by extending the existing ones to accommodate their research problems.
Figure 5 The Technology Acceptance Model 2, TAM2 (Venkatesh and Davis, 2000)
2.4.3 Theory of Innovation Diffusion
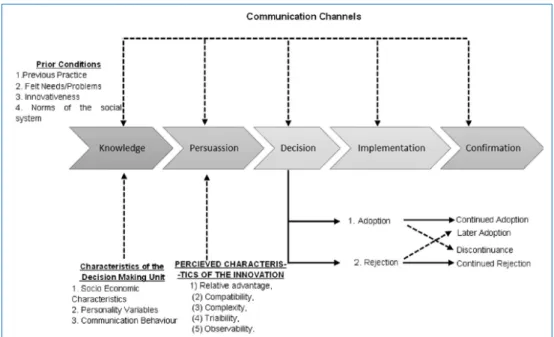
Diffusion of Innovation theory has been used to investigate user adoption of innovation in various areas of research including agriculture, sociology, information systems, and manufacturing, among others (Kiwanuka, 2015). Roger (2003, p.11) defines diffusion as “the process by which an innovation is communicated through certain channels over time among the members of a social system”; while an innovation is “an idea, practice, or object that is perceived as new by an individual or another unit of adoption”. According to the Innovation Diffusion Theory, the adoption or acceptance rate of a new technology depends on five innovation constructs. These include complexity, observability, compatibility, trialability and relative advantage (Rogers, 2003; Wani and Ali, 2015). The first innovation characteristic “complexity,” is generally negatively
correlated with the rate of technology adoption while the last four factors are generally positively correlated with the rate of technology adoption (Abu-Khadra and Ziadat, 2012). Although the theory of diffusion innovation recognizes a behavioural process, movement from awareness to acceptance, it does not explain how attitudes form and ultimately lead to acceptance or rejection, nor how innovation attributes fit the process (Mohammadi, 2015). The Diffusion of Innovation Theory also reveals the four factors that influence the spread of a new idea (innovation), which include the innovation, communication channels, time and social system. However, Figure 6 illustrates the process of innovation diffusion which consists of five steps, namely, knowledge, persuasion, decision, implementation, and confirmation (Kiwanuka, 2015). The theory categorises the adopters of a technology into innovators, early adopters, early majority, late majority and laggards (Sharma and Mishra, 2014; Robinson, 2009). Rogers (2003) claimed that, in innovation diffusion theory, the perceived characteristics of innovation diffusion account for between 47% and 87% of the differences in adoption of innovations (Robinson, 2009). Abu-Khadra and Ziadat (2012) concluded that the theory of innovation diffusion remains the only theory that has been widely used to evaluate adoption of technology on the individual and organizational levels.
3. Research Model and Hypotheses
_____________________________________________________________________________________
This chapter illustrates the proposed conceptual research model used in this investigation. The proposed model was drawn from the technology acceptance model and the theory of innovation diffusion. The constructs of the model are briefly discussed in relation to the present study with some hypotheses.
______________________________________________________________________
1.1 Conceptual Model
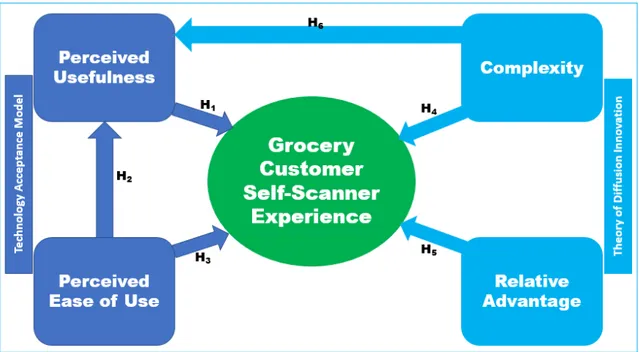
To understand the determinants of the actual use of self-scanner at the grocery stores in Sweden and the influencing situational factors, the theory of diffusion innovation (Rogers, 2003) and technology acceptance model 2, TAM2 (Venkatesh and Davis, 2000) were combined to proffer solutions to the current research questions. Two determinants were drawn from each of the two models to investigate the behavioural intentions to use self-scanners by both Swedish and non-Swedish grocery stores consumers. The proposed conceptual self-scanning model for this study is presented in Figure 7.
Figure 7 Proposed conceptual self-scanning model
1.2 Perceived Usefulness
According to Davis (1989), perceived usefulness is the degree to which a person believes that using a particular system would enhance his or her job performance. Venkatesh and Davis (2000, p.187) argued that perceived usefulness has been established as a strong determinant of user acceptance in the technology acceptance model studies. Self-scanning technology is regarded as a majorly useful system, prepared to simplify customers’ checkout process in retail stores. Therefore, the significance of self-scanner usefulness by the grocery store customers is easily justified in the context of the current research study. In the utilitarian view, Childers et al. (2001) concluded that consumers are concerned with purchasing products in a timely and efficient way to achieve their goals with less frustration. The main purpose of using self-scanners in a grocery store is to ease customers’ shopping experience through an efficient and rapid check-out process. In this regard, the usefulness concept of this model is composed to describe this purpose. Thus, it is hypothesized here that:
H1: There is a difference between the Swedish and non-Swedish (Foreigners) perceived
3.1 Perceived Ease-of-Use
Perceived ease of use is the degree to which a person believes that using a particular system would be free of effort (Davis, 1989, p.320). TAM suggests that ease of use is a precondition for perceived usefulness (Davis, 1989; Demoulin and Djelassi, 2016). However, the more a system is regarded as demanding less effort, the more it is perceived as useful, for which empirical support exists under different situations (Lu et al., 2009; Demoulin and Djelassi, 2016), including self-service technology (Oh et al., 2013) of which self-scanner belongs. Self-scanners are meant to be used by all grocery store customers (both Swedish and foreigners), irrespective of their prior familiarity with the self-scanning technology. It is imperative to know that, the perceived effort required to use self-scanner at the grocery stores can greatly influence the customers’ intention to use the self-scanning device during their shopping. Consequentially, perceived ease of use is considered as a major independent factor that determines consumer’s intention to use self-scanners at the grocery stores. Therefore, the following hypotheses are proposed:
H2: There is a difference between the Swedish and non-Swedish perceived ease-of-use
of grocery self-scanner and perceived usefulness.
H3: There is a difference between the Swedish and non-Swedish perceived ease-of-use
of grocery self-scanner and their self-scanner experience.
3.2 Relative Advantage
Relative advantage is described as “the degree to which an innovation is perceived as better than the idea it supersedes by a particular group of users, measured in terms that matter to those users, like economic advantage, social prestige, convenience, or satisfaction” (Robinson, 2009). When the perceived relative advantage of an innovation is high, it increases the rate at which the innovation is adopted. Wani and Ali (2015) declares that individuals can only adopt a new idea, a new product or a service if they perceive it to be a better option than the one in practice. In another word, if grocery store customers realize a new innovation (self-scanner) is more advantageous than the operational one (e.g. traditional check-out), they will be compelled to adopt the new innovation. It can be deduced that, the more advantageous the self-scanner is to the grocery consumers, the quicker the technological innovation will diffuse in a social
system. It has been suggested that the degree of relative advantage is usually anchored on the economic profitability, low initial costs, social prestige, saving time and effort, immediacy of rewards, and reduce discomfort (Francesco, 2012; Wani and Ali, 2015). Therefore, for various groups of Swedish grocery shoppers to widely use self-scanners during shopping, the device must be viewed as having a relative advantage over the alternative. That is, the self-scanner should be reliable, save time and effort, and yielding immediate rewards. Thus, the hypothesis below is suggested:
H4: There is a difference between the Swedish and non-Swedish perceived relative
advantage of grocery self-scanner and their self-scanner experience.
3.3 Complexity
Rogers (2003) defines complexity as the degree to which an innovation is perceived as relatively difficult to understand and use. Different from the other innovation attributes, complexity has an inverse influence on the rate of adoption of an innovation(Wani and Ali, 2015). Rogers (2003), however, suggested that the simpler the innovation, the higher the rate at which it would be adopted. Although, this assertion may not necessarily true for all circumstances because some high-tech products are perceived more beneficial due to their complexity, but in some cases the rule of simplicity has a positive influence on the diffusion of an innovation (Wani and Ali, 2015). According to Zolait and Ainin, 2008, some innovations are easy to understand, communicate and use at first sight, while others are more complicated and require a long time to diffuse. In TAM model, Davis (1989) established that the perceived ease of use has a direct influence on consumers’ attitudes. Rogers (2003) demonstrated that a negative relationship exists between complexity and the rate of innovation adoption and concluded that complexity increases rejection rates. Based on the above information, self-scanners are expected to be made simple and not complicated to encourage the grocery consumers to accept and use them regularly during their shopping. Therefore, the hypotheses below are posited:
H5: There is a difference between the Swedish and non-Swedish perceived complexity of
H6: There is a difference between Swedish and non-Swedish perceived complexity of a
self-scanner and its perceived usefulness at the grocery stores in Sweden.
4. Methodology
__________________________________________________________________________________
This chapter deals with various approaches or methods used in the thesis by the author. Sampling, formulation and administration of questionnaire, data collection and interpretation, validity and reliability issues are discussed in this section
____________________________________________________________________
1.3 Research Approach
The overall goal of this study was to describe, analyse and evaluate customers shopping experience in a grocery store using self-scanners. An explanatory approach was employed to examine the theory of buyer behaviour. However, relevant literature on personal service, service encounter, consumer grocery store experience, consumer buying behaviour were reviewed. The empirical aspect of the study was based on a quantitative approach. Data were collected through an online survey targeting various
age groups, gender, Swedish, and foreigners living in Sweden. In addition to this, a face-to-face questionnaire survey was used to collect data suitable to address the research objectives (Collis and Hussey, 2013). The data collected through this questionnaire survey were used to analyse customer’s attitudes, service encounter, expectations and perceptions about instore self-scanning experience.
4.1.1 Sampling method
Sampling is an important aspect of conducting a research. Sampling is simply described as a process of selecting a number of population elements on which the measurements is being sought for and drawing a conclusion about the total population based on the sample (Ilker Etikan et al., 2016; Elfil and Negida, 2017). Two types of sampling method are generally used in research investigations - representative or probability sampling, and judgemental or non-probability sampling. In a representative sampling method, every individual member of the total population has a known and equal chance (greater than zero) of being chosen. One of the major disadvantages of probability sampling is that there must be a sampling frame containing the list of all the members of the total population which is often impossible (Ashraful-Islam, 2011). Since it is impossible to have the total list of all the customers that actually used self-scanners to complete their shopping in the grocery stores. It is therefore reasonable not to select the probability sampling method in this study.
In this study, non-probability sampling method was adopted due to its cost-effectiveness and time-effectiveness when compared to the probability sampling method (Collis and Hussey, 2013). Considering the time frame available for this study, it is convenient to use non-probability approach since the probability sampling method is impracticable in the context of this study.
4.1.2 Research Design and Questionnaire Survey
The study employs a survey as a tool for examining the factors affecting the use of grocery scanner in Sweden and to investigate the differences in using grocery self-scanner between the Swedish and Non-Swedish users. The survey consists of two parts. The first part depicts demographic questions regarding the Swedish and Non-Swedish grocery consumers. The second part focus on self-scanner use, and the 5-Likert scale questions was employed to measure the perception of self-scanner usefulness, ease of
use, complexity and relative advantage. The study will examine the importance of grocery self-scanner in Sweden, the necessity of self-scanner uses and its challenges. The study deems it fit to use the multigroup approach to study the phenomenon of self-scanner comprehensively.
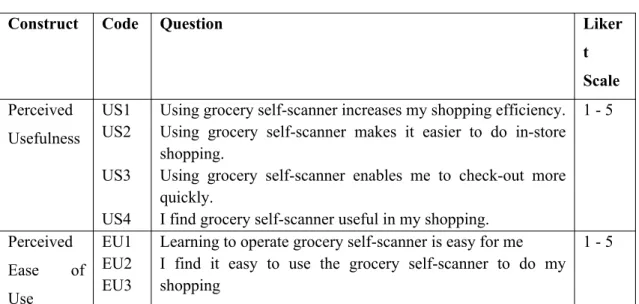
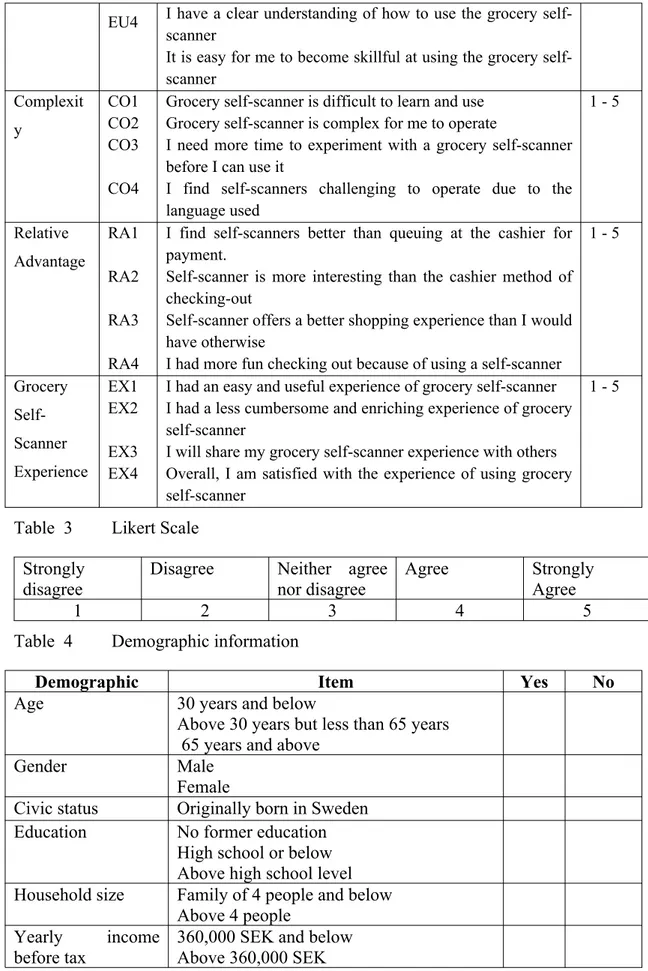
Collis and Hussey (2013, p205) describes questionnaire as “a list of carefully structured questions, which have been chosen after considerable testing with a view to eliciting reliable responses from a particular group of people”. Questionnaires are generally used to address research questions in either descriptive or explanatory research. To avoid misinterpretation of questionnaire by the respondents, the questions used were carefully drafted using simple words and sentences to prevent misinterpretation. Closed-ended questions were asked to avoid unnecessary data collection, complexity and to save time. A closed question is one that requires a “yes” or “no” or a short factual answer, or it requires the respondent to select from a list of predetermined answers. Closed-ended question was employed in the study because it is quick and simple to answer (Collis and Hussey, 2013). Moreover, the format and structure of questionnaire are very important for research (Collis and Hussey, 2013; Cooper and Schindler, 2008). The questions were organised by themes and carefully designed to provide answers to the research questions as well as the constructs derived from TAM and Innovation Diffusion Theory. The used questionnaire is provided in Table 2, while the responses were collected using a five-point Likert-type bipolar scale (Table 3). Also, to obtain the demographic information of the respondents, a series of demographic questions were formulated and included in the questionnaire. A typical of this is shown in Table 4.
Table 2 Formulated questionaires based on the proposed model variables
Construct Code Question Liker
t Scale Perceived Usefulness US1 US2 US3 US4
Using grocery self-scanner increases my shopping efficiency. Using grocery self-scanner makes it easier to do in-store shopping.
Using grocery self-scanner enables me to check-out more quickly.
I find grocery self-scanner useful in my shopping.
1 - 5 Perceived Ease of Use EU1 EU2 EU3
Learning to operate grocery self-scanner is easy for me I find it easy to use the grocery self-scanner to do my shopping
EU4 I have a clear understanding of how to use the grocery self-scanner
It is easy for me to become skillful at using the grocery self-scanner Complexit y CO1 CO2 CO3 CO4
Grocery self-scanner is difficult to learn and use Grocery self-scanner is complex for me to operate
I need more time to experiment with a grocery self-scanner before I can use it
I find self-scanners challenging to operate due to the language used 1 - 5 Relative Advantage RA1 RA2 RA3 RA4
I find self-scanners better than queuing at the cashier for payment.
Self-scanner is more interesting than the cashier method of checking-out
Self-scanner offers a better shopping experience than I would have otherwise
I had more fun checking out because of using a self-scanner
1 - 5 Grocery Self-Scanner Experience EX1 EX2 EX3 EX4
I had an easy and useful experience of grocery self-scanner I had a less cumbersome and enriching experience of grocery self-scanner
I will share my grocery self-scanner experience with others Overall, I am satisfied with the experience of using grocery self-scanner
1 - 5
Table 3 Likert Scale Strongly
disagree Disagree Neither agree nor disagree Agree Strongly Agree
1 2 3 4 5
Table 4 Demographic information
Demographic Item Yes No
Age 30 years and below
Above 30 years but less than 65 years 65 years and above
Gender Male
Female
Civic status Originally born in Sweden
Education No former education
High school or below Above high school level Household size Family of 4 people and below
Above 4 people
Yearly income
before tax
360,000 SEK and below Above 360,000 SEK
The survey question was conducted by handling-out paper-based questionnaire to the respondents at different grocery stores in Sweden where self-scanning devices are already installed. Grocery customers were requested to participate in the survey (Appendix 1), after providing a brief explanation of the content and the academic purpose of the research. When a customer agreed to participate then a questionnaire was given directly to the customer and collected after it had been completed. In addition to the paper-based survey, the questionnaire was also made available to the respondents through a Google online survey platform (Survey questionnaire, 2018) that was created, and the link was distributed to the respondents via email address, Facebook messenger and WhatsApp platforms. This online survey link enabled me to get as many respondents as possible within the limited time frame was available for this study. The questionnaire was designed in a manner that would arouse the interest of the respondents, and hence enhance the rate of response. It is important to mention that, the purpose of the survey was fully explained, and the confidentiality of the respondents was assured to maximise response rate.
4.2 Research Methodology and Data Analysis
Quantitative research is an ideal methodology that utilizes numerical data to test a theory and establish relationship between the independent and dependent variables. Woodside (2010: 18-19) suggests that fixed-point survey is suitable to analyse data based on structural equation modelling (SEM) technique and it can be used to test the model validity. This postulation motivates the adoption of SEM for this study. SEM is used to build a model and it consists of measurement and structural model. The measurement model explores the relationship between variables and construct, and structural model on the other hand reveals the relationships between constructs. Sample size is very crucial in using SEM. The variables described in the proposed model (Figure 7) were compiled into a questionnaire (Appendix 1) with each variable having four questions. The survey question was answered by 74 respondents through a paper-based questionnaire and Google online survey link that was created. The online survey was created using Google form online survey platform (Survey questionnaire, 2018), and the link was distributed to the respondents via email address, Facebook messenger and WhatsApp platforms. All the respondents of the online survey were the people living in Sweden only.
To analyse the data collected from the survey, Partial Least Squares (PLS) technique of structural equation modelling was applied using SmartPLS 3.0 statistics software student version (SmartPLS, 2018). This method is suitable for validating predictive models especially composite and complex models and it is appropriate to correctly specify model (Chin, 1998; Adhikari et al., 2018). Furthermore, through SEM analysis, the assessment of the measurement model and the evaluation of the structural model and the R2 can be made (Adhikari et al., 2018; Hair et al., 2012). The study explored average variance extracted (AVE), composite reliability (CR), correlations for convergent validity, significance of the constructs based on T-Test and significance levels. Further, the study conducted a multigroup analysis between the Swedish and Non-Swedish users of self-scanner and ascertain if the respondent’s perception regarding perceived usefulness, ease of use, complexity, relative advantage and experience are significantly different.
4.3 Data reliability
Reliability is concerned with the consistency and acceptability of research. However, reliability is referred to as the accuracy and precision of the measurement and absence of differences in the results if the research were repeated (Collis and Hussey, 2013). To ensure the reliability of the data presented in this research, the following steps were taken:
1) Raw data were critically checked to remove outliers and carefully coded before conducting statistical data analysis.
2) Questionnaire was structured after considering the relevant key issues and constructs provided in the conceptual model.
3) A paper-based questionnaire survey was performed. The importance of the survey was explained to the respondents and effort was given to maximise the response rate that reduced non-response error and increased reliability.
4) A pilot test was conducted to ensure that the content and wordings of the questions were fully understood by the respondents. Doing so would improve the questionnaire quality, increase response rate, and decrease non-response error.
4.4 Data validity
Validity of research can be described as an extent at which requirements of scientific research method have been followed during the process of generating research findings (Research Methodology, 2018). Validity can also be interpreted as the trustworthiness and credibility of the work done. High validity indicates that the study was based on sufficient facts and the result should be credible (Collis and Hussey, 2013). The validity of the research data was ensured by undertaking the following steps:
a) Appropriate time scale was chosen for the investigation to ensure that all the components of the study were performed at the right time.
b) Appropriate methodology that considered the characteristics of the study was selected to ensure that all aspects of the research questions were cared for.
c) A suitable sampling method was selected to ensure that data collection was free from any constraints.
d) It was ensured that the respondents were not pressured in any ways to select specific choices among the available answer sets.
5. Results
_____________________________________________________________________________________
This chapter presents the general findings of the investigation to provide the reader with a broad perspective of the results, followed by full analysis of the results in relation to the conceptual self-scanner model.
______________________________________________________________________
1.4 Results
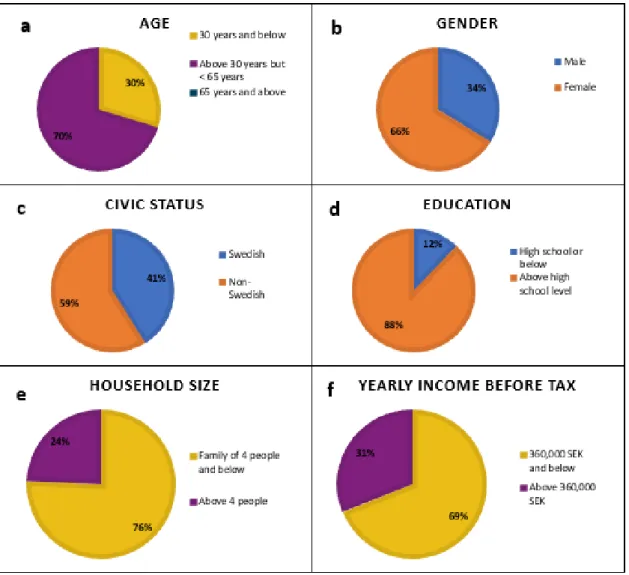
Figure 8 presents the demography of the respondents. It can be seen from Figure 8a that most of the respondents fall into the age group that is greater than 30 years but less than 65 years (70%), while the remaining 30% of the respondents are aged 30 years and below. Unfortunately, people of age 65 years and above could not be reached within the period of the survey. More females (66%) participated in the survey than their male (34%) counterparts (Figure 8b). The result reveals that 41% of the respondents are Swedish and the remainder 59% are non-Swedish (Figure 8c). All the participants in the survey have a High school education or higher. Figure 8d shows that 12% of the participants have a maximum of a High school education while the remaining 88% has more than High school education. Survey result suggests that 76% of the respondents have a household size of four people or below, and the rest 24% have more than four people in their family (Figure 8e). The study demography also depicts the high and low earners among the respondents. Figure 8f reveals that the high-income earners received above 360,000 SEK per year before tax (31.0%) while the low-income earners earned less than 360,000 SEK/year (69%) before tax.
Figure 8 Demographic information of the respondents
5.1.1 Measurement Model Evaluation
According to the recommendations given by Roldán and Sánchez-Franco (2012), the first step to evaluate the proposed model was to analyse the values of “Factor Loadings”, “Composite Reliability (CR)”, “Cronbach Alpha (CA)” and “Average Variance Extracted (AVE)” as provided in Table 5. To establish the robustness of the study convergent validity, the items loadings should be greater than 0.50 (Chin, 2010), and this threshold has been established in the earlier multivariate analysis study conducted by Anderson et al., (2010). However, Fornell and Larcker (1981) classified factor loading into different groups as poor (with value <0.30), fair (with value between 0.31 – 0.50), moderate (with value between 0.51 – 0.60), moderately strong (with value between 0.61 – 0.80), and very strong (with value between 0.81 – 1.0). By critically examining the values of the loading factor of the model’s variables as presented in
Table 5, it is seen that loading factor of the model’s variables ranges from 0.69 to 0.95, which is greater than the threshold value of 0.5. This implies that the convergent validity of the model is fulfilled. The reliability of the model was examined by measuring Cronbach's alpha and composite reliability (Table 5). For the model to be considered reliable, the values of composite reliability and Cronbach’s alpha must each be greater than 0.7 (Tavakol and Dennick, 2011; Bagozzi and Yi, 1988). As depicted in Table 5, the Cronbach’s alpha (α) values and composite reliability of the model ranged from 0.82-0.92 and 0.88-0.94, respectively. These indicators imply that the general model is reliable, and that the latent construct is consistent.
Table 5 Overall Confirmatory Factor Analysis (CFA) for the measurement model Constructs and measurement items Standardized loadings Mean SD CA CR AVE Relative Advantage RA1 RA2 RA3 RA4 0.69 0.82 0.91 0.93 3,90 3.60 3.44 3.43 1.20 1.23 1.22 1.21 0.86 0.91 0.71 Complexity CO1 CO2 CO3 CO4 0.95 0.94 0.87 0.70 2.21 2.12 2.19 1.96 1.30 1.28 1.36 1.04 0.89 0.93 0.76 Ease of Use EU1 EU2 EU3 EU4 0.88 0.85 0.87 0.90 4.16 3.84 4.04 4.03 1.09 1.18 1.08 1.07 0.90 0.93 0.77 Experience EX1 EX2 EX3 EX4 0.69 0.73 0.89 0.88 3.73 3.33 3.01 3.90 1.22 1.25 1.36 1.13 0.82 0,88 0.65 Usefulness US1 US2 US3 US4 0.93 0.90 0.83 0.92 3.71 3.96 4.18 3.81 1.22 1.04 0.99 1.18 0.92 0.94 0.80
Note: SD: Standard Deviation, CA: Cronbach Alpha, CR: Composite Reliability, AVE: