For Peer Review
Factors influencing Internet usage in older-adults (65 years and above) living in rural and urban Sweden.
Journal: Health Informatics Journal Manuscript ID: HIJ-13-0004.R3
Manuscript Type: Original Article Date Submitted by the Author: n/a
Complete List of Authors: BERNER, JESSICA; Blekinge Institute of Technology, Department of Health Rennemark, Mikael; Blekinge Institute of Technology, Department of Health; Linnaeus University,
Jogréus, Claes; Blekinge Institute of Technology, Department of Mathematics and Natural Sciences
Anderberg, Peter; Blekinge Institute of Technology, Department of Health Sköldunger, Anders; Aging Research Center, Karolinska Institute & Stockholm University,
Wahlberg, Maria; Stockholm University , Care Sciences and Society; Aging Research Center, Karolinksa Insitute, Department of Neurobiology
Elmståhl, Sölve; Lund University and Skåne University Hospital, Department of Health Sciences, Division of Geriatric Medicine
Berglund, Johan; Blekinge Institute of Technology, Department of Health
Keywords:
collaborative work practices and IT, health information on the Web, healthcare service innovation and IT, IT design and development methodologies, healthcare professional training
Abstract:
Older-adults living in rural and urban areas have shown to distinguish themselves in technology adoption; a clearer profile of their Internet use is important in order to provide better technological and healthcare solutions. Older-adults’ Internet use was investigated across large to midsize cities and rural Sweden.
The sample consisted of 7181 older-adults ranging from 59-100 years old. Internet use was investigated with: age, education, gender, household economy, cognition, living alone/or with someone and rural/urban living. Logistic regression was used.
Those living in rural areas used the Internet less than their urban
counterparts. Being younger and higher educated influenced Internet use; for older urban adults these factors as well as living with someone and
For Peer Review
having good cognitive functioning were influential.
Solutions are needed to avoid the exclusion of some older-adults by a society that is today being shaped by the Internet.
Key words: Older-adults; Internet use; rural and urban living
2 3 4 5 6 7 8 9 10 11 12 13 14 15 16 17 18 19 20 21 22 23 24 25 26 27 28 29 30 31 32 33 34 35 36 37 38 39 40 41 42 43 44 45 46 47 48 49 50 51 52 53 54 55 56 57 58
For Peer Review
IntroductionGlobalisation and the Internet have created easier connectivity between people, where we no longer think of location in the same way as twenty years ago. However, there are still rural and urban divides; noticeably trade and economic development have contributed to a considerable gap in economic conditions between rural and urban living (1,2).
Depending on geographical location, there is also a divide in the use of the Internet (3). What was noted from the beginning of the Internet era 1995(4), was that the Internet is a valuable source of communication that is quick, affordable and where living location no longer matters (5). Ironically it still does. American studies claim that rural living means less extensive use of the Internet (6), and also different types of uses (7). Some studies conducted showed that older-adults (65 years of age and above) living in rural areas
contribute to the digital divide, as there is a wide gap in adoption of technology between older-adults living in rural vs. urban areas (8,9). Urban living has also been positively related to more computer usage (8). Few studies have focused on which variables explain the differences in Internet use and technology adoption by older-adults that live in rural or urban settings.
It is important to highlight where the equity of access is less evident, as the Internet can be a valuable resource for older-adults; for example, to look up information, maintain social contact and take advantage of possibilities such as online shopping and health status monitoring (10). In addition, online services can contribute to easier access to health care, where, for example, distance may no longer be a hindrance to receiving adequate care. This can already be seen today with online health care planning, which can provide more efficient access to health care (11). Living in remote areas or far from a hospital, health care centre and town can thereby become less of a problem.
The Internet may function as an alternative to face-to-face health care services for the older adult. Health promoting functions, or technological and Internet applications could be a good way for older-adults to maintain independence and to live at home as long as possible. This is often a preferred choice by older-adults in developed countries (12). Slowly the industrialised world is implementing mobile solutions with functions such as reminders to take medications, sensors, and audio-visual connections with a nurse (13). These possibilities 2 3 4 5 6 7 8 9 10 11 12 13 14 15 16 17 18 19 20 21 22 23 24 25 26 27 28 29 30 31 32 33 34 35 36 37 38 39 40 41 42 43 44 45 46 47 48 49 50 51 52 53 54 55 56 57 58 59
For Peer Review
are a solution for the increasing number of older-adults who are frail and need special support. There are however serious hindrances to the aforementioned technologies. One is that they are often developed without the specific needs and consultation of the elderly or the clinician (14). Secondly they rely on the older adult to be somewhat technologically knowledgeable (15).
It is possible that what we are noticing today is in fact a cohort effect. Today’s older-adult is not an evident technology and Internet user but perhaps the next generation will be. In the last six years there has been an increase in the Internet use among older-adults (16,17). Yet, they are still slower than younger adults to adopt the Internet (16,18,19). In Europe for example, there is much less Internet use by senior citizens in compared to younger adults (20). A group that has been especially marginalised are the oldest-old – people in their eighties and in their nineties (octogenarians and nonagenarians) – who are not adapting at all compared to the younger-older adults (65-80 years of age) (18).
Background (Factors affecting Internet usage of older-adults)
Age and education are both strong predictors to whether the older-adults adapt to the Internet (21,22). They have been linked directly to computer anxiety, which has been shown to be positively correlated with age; similarly higher education was linked to interest and computer use for older people (23). Other studies have shown that older-adults will refrain from using the Internet because it is too expensive (18); which in some studies has been correlated with lower income, household economy and socio-economic status (24). Being male, is a factor affecting older-adults’ computer and Internet usage- even still in the last decade (16).
If the interface of computers and the Internet do not take into account the cognitive functioning of younger-older adults (65-80 years of age) and oldest-older adults (80 years and above), as well as normal age related physical declines, such as eyesight, (19,25), there will be less Internet usage. Studies have even suggested more awareness to create senior friendly websites, taking into account cognitive decline (26). Lower cognitive functioning has been related to not starting to use the Internet in old age (16). Some studies have highlighted that cognitive aspects are less understood than other age-related declines, when it comes to 2 3 4 5 6 7 8 9 10 11 12 13 14 15 16 17 18 19 20 21 22 23 24 25 26 27 28 29 30 31 32 33 34 35 36 37 38 39 40 41 42 43 44 45 46 47 48 49 50 51 52 53 54 55 56 57 58
For Peer Review
Internet use by older adults (27). Some authors have distinguished between what type of cognitive abilities affect what use, such as problem solving and short term memory (fluid intelligence) which are strong predictors of web use (28).
Living in a rural or urban area may have implications on technology adoption. Boase (6), has indicated that there is an element of access to Internet, which influences the use in rural areas; however other demographic factors also have a significant relationship on rurality and high-speed Internet adoption. Previous research indicated that Internet access is mainly adopted by the older-adults if the broadband access is good and there is a perceived usefulness and usability (27).
Sweden has a very good Internet connection partly due to its high fibre
networks. In 2010, Sweden rated second in most broadband subscriptions per inhabitant in the Nordic countries (where Denmark was first)(29). Since 1995, the Internet access has
increased annually from 2% to 89% in 2012 (30). Sweden has been striving for an equal level of access to the total Swedish population, in an effort to work toward the EU legislation on Internet access (31). The last few years the increase of access has mainly been due to mobile phones and tablets.
If there is less Internet use in rural areas, this can in turn have implications for the provision of care or support for older-adults. Studies have shown that many who live in rural areas have different constellations than their urban counterparts in how they are taken care of, relying both on neighbour and family structures more than community services (32,33). A previous study has shown that older women that live in rural areas require more support, where in some communities they are struggling to stay living independently and sustain their well-being (34). There seem to be differences in social support, where urban older-adults tend to feel more depressed due to anonymity in cities, suggesting they are more lonely; contrary to rural older-adults who have stronger social connections that they can trust and depend on (35).
Irrespective of whether older-adults live rural or urban, research has shown that older-adults living with someone have better physical and mental health than older adults living alone (36). Few studies have however, looked at how older-adults that live with someone influences Internet usage per se. Some recent studies demonstrated that older-adults 2 3 4 5 6 7 8 9 10 11 12 13 14 15 16 17 18 19 20 21 22 23 24 25 26 27 28 29 30 31 32 33 34 35 36 37 38 39 40 41 42 43 44 45 46 47 48 49 50 51 52 53 54 55 56 57 58 59
For Peer Review
were more likely to go online and join social networking websites, if they are shown how to, see the perceived usefulness and receive help in the use and process (37,38). Such support could be facilitated if the older adult lived with someone.
Many factors influence older-adults’ Internet use. What this study wanted to shed light on was how these factors varied (if at all) with Internet use and living rural or urban. Thus, the aim of this study was to explore individual responses to whether older adults were using the Internet or not and why across rural and urban Sweden between the years 2001 - 2004. Data on the spread of the Internet access across Sweden is not available before 2006 for this older-adult population. Therefore the access was not noted.
Two research questions were investigated:
- How is Internet usage distributed in rural and urban areas respectively throughout Sweden? - Which factors influence Internet use in these areas, controlling for the variables age, gender, education, living alone or with someone, cognition, household economy and rural or urban life-style?
METHOD
This study has a cross-sectional sample which was taken from the longitudinal Swedish national study on aging and care (SNAC). SNAC is a study conducted since 2001, in which central and local governments cooperate. The total sample consists of sub-samples from four regions in Sweden: Skåne, Kungholmen, Nordanstig and Blekinge. The sample is considered representative of the Swedish older-adult. Different questionnaires and interviews are used to investigate the mental and physical health, distribution of age, gender, perceived quality of life, social and well-being statuses. In effect the study aims to extend the knowledge of what the medical and functional statuses of older-adults are, as well as their needs for social and medical services and identify potential areas of lack of care. The full outline of SNAC can be found in Lagergren et al.(39).
2 3 4 5 6 7 8 9 10 11 12 13 14 15 16 17 18 19 20 21 22 23 24 25 26 27 28 29 30 31 32 33 34 35 36 37 38 39 40 41 42 43 44 45 46 47 48 49 50 51 52 53 54 55 56 57 58
For Peer Review
The population in the current study consists of a total 7181 people in total, from the ages of 59 through to 100. The mean age in the sample is 73 years old, with a mode of 66 and a median of 72 years of age. All information used is from the baseline data (2001-2004), from all four participating regions. The regions had high and equal participation rates, where in the baseline data there is a nonresponse rate of 33.6%. Those that do not respond tend to be women, oldest-older adults and the frail elderly.
The participants were randomly selected and invited by mail, with one reminder sent. Both written and verbal consent were obtained for all participants. Trained health professionals would thereafter conduct the medical examinations and interviews and also help the older-adults to fill in questionnaires when needed. Where there were cases of
non-participation, the reason was registered.
Ethics
The research carried out in SNAC complies with the Helsinki declaration; ethical permissions were obtained from the ethical committees of the Karolinska institute (KI dnr 01-114) and University of Lund (LU dnr 650-00 and LU 744-00).
The definition of urban and rural population
In Sweden the population consists of close to 9.5 million people, of which the older adult population (65 years old and more) consists of 1.6 million people (18,40).
Sweden does not have a proper definition of what a city is, in physical aspects and in population size; therefore some choose at times to define regions and make delimitations by closeness to, or easy access to a place (40). The municipalities in this study were categorised according to the Swedish regions by the Bureau of Statistics Sweden (41):
Big city urban: the city of Malmö and Stockholm
Midsize urban: Karlskrona, Eslöv, Ystad and Hässleholm Rural: Osby and Nordanstig
2 3 4 5 6 7 8 9 10 11 12 13 14 15 16 17 18 19 20 21 22 23 24 25 26 27 28 29 30 31 32 33 34 35 36 37 38 39 40 41 42 43 44 45 46 47 48 49 50 51 52 53 54 55 56 57 58 59
For Peer Review
The data in this study consists of older-adults living throughout many regions in Sweden. Two delimitations were chosen to analyse rural and urban living. Firstly, the aforementioned division was used. Secondly, in order to have a better grasp of the location of the population sample, the authors decided to use a Swedish living conditions’ delimitation of rural or urban (42). This is often used in a Swedish context, where if a person has either more than 2 km distance to a nearby healthcare centre, then they are considered to be living rurally. Otherwise (if they have less than 2 km) they are considered to be living in a closer agglomeration and in a city.
Variables and instruments
Internet use was a question given at baseline (2001) with a yes/no answer possible.
Age was categorised into four groups: group 1: 59- 74; group 2: 75-84; group 3: 85- 90; group 4: 91-100.
Education was categorised in three groups according to the previous Swedish education system, relevant for the age groups in this study: level 1, those who did not finish secondary school; level 2, those who finished secondary school; level 3, those with some form of higher education. Yet for the logistic regressions the variable was dichotomised, in order to have those higher educated (level 3) and those who were not (level 1 & 2).
Living alone or not: was categorised as either the older adult was living alone or with someone (next of kin, partner); where 1= living alone, 2= living with someone. Cognition was measured using the Swedish translation of the “Mini-Mental State” test (MMT), where maximum score of 30 means are that one has normal cognitive functioning. Many studies use cut-off point between 24 and 26, signifying under that score there is “presence of cognitive difficulty”(43) p. 192.. In this study each individual result was categorised at the mean (score 27), where 1= above mean; 2= below mean.
Household economy was measured based on a Swedish survey on income and living conditions (44). The question asks whether one can raise within one week a sum of 14,000 SEK (1,533 euro) in 2001-2004 (baseline data).
2 3 4 5 6 7 8 9 10 11 12 13 14 15 16 17 18 19 20 21 22 23 24 25 26 27 28 29 30 31 32 33 34 35 36 37 38 39 40 41 42 43 44 45 46 47 48 49 50 51 52 53 54 55 56 57 58
For Peer Review
STATISTICAL PROCEDURES
The SPSS Statistics package 20, was used to conduct the analyses below.
A descriptive cross-tabulation analysis was done to investigate the dispersion of the rural and urban divide of 2 km, with the following variables: Internet use, age, gender, education, living alone or with someone, cognition and household economy (Table 1).
Internet usage was compared throughout Sweden, using the division big city (Malmö and Stockholm), midsize urban (Karlskrona, Eslöv Ystad and Hässleholm), and rural Sweden (Osby & Nordanstig). A logistic regression was conducted, as Internet use is a dichotomous variable and was used as with Internet use as a dependent variable; the two dummy variables were created for big city and midsize city which can be found in Table 2.
A second logistic regression (backward) was used to investigate whether Internet use was influenced by the variables: gender, education, living alone/with someone, cognition, household economy, age and living rural/urban (Table 3).
A new variable with Internet usage and urban or rural life-style was created. A third and fourth backward logistic regression were conducted to investigate rural Internet use and urban Internet use, as dependent variables with the six independent variables: gender, education, living alone/with someone, cognition, household economy and age (Tables 4 & 5).
The variance inflation factor (VIF) and tolerance statistics were calculated for each variable in each regression. The VIF indicates whether a predictor has a strong linear relationship with other predictors, where a VIF higher than 10 and a tolerance (1/VIF) lower than 0.10, indicate multicollinearity may be biasing the model (45). This was calculated by running a linear regression analysis with the outcome (DV) and predictors (IV) from the logistic regression. The collinearity of the data was obtained with a VIF and tolerance statistic for each variable. A VIF higher than 10 and a tolerance (1/VIF) lower than 0.10, indicate multicollinearity may be biasing the model (45). A concordance (c-) statistic was used to measure how well the model discriminated between observations at different levels of the outcome. The range is from 0.5 (no discrimination) to 1.0 (outstanding discrimination). C-statistic values of 0.7 to 0.8 are considered to show acceptable discrimination, values of 0.8 to 0.9 to indicate very good discrimination, and values of ≥0.9 show outstanding discrimination 2 3 4 5 6 7 8 9 10 11 12 13 14 15 16 17 18 19 20 21 22 23 24 25 26 27 28 29 30 31 32 33 34 35 36 37 38 39 40 41 42 43 44 45 46 47 48 49 50 51 52 53 54 55 56 57 58 59
For Peer Review
(46). Previous research has indicated that using the C-statistic strengthens the results of the logistic regression in cases where there is strong heterogeneity in the population. The odds ratio alone is then not enough, especially when having continuous explanatory variables (47).
Results
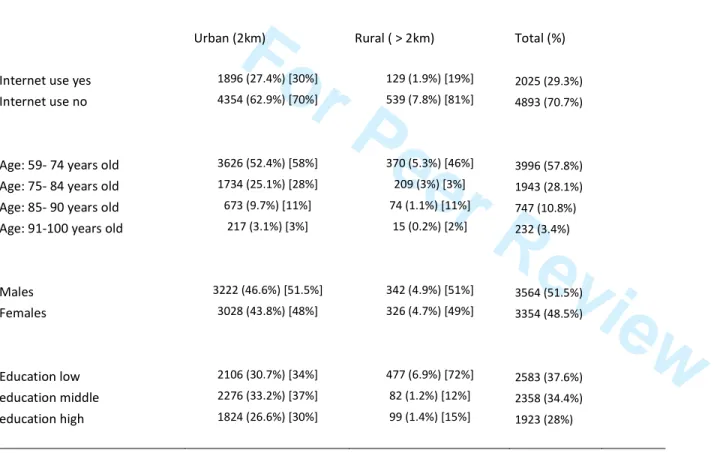
Table 1 indicates that there are more older-adults living in an urban setting and more younger-older adults in this sample. There are almost as many males and females in this sample. More older-adults that are highly educated live in an urban setting, yet they have a slightly worse household economy than those living rurally. In this sample there are more people with normal cognitive functioning than not, in both urban and rural settings.
In the first logistic regression model it was demonstrated that there are more people using the Internet in the big city/urban Sweden compared to midsize and rural. There were significantly more older-adults using the Internet in more densely populated regions, compared to those living rurally (OR= 2.500; p < 0.001). A VIF and tolerance statistic was calculated afterwards, showing that there is no multicollinearity. The model however is not so strong with a low C-statistic of 0.61 indicating that the influence on Internet usage does not just come from location big city, midsize or rural.
The second model demonstrated that when including all variables into one equation with Internet usage, the household economy variable fell out as non-significant. All other variables significantly increased Internet usage: being male (OR= 1.143; p < 0.05), more highly
educated (OR= 1.762; p < 0.001), living with someone (OR= 1.784; p < 0.001), normal cognitive functioning (OR = 1.222; p < 0.001), lower in age (OR = 1.118; p < 0.001) and living in an urban environment living within 2 km to a healthcare centre/shop (OR = 1.576; p < 0.001). The model here is good, with has a C-statistic of 0.834 showing strong discrimination. The VIF is around 1 and the Tolerance is above 0.10 for each variable.
The third logistic regression analysis conducted, had the dependent variable rural Internet use. This was based on the rural variable created (living more than 2 km to a healthcare centre /shop), and those that were using the Internet contrary to those that were not. All six
independent variables were investigated. The final model showed that higher education (OR= 1.368; p < 0.05) and lower age (OR=1.108; p < 0.001) were factors which made rural older-2 3 4 5 6 7 8 9 10 11 12 13 14 15 16 17 18 19 20 21 22 23 24 25 26 27 28 29 30 31 32 33 34 35 36 37 38 39 40 41 42 43 44 45 46 47 48 49 50 51 52 53 54 55 56 57 58
For Peer Review
adults use the Internet. The model itself is reasonable, with a c-statistic was that is 0.786 indicating acceptable discrimination, and there was no multicollinearity between variables as seen with the VIF close to 1 and the Tolerance above 0.10.
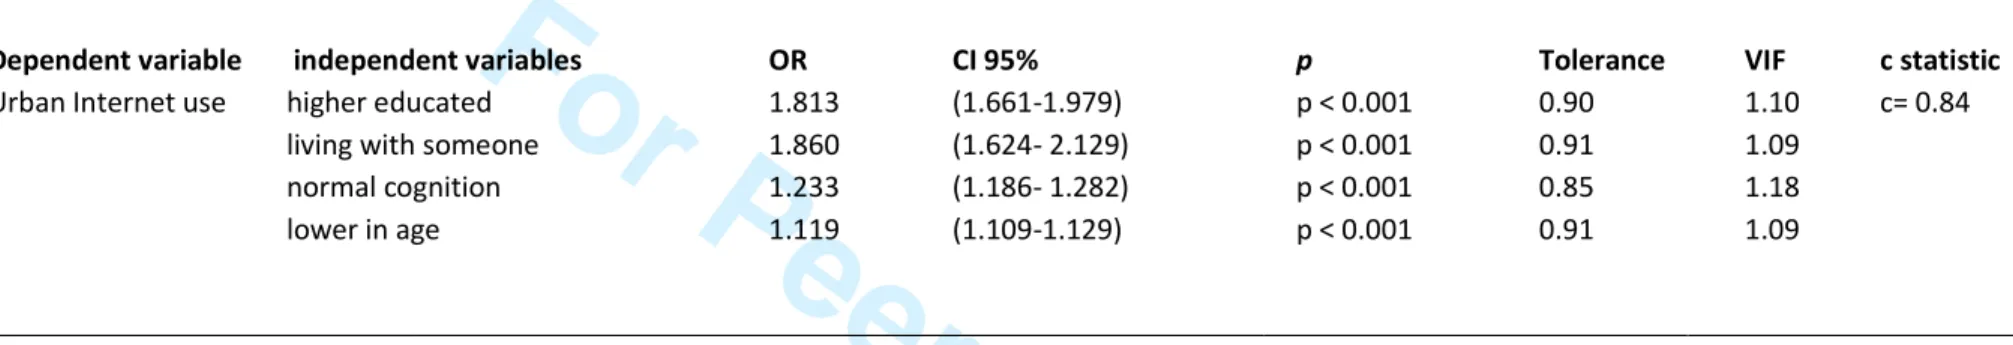
The fourth logistic regression analysis had as a dependent variable urban Internet use. This was based on the urban variable created (living within 2 km to a shop/ healthcare centre). Similarly all six independent variables were investigated with urban Internet use. The final model showed that more highly educated (OR= 1.813; p <0.001), living with someone (OR=1.860; p < 0.001), normal cognition (OR= 1.233; p < 0.001) and lower age (OR= 1.119; p < 0.001), were significant for the final logistic equation. Higher education and living with someone are almost twice as strong predictors of Internet use among older-adults in an urban environment. In addition, the model itself is good, with a c-statistic was above 0.8, indicating strong discrimination between observations in this last model.
Discussion
The main results of this study are that older-adults living in urban areas are more frequent Internet users. However, urban living was not enough to explain Internet use of these older-adults. Factors that were related to Internet use in general were, being male, high education, living with someone, normal cognitive functioning, the younger age groups, and urban living. When looking specifically at rural localities: older-adults used the Internet if they were more highly educated and if they were younger. Urban older-adults used the Internet if they were more highly educated, living with someone, had normal cognitive functions and were lower in age.
When comparing regions in Sweden, big cities showed greater likelihood of Internet use among older-adults than their rural counterparts. This is a finding which is supported by other research (8,17). Even in the second model, when investigating Internet use in general, urban living meant that older-adults were more likely to use the Internet (OR= 1.576; p < 0.001). Urban living may entail being surrounded by adverts and bustle, which could make the Internet more attractive. Another reason could be that cities may have quicker bandwidth access compared to their rural counterparts.
2 3 4 5 6 7 8 9 10 11 12 13 14 15 16 17 18 19 20 21 22 23 24 25 26 27 28 29 30 31 32 33 34 35 36 37 38 39 40 41 42 43 44 45 46 47 48 49 50 51 52 53 54 55 56 57 58 59
For Peer Review
Internet use by the older-adult was significantly more prominent for males and more highly educated. Whether more education suggests the type of job before retirement, which allowed the older-adult to use a computer, or whether it suggests curiosity to pick up new skills, is not answered in this study. Learning, however, was linked with higher education in previous studies, where older-adults with higher education more easily pick up and try the Internet (48).
Living alone or with someone, stood out in the older-adult Internet user as being an influential factor. Those that were not using the Internet were more likely to live alone. There is probably a strong link when living together with someone that makes it easier to use the Internet. Seeing, being exposed to the Internet and having the possibility to ask someone if it goes wrong, are all very probably contributory factors. Other studies have indicated that living alone was linked with a lower income, therefore less Internet use (49). Interestingly in this study, there were almost equally as many people living with someone or alone in an urban setting. In contrast to this, there were almost twice as many older-adults living together rather than alone.
The younger-older adults (65-80 years of age) are using the Internet more frequently than in the older age groups. This study shows that age strongly influences Internet use, as age was entered as a continuous variable in the logistic regressions. This means that for every aging year, there is less Internet usage; just one year can make a very big difference. It could be that with increasing age people are not socially exposed in the same way as each year passes. A study by Cresci, Yarandi & Morrell (10), found that those who were much older did not see the need to use the Internet. There could be a loss of interest as the years pass. There may also be more physical hindrances. Chronic illnesses become more common, especially as the person passes 80 years of age, in addition to a decline in vision and motor coordination skills which are most likely to change. Studies have shown that cognitive impairment caused people to use technology less (8). This study showed that it was also a factor in Internet use among older-adults.
Household economy is not influencing Internet usage in this study. This is contrary to other studies (18). Some investigated “late-adopters” of Internet and broadband, where social networks, the perceived utility, knowing how to use the Internet and how safe it is, but also the price of a subscription, were influential whether “late-adopters” like older-adults would 2 3 4 5 6 7 8 9 10 11 12 13 14 15 16 17 18 19 20 21 22 23 24 25 26 27 28 29 30 31 32 33 34 35 36 37 38 39 40 41 42 43 44 45 46 47 48 49 50 51 52 53 54 55 56 57 58
For Peer Review
want to use the Internet or not (50). In this study’s sample, the purchasing power is less of an influence with the other selected variables.
When further exploring the differences between urban and rural Internet users, a clear
distinction could be found between the two. Both rural and urban older-adults were influenced by age and higher education if using the Internet. Specifically to urban older-adults, living with someone and normal cognitive functioning were factors influencing their Internet use. The setting where the older adult lives therefore affects the use of the Internet. This may be important within a health care setting; if the persons in this cohort do not use the Internet they will also not receive health solutions on the Internet, which are promising better accessibility, information and efficiency to health care (51).
Equal care should be provided irrespective of geographical location. Discrepancies have previously been demonstrated between urban and rural living, especially in predictors of health outcomes for older-adults. Access to health information in rural areas can easily be reached via the Internet, possibly reducing health inequalities in the long run (52). However, according to the results in this study those who will not benefit are those who are older, of less education and specifically urban older-adults who live alone and do not have normal cognitive functioning.
If the older adult will not start to use the Internet via a computer, there will be a lack of interaction with internet-based healthcare services, which will need to be replaced by other ways of communication. For example, by trying other technological devices, such as tablets which may be easier to use than computers, or catering specifically to older-adults by
providing case managers who can function as a link between health care centres and the older adult. As claimed by other studies (53), the innovative step is to understand the social roles that are in place today. Older-adults have a new and different social role in that they are living longer, engaged longer and are present in society. Older-adults who live without the Internet may not want to engage and start using it, which is something further studies should
investigate by interview studies. Those not adapting, for different reasons, may feel that they are overwhelmed by the information society. It could be that, older-adults are pushed (forced to use the Internet, an external push) into using the Internet contrary to being pulled (enticed to use the Internet, user-driven) into using it (54). It may also be important to take into consideration the impact of the changing constellations of face-to-face contact (online shopping, bank errands, and healthcare services). A reduction of face-to-face social contact 2 3 4 5 6 7 8 9 10 11 12 13 14 15 16 17 18 19 20 21 22 23 24 25 26 27 28 29 30 31 32 33 34 35 36 37 38 39 40 41 42 43 44 45 46 47 48 49 50 51 52 53 54 55 56 57 58 59
For Peer Review
may be felt more with older people, which may be a cause for depression (55), and ostracism. This, in turn, can also lead to not wanting to start to use the Internet.
Strengths and Limitations of the Study
Three strengths in this study can be found. First, the study has a large sample of over 7000 people, allowing for generalisations to be made. A second strength is that big city, midsize and rural Sweden is covered in the analyses, giving an overview of older adults’ Internet use in Sweden. Moreover, the chosen delimitation of rural and urban is a workable definition which could leave the research easily transferable. Other definitions of rural and urban may be more country specific. Therefore, a more than or less than 2 km distance to a health care centre puts rural and urban into a concrete context.
Some limitation of this study are that many factors could be influencing Internet use, which were not investigate here, like health for example; it may be a strong factor in the rural and urban divide and influence Internet use. The response rate in the study is of 33.6% which means many are not represented, namely: the frail older-adults, some women and the oldest-old. Furthermore, the data is cross-sectional, so causality cannot be expressed.
Conclusion
There are differences in the Swedish older-adults who live in an urban or rural setting and their Internet use. This study confirmed results from other research that Internet use by the older adult varies across age, gender, levels of education, living situations, normal cognitive functioning, and an urban or rural life-style. Specific to this study are the findings that age is a very strong factor influencing Internet use, changing from one year to the next; and that the older-adults that live in an urban environment, together with someone and who have normal cognitive functioning are more likely to use the Internet.
2 3 4 5 6 7 8 9 10 11 12 13 14 15 16 17 18 19 20 21 22 23 24 25 26 27 28 29 30 31 32 33 34 35 36 37 38 39 40 41 42 43 44 45 46 47 48 49 50 51 52 53 54 55 56 57 58
For Peer Review
Funding
The SNAC (www.snac.org) is supported financially by the Swedish Ministry of Health and Social Affairs and by the county councils, municipalities and university departments that are participating.
Acknowledgements
We are grateful to the participants, the counties and municipalities that participated. 2 3 4 5 6 7 8 9 10 11 12 13 14 15 16 17 18 19 20 21 22 23 24 25 26 27 28 29 30 31 32 33 34 35 36 37 38 39 40 41 42 43 44 45 46 47 48 49 50 51 52 53 54 55 56 57 58 59
For Peer Review
References1. Deller S. Globalization and the Rural-Urban Divide. Am J Agric Econ. 2011 Apr 1;93(3):912–4.
2. Sheldon I. Globalization and the Rural-Urban Divide. J Agric Econ. 2012;63(2):487–9.
3. Hampton KN. Internet Use and the Concentration of Disadvantage: Glocalization and the Urban Underclass. Am Behav Sci. 2010 Apr 1;53(8):1111–32.
4. Giles D. Media Psychology. Hillsdale: NJ & London: Lawrence Erlbaum Associates; 2003.
5. Castells M. The information age : economy, society and culture. Vol. 1, The rise of the network society / Manuel Castells. Malden, Mass.: Blackwell; 1996.
6. Boase J. The Consequences of Personal Networks for Internet Use in Rural Areas. Am Behav Sci. 2010 May 1;53(9):1257–67.
7. Hale TM, Cotten SR, Drentea P, Goldner M. Rural-Urban Differences in General and Health-Related Internet Use. Am Behav Sci. 2010 May 1;53(9):1304–25.
8. Calvert J, Kaye J, Leahy M, Hexem K, Carlson N. Technology use by rural and urban oldest old. Technol Health Care. 2009;17:1–11.
9. Marcellini F, Giuli C, Gagliardi C, Papa R. Aging in Italy: Urban–rural differences. Arch Gerontol Geriatr. 2007 May;44(3):243–60.
10. Cresci M, Yarandi H, Morrell R. Pro-nets versus no-nets: differences in urban older adults’ predilections for internet use. Educ Gerontol. 2010;36:500–10.
11. Hofflander M, Nilsson L, Eriksén S, Borg C. Discharge planning: narrated by nursing staff in primary healthcare and their concerns about using video conferencing in the planning session - an interview study. J Nurs Eduction Pr. 2013;3(1):88–98.
12. Meinow B, Kårenholt I, Lagergren M. According to need? Predicting the amount of municipal home help allocated to elderly recipients in an urban area of Sweden. Health Soc Care Community. 2005;13(4):366–77.
13. Cheek P, Nikpour L, Nowlin H. Aging well with smart technology. Nurse Admin Q. 2005;29(4):329–38.
14. Kang HG, Mahoney DF, Hoenig H, Hirth VA, Bonato P, Hajjar I, et al. In Situ Monitoring of Health in Older Adults: Technologies and Issues. J Am Geriatr Soc. 2010;58(8):1579–86.
15. Ruppe G. Active ageing and prevention in the context of long-term care. Austria: European Centre; 2011 Jul.
16. Berner J, Rennemark M, Jogréus C, Berglund J. Factors associated with change in Internet use by Swedish older adults (2001-2004). Health Informatics J. 2012;in press.
17. Cresci M, Yarandi H, Morrell R. The digital divide and urban older adults. Comput Informatics Nurs. 2010;28(2):88–94. 2 3 4 5 6 7 8 9 10 11 12 13 14 15 16 17 18 19 20 21 22 23 24 25 26 27 28 29 30 31 32 33 34 35 36 37 38 39 40 41 42 43 44 45 46 47 48 49 50 51 52 53 54 55 56 57 58
For Peer Review
18. Findahl O. Äldre svenskar och internet 2010, (The Swedish older adults and internet). Stockholm: Danagårds Grafiska; 2011.
19. Saunders E. Maximizing computer use among the elderly in rural senior centers. Educ Gerontol. 2004;30:573–85.
20. Europe’s Digital Competitive report 2010 [Internet]. Luxembourg: The European Union; 2010 p. 202. Available from:
http://ec.europa.eu/information_society/digital-agenda/documents/edcr.pdf
21. Czaja SJ, Lee CC, Nair SN, Sharit J. Older Adults and Technology Adoption. Proc Hum Factors Ergon Soc Annu Meet. 2008 Sep 1;52(2):139–43.
22. Berner J, Rennemark M, Jogréus C, Berglund J. Distribution of personality, individual
characteristics and internet usage in the Swedish older adult. Aging Ment Health. 2012;16:119– 26.
23. Ellis RD, Allaire JC. Modeling Computer Interest in Older Adults: The Role of Age, Education, Computer Knowledge, and Computer Anxiety. Hum Factors J Hum Factors Ergon Soc. 1999 Sep 1;41(3):345–55.
24. Morrell RW, Mayhorn CB, Bennett J. A Survey of World Wide Web Use in Middle-Aged and Older Adults. Hum Factors J Hum Factors Ergon Soc. 2000;42(2):175–82.
25. Hawthorn D. Possible implications of aging for interface designers. Interact Comput. 2000;12(5):507–28.
26. Beckers S. A study of web usability for older adults seeking online health resources. Trans Comput-Hum Interact. 2004;11(4):387– 406.
27. Hanson VL. Influencing technology adoption by older adults. Interact Comput. 2010 Nov;22(6):502–9.
28. Czaja SJ, Charness N, Fisk AD, Hertzog C, Nair SN, Rogers WA, et al. Factors predicting the use of technology: Findings from the center for research and education on aging and technology enhancement (create). Psychol Aging. 2006 Jun;21(2):333–52.
29. Swedes – the swiftest surfers in the Nordic countries [Internet]. [cited 2013 May 2]. Available from: http://www.pts.se/en-GB/News/Press-releases/2010/Swedes--the-swiftest-surfers-in-the-Nordic-countries/
30. Findahl O. Swedes and the Internet 2012 [Internet]. Stockholm: .SE; 2012 p. 1–70. Report No.: ISBN: 978-91-979411-7-4. Available from: www.internetstatistik.se
31. Everyone should be able to use vital public services on the Internet [Internet]. [cited 2013 May 2]. Available from: http://www.pts.se/en-GB/News/Press-releases/2009/Everyone-should-be-able-to-use-vital-public-services-on-the-Internet-/
32. Jett K. Nursing and aging in rural and frontier settings. Heal Aging. Missouri: Mosby: Elsevier; 2008. p. 532 – 547.
33. Zulkowski K, Coon P. Comparison of nutritional risk between urban and rural elderly. Ostomy Wound Manag. 2008;approximately 2.
2 3 4 5 6 7 8 9 10 11 12 13 14 15 16 17 18 19 20 21 22 23 24 25 26 27 28 29 30 31 32 33 34 35 36 37 38 39 40 41 42 43 44 45 46 47 48 49 50 51 52 53 54 55 56 57 58 59
For Peer Review
34. Arbuthnot E, Dawson J, Hansen-Ketchum P. Senior Women and Rural Living. Online J Rural Nurs Heal Care. 2012 Nov 4;7(1):35–46.
35. Evans J. A comparison of rural and urban older adults in Iowa on specific markers of successful aging. J Gerontol Soc Work. 2009;52(4):423– 438.
36. You KS, Lee H. The Physical, Mental, and Emotional Health of Older People Who Are Living Alone or With Relatives. Arch Psychiatr Nurs. 2006 Aug;20(4):193–201.
37. Braun MT. Obstacles to social networking website use among older adults. Comput Hum Behav. 2013 May;29(3):673–80.
38. Gatto SL, Tak SH. Computer, Internet, and E-mail Use Among Older Adults: Benefits and Barriers. Educ Gerontol. 2008;34(9):800–11.
39. Lagergren M, Fratiglioni L, Hallberg I, Berglund J, Elmståhl S, Hagberg B, et al. A longitudinal study integrating population, care and social services data. The Swedish National study on Aging and Care (SNAC). Aging Clin Exp Res. 2004;16(2):158–68.
40. Städer och stadsstruktur. En förstudie om hur städers betydelse för tillväxt kan beskrivas och analyseras [Internet]. Sweden: Myndigheten för tillväxtpolitiska utvärderingar och analyser; 2010. Report No.: Dnr 2010/014. Available from: www.tillvaxtanalys.se
41. Statistics Sweden. Demographic reports, Immigrant’s Migration patterns [Internet]. SCB; 2008. Available from:
http://www.scb.se/Pages/PublishingCalendarViewInfo____259923.aspx?PublObjId=9033
42. Undersökning av levnadsförhållanden 2007. [Investigation of living standards 2007] [Internet]. Stat. Cent. Swed. Stat. 2007. Available from:
http://www.scb.se/Pages/ProductDocumentations____19231.aspx
43. Folstein M, Folstein S, McHugh P. “Mini-mental state” A practical method for grading the cognitive state of patients for the clinican. J Psychiatry. 1975;12:189– 198.
44. Undersökning av levnadsförhållanden 2004-2005. [Investigation of living standards 2004-2005] [Internet]. Stat. Cent. Swed. Stat. 2005. Available from:
http://www.scb.se/Pages/ProductDocumentations____19231.aspx
45. Field A. Discovering Statistics Using SPSS. second. London: Sage Publications; 2005.
46. Hosmer DW, Lemeshow S, Sturvivant RX. Applied logistic regression. Wiley-Blackwell; 2013.
47. Austin PC, Steyerberg EW. Interpreting the concordance statistic of a logistic regression model: relation to the variance and odds ratio of a continuous explanatory variable. BMC Med Res Methodol. 2012 Jun 20;12(1):82.
48. Kiel JM. The digital divide: Internet and e-mail use by the elderly. Med Inform Internet Med. 2005;30(1):19–23.
49. Lustria MLA, Smith SA, Hinnant CC. Exploring digital divides: An examination of eHealth technology use in health information seeking, communication and personal health information management in the USA. Health Informatics J. 2011 Sep 1;17(3):224–43.
2 3 4 5 6 7 8 9 10 11 12 13 14 15 16 17 18 19 20 21 22 23 24 25 26 27 28 29 30 31 32 33 34 35 36 37 38 39 40 41 42 43 44 45 46 47 48 49 50 51 52 53 54 55 56 57 58
For Peer Review
50. Dwivedi Y, Irani Z. Understanding the adopters and non-adopters of broadband. Commun ACM. 2009 Jan;52(1):122–5.
51. Jung M-L, Loria K. Acceptance of Swedish e-health services. J Multidiscip Healthc. 2010;3:55– 63.
52. Zimmer Z, Wen M, Kaneda T. A multi-level analysis of urban/rural and socioeconomic differences in functional health status transition among older Chinese. Soc Sci Med. 2010;71:559–67.
53. Biggs S, Carstensen L, Hogan P. Social Capital, lifelong learning and social innovation. 2012 p. 39–41.
54. Mante-Meijer E, Loos E. Innovation and the role of push and pull. New Media Technol User Empower. Frankfurt am Main: Peter Lang; 2011. p. 27–43.
55. Cotten SR, Ford G, Ford S, Hale TM. Internet use and depression among older adults. Comput Hum Behav. 2012 Mar;28(2):496–9.
2 3 4 5 6 7 8 9 10 11 12 13 14 15 16 17 18 19 20 21 22 23 24 25 26 27 28 29 30 31 32 33 34 35 36 37 38 39 40 41 42 43 44 45 46 47 48 49 50 51 52 53 54 55 56 57 58 59
For Peer Review
Table 1: Cross tabulation with dependent variable living rural or urban, with the variables internet use, age, gender, education, living alone or with someone, cognition and household economy. N number of people; (%) is indicated as the percentage of the population sample; [%] indicates the percentage of the rural/urban population.
Urban (2km) Rural ( > 2km) Total (%)
Internet use yes 1896 (27.4%) [30%] 129 (1.9%) [19%] 2025 (29.3%)
Internet use no 4354 (62.9%) [70%] 539 (7.8%) [81%] 4893 (70.7%)
Age: 59- 74 years old 3626 (52.4%) [58%] 370 (5.3%) [46%] 3996 (57.8%)
Age: 75- 84 years old 1734 (25.1%) [28%] 209 (3%) [3%] 1943 (28.1%)
Age: 85- 90 years old 673 (9.7%) [11%] 74 (1.1%) [11%] 747 (10.8%)
Age: 91-100 years old 217 (3.1%) [3%] 15 (0.2%) [2%] 232 (3.4%)
Males 3222 (46.6%) [51.5%] 342 (4.9%) [51%] 3564 (51.5%) Females 3028 (43.8%) [48%] 326 (4.7%) [49%] 3354 (48.5%) Education low 2106 (30.7%) [34%] 477 (6.9%) [72%] 2583 (37.6%) education middle 2276 (33.2%) [37%] 82 (1.2%) [12%] 2358 (34.4%) education high 1824 (26.6%) [30%] 99 (1.4%) [15%] 1923 (28%)
Urban: having less than 2 km to a healthcare centre; rural: having more than 2 km to a healthcare centre
Education low: did not finish secondary school; education middle: finished secondary school; education high: some form of higher education http://mc.manuscriptcentral.com/HIJ 2 3 4 5 6 7 8 9 10 11 12 13 14 15 16 17 18 19 20 21 22 23 24 25 26 27 28 29 30 31 32 33 34 35 36 37 38 39 40 41 42 43 44 45 46 47 48 49 50 51 52 53 54 55 56
For Peer Review
Continuation Table 1: Cross tabulation with dependent variable living rural or urban, with the variables internet use, age, gender, education, living alone or with someone, cognition and household economy. N number of people; (%) is indicated as the percentage of the population sample; [%] indicates the percentage of rural/urban population.
Urban (2km) Rural ( > 2km) Total (%)
Living alone 2913 (42.3 %) [47%] 230 (3.3%) [35%] 3143 (45.6%)
Living with someone 3323 (48.2%) [53%] 428 (6.2%) [65%] 3751 (54.4%)
cognitive functioning normal 4083 (60.3%) [67%] 426 (6.3%) [66%] 4509 (66.6%)
cognitive functioning poor 2041 (30.1%) [33%] 220 (3.2%) [34%] 2261 (33.4%)
Household economy good 3089 (44.7%) [49%] 413 (6%) [62%] 3502 (50.6%)
Household economy poor 3161 (45.7%) [50%] 255 (3.7%) [38%] 3416 (49.4%)
Cognition normal: 27≤ score≤ 30; cognition poor: score > 27
Household economy good: can obtain 14,000 SEK in one week (1,533 euro); household economy poor: cannot obtain 14,000 SEK in one week
http://mc.manuscriptcentral.com/HIJ 2 3 4 5 6 7 8 9 10 11 12 13 14 15 16 17 18 19 20 21 22 23 24 25 26 27 28 29 30 31 32 33 34 35 36 37 38 39 40 41 42 43 44 45 46 47 48 49 50 51 52 53 54 55 56 57
For Peer Review
Table 2: Backward logistic regression of Internet use of older-adults throughout Sweden
The big cities (Malmö & Stockholm) were compared with mid-size cities (Karlskrona, Eslöv, Ystad) and rural Sweden (Osby & Nordanstig). N= 7181 (included in analysis)
Model 1
DV IV OR CI 95% P value Tolerance VIF c statistic
Internet use Big city 2.500 (2.029-3.081) 0.001 0.33 3.03 c=0.61
Midsize city 1.083 (0.861-1-362) NS
Rural 1.00 -
Model 2
DV IV OR CI 95 % P value c statistic
Internet use Big city 2.656 (2.366-2.982) 0.001 c=0.61
DV: Dependent variable. IV: Independent variable. OR: odds ratios; CI: Confidence intervals at 95%; P value NS: not significant;
Tolerance and VIF statistic: variance inflation factor for multicollinearity; The c statistic: Concordance statistic ranging from 0.5 (no discrimination) to 1 (outstanding discrimination)
http://mc.manuscriptcentral.com/HIJ 2 3 4 5 6 7 8 9 10 11 12 13 14 15 16 17 18 19 20 21 22 23 24 25 26 27 28 29 30 31 32 33 34 35 36 37 38 39 40 41 42 43 44 45 46 47 48 49 50 51 52 53 54 55 56
For Peer Review
Table 3: Backward Logistic regression with Internet use as a dependent variable and six independent variables:
gender, education, living with someone/alone, normal cognitive functioning, household economy, age and living urban/rural N= 6707 (included in analysis)
Dependent variable independent variables OR CI 95% p Tolerance VIF c statistic
Internet use being male 1.143 (1.010- 1.295) p < 0.05 0.996 1.00 0.834
more highly educated 1.762 (1.623- 1.914) p < 0.001 0.88 1.14
living with someone 1.784 (1.565- 2.033) p < 0.001 0.91 1.10
good/normal cognition 1.222 (1.177-1.268) p < 0.001 0.84 1.19
lower in age 1.118 (1.108- 1.127) p < 0.001 0.78 1.28
living urban 1.576 (1.242- 2.001) p < 0.001 0.96 1.04
More highly educated: at least a college or university degree; Living with someone: next of kin/partner/friend; Normal cognitive functioning between mean 27 ≤ score ≤ 30 (top score); Lower in age: continuous variable (59 -100 years old); Living urban: within 2 km of a healthcare centre or shop. OR: odds ratios; CI: Confidence intervals at 95%;
P value NS: not significant; Tolerance and VIF statistic: variance inflation factor for multicollinearity; The c statistic: Concordance statistic ranging from 0.5 (no discrimination) to 1
(outstanding discrimination). http://mc.manuscriptcentral.com/HIJ 2 3 4 5 6 7 8 9 10 11 12 13 14 15 16 17 18 19 20 21 22 23 24 25 26 27 28 29 30 31 32 33 34 35 36 37 38 39 40 41 42 43 44 45 46 47 48 49 50 51 52 53 54 55 56 57
For Peer Review
Table 4: Backward logistic regression.
Rural Internet usage as dependent variable and gender, education, living with someone/alone, normal cognitive functioning, household economy, and age as independent variables. N = 628 (included in analysis)
Dependent variable independent variables OR CI 95% p Tolerance VIF
c statistic
Rural Internet use Higher educated 1.368 (1.052- 1.780) p < 0.05 0.95 1.06 0.786
Lower in age 1.108 (1.075- 1.142) p < 0.001 0.95 1.06
More highly educated: at least a college or university degree; Lower in age: continuous variable (59 -100 years old).
OR: odds ratios; CI: Confidence intervals at 95%; P value NS: not significant; Tolerance and VIF statistic: variance inflation factor for multicollinearity; The c statistic:
Concordance statistic ranging from 0.5 (no discrimination) to 1 (outstanding discrimination).
http://mc.manuscriptcentral.com/HIJ 2 3 4 5 6 7 8 9 10 11 12 13 14 15 16 17 18 19 20 21 22 23 24 25 26 27 28 29 30 31 32 33 34 35 36 37 38 39 40 41 42 43 44 45 46 47 48 49 50 51 52 53 54 55 56
For Peer Review
Table 5: Backward logistic regression
Urban Internet usage as dependent variable and gender, education, living with someone/alone, normal cognitive functioning, household economy and age as independent variables. N= 6069 (included in the analysis)
Dependent variable independent variables OR CI 95% p Tolerance VIF c statistic
Urban Internet use higher educated 1.813 (1.661-1.979) p < 0.001 0.90 1.10 c= 0.84
living with someone 1.860 (1.624- 2.129) p < 0.001 0.91 1.09
normal cognition 1.233 (1.186- 1.282) p < 0.001 0.85 1.18
lower in age 1.119 (1.109-1.129) p < 0.001 0.91 1.09
More highly educated: at least a college or university degree; Living with someone: next of kin/partner/friend; Normal cognitive functioning between mean 27 ≤ score ≤ 30 (top score); Lower in age: continuous variable (59 -100 years old). OR: odds ratios; CI: Confidence intervals at 95%; P value NS: not significant; Tolerance and VIF statistic:
variance inflation factor for multicollinearity; C statistic: The c statistic: Concordance statistic ranging from 0.5 (no discrimination) to 1 (outstanding discrimination).
http://mc.manuscriptcentral.com/HIJ 2 3 4 5 6 7 8 9 10 11 12 13 14 15 16 17 18 19 20 21 22 23 24 25 26 27 28 29 30 31 32 33 34 35 36 37 38 39 40 41 42 43 44 45 46 47 48 49 50 51 52 53 54 55 56 57