ARTICLE
Bayesian Forecasting Utilizing Bleeding Information to
Support Dose Individualization of Factor VIII
João A. Abrantes1, Alexander Solms2, Dirk Garmann3, Elisabet I. Nielsen1, Siv Jönsson1 and Mats O. Karlsson1,*
Bayesian forecasting for dose individualization of prophylactic factor VIII replacement therapy using pharmacokinetic
samples is challenged by large interindividual variability in the bleeding risk. A pharmacokinetic-repeated time-to-event
model-based forecasting approach was developed to contrast the ability to predict the future occurrence of bleeds based
on individual (i) pharmacokinetic, (ii) bleeding, and (iii) pharmacokinetic, bleeding and covariate information using observed
data from the Long-Term Efficacy Open-Label Program in Severe Hemophilia A Disease (LEOPOLD) clinical trials (172 severe
hemophilia A patients taking prophylactic treatment). The predictive performance assessed by the area under receiver
op-erating characteristic (ROC) curves was 0.67 (95% confidence interval (CI), 0.65–0.69), 0.78 (95% CI, 0.76–0.80), and 0.79
(95% CI, 0.77–0.81) for patients ≥ 12 years when using pharmacokinetics, bleeds, and all data, respectively, suggesting that
individual bleed information adds value to the optimization of prophylactic dosing regimens in severe hemophilia A. Further
steps to optimize the proposed tool for factor VIII dose adaptation in the clinic are required.
Hemophilia A is a congenital X-linked bleeding disor-der caused by a reduced or defective coagulation factor VIII (FVIII), and the severity is inversely correlated with the amount of functional FVIII an individual is able to produce. Patients with severe hemophilia (endogenous plasma FVIII activity < 1 IU/dL) experience spontaneous bleeds into the joints or muscles, starting typically during the first year of age.1 Long-term prophylaxis with replacement FVIII prod-ucts has been shown to be more effective than on-demand (episodic) treatment to prevent bleeding and joint damage. However, this strategy is costly and relies on the intravenous administration of FVIII products two to three times weekly to maintain a trough FVIII activity above 1 IU/dL. This threshold is supported by the finding that a greater time spent below this level leads to the occurrence of more spontaneous bleeds
and that patients with moderate hemophilia (1–5 IU/dL) bleed less frequently.2,3
In recent years, model-based therapeutic drug monitor-ing based on individual plasma FVIII activity observations has been encouraged as a way to optimize dosing regimens in prophylaxis (pharmacokinetic (PK)-based/driven/guided/ tailored prophylaxis).4,5 Briefly, this method uses Bayesian estimation to produce individual empirical Bayes estimates (EBEs) of PK parameters based on patient information (dose; covariate information, e.g., weight; and individual plasma FVIII activity measurements) and a prior popula-tion PK model. The populapopula-tion PK of FVIII activity has been extensively studied using a two-compartment model.6–8 Concerning FVIII activity measurement, two or three blood samples are recommended to be collected at least 12 hours 1Department of Pharmaceutical Biosciences, Uppsala University, Uppsala, Sweden; 2Bayer, Berlin, Germany; 3Bayer, Wuppertal, Germany. *Correspondence: Mats O. Karlsson (mats.karlsson@farmbio.uu.se)
Received: May 6, 2019; accepted: July 8, 2019. doi:10.1002/psp4.12464
Study Highlights
WHAT IS THE CURRENT KNOWLEDGE ON THE TOPIC? ✔ In recent years, model-based therapeutic drug monitoring using individual pharmacokinetic sam-ples for dose individualization of factor VIII replace-ment products in prophylactic treatreplace-ment has received ample attention. However, the large interindividual variability in bleeding risk partly limits the value of the approach.
WHAT QUESTION DID THIS STUDY ADDRESS? ✔ An integrated pharmacokinetic-repeated time-to-event model was used in Bayesian forecasting of bleeds to con-trast different sources of patient information (factor VIII
activity observations, bleeds and factor VIII activity, and bleeds and covariates) in their ability to predict the occur-rence of bleeds.
WHAT DOES THIS STUDY ADD TO OUR KNOWLEDGE? ✔ Individual bleed information may add value to the opti-mization of prophylactic dosing regimens in severe hemo-philia A.
HOW MIGHT THIS CHANGE DRUG DISCOVERY, DEVELOPMENT, AND/OR THERAPEUTICS?
✔ The model-based approach suggested in this work considers bleeds, the efficacy end point of interest, and can be further developed to individualize dosing regimens.
apart in the period 4–48 hours postdose.5,9 Among the re-cent efforts toward PK-based prophylaxis is the creation of tools for Bayesian forecasting of PK parameters for dose in-dividualization specific to hemophilia products, for instance, the Web-Accessible Population Pharmacokinetic Service— Hemophilia (WAPPS-Hemo, McMaster University, Hamilton, Ontario, Canada; www.wapps-hemo.org) or the medical device myPKFit® (Shire Pharmaceutical Holdings Ireland Limited, Dublin, Ireland; www.mypkf it.com).10,11
Pharmacokinetic-based prophylaxis has been reported to be at least as effective and safe as standard prophylaxis (based only on body weight), with a similar or lower FVIII consumption and fewer infusions (both approaches involve rounding up the dose to the full vial).12–17 However, maintain-ing plasma FVIII activity values above 1 IU/dL is not always sufficient to prevent bleed occurrence in all patients, par-ticularly in those more vulnerable to bleeding or with high physical activity.12,18–21 Other measures of exposure have been associated with bleeding, for instance, peak levels, area under the FVIII activity-time curve, or time above 20 IU/ dL, acknowledging the impact of variability on the individual PK and bleeding risk.22 Recently, eight plasma FVIII activity targets for patients with certain individual clinical character-istics, lifestyles, or those undergoing surgery were suggested based on expert consensus; however, they are still lacking prospective assessment.23 Apart from variability in the PK of FVIII activity, procoagulant or anticoagulant factors, physical activity levels, and comorbidities may be some of the factors behind the high variability observed in bleeding. However, thus far model-based individual treatment optimization of FVIII products in prophylaxis relies solely on individual PK and body size data.
Recently, the relationship between the FVIII activity-time profile, covariates, and bleeding patterns in severe hemo-philia A patients on prophylactic treatment with recombinant FVIII was characterized using an integrated PK-repeated time-to-event (PK-RTTE) model.24 This model consisted of a population PK model describing the longitudinal plasma FVIII activity, a repeated time-to-event model describing the time to the occurrence of bleeds, and a covariate model de-scribing the association of covariates with PK and bleeding risk. Covariates were found to only explain a minor portion of the markedly large unexplained interindividual variability in the bleeding hazard.
The aims of this study were to employ the previously developed integrated PK-RTTE model in Bayesian forecast-ing of bleedforecast-ing events and to contrast different sources of patient information in their ability to predict the future oc-currence of bleeds in severe hemophilia A patients receiving prophylactic FVIII replacement therapy.
METHODS
This study was based on observed data collected during clinical trials. Initially, EBEs were obtained by Bayesian forecasting, employing a PK-RTTE model and alternative information scenarios. Second, the EBEs were used to cal-culate the probability for each patient to have a bleed in the upcoming 24-hour period. Third, the individual bleed-ing probability was compared with the actual occurrence
of a bleed in the upcoming 24-hour period. Finally, the pre-dictive performance given by the alternative information scenarios was compared with probability threshold-depen-dent and threshold-indepenthreshold-depen-dent analyses with graphical illustrations.
Data
Dose information, plasma FVIII activity, time of bleeds, and covariate data collected during the Long-Term Efficacy Open-Label Program in Severe Hemophilia A Disease (LEOPOLD) program were used for this evalua-tion. This three-part comprehensive clinical trial program aimed at assessing the PK, efficacy, and safety of a full-length recombinant human FVIII, BAY 81-8973 (octocog alfa, Kovaltry®; Bayer, Berkeley, CA, USA) in patients with severe hemophilia A.25–27 The trials LEOPOLD I and LEOPOLD II included previously treated patients aged 12–64 years, and LEOPOLD kids included patients aged < 12 years. The individual treatment schedule was sta-blished at the discretion of the investigator within the ranges 20–50 IU/kg 2–3×/week (LEOPOLD I), 20–40 IU/ kg 2–3×/week (LEOPOLD II), and 25–50 IU/kg at least 2×/ week (LEOPOLD kids). In the LEOPOLD I and II trials, the individual treatment schedule established at study start was maintained throughout the study. In the LEOPOLD kids trial, the dosing regimen could be adapted to the in-dividual needs during the study. In our analysis, the data were divided into the following two subgroups: patients aged < 12 years, including data from patients enrolled in LEOPOLD kids; and patients aged ≥ 12 years, including data from patients enrolled in LEOPOLD I and LEOPOLD II.
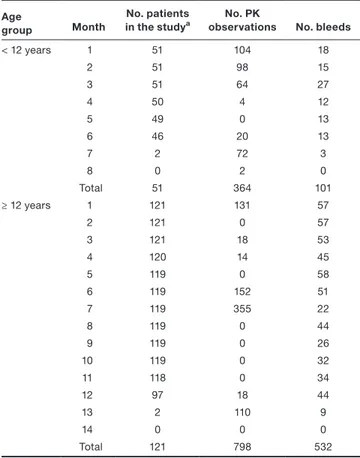
A total of 51 patients were < 12 years and were observed for a median period of 6.1 months (range 3.8–7.2). Of these, 28 patients (55%) had at least one bleed, and in total 101 bleeds were reported during the study (median 1 bleed/pa-tient, range 0–9). A total of 121 patients were ≥ 12 years and were observed for a median period of 12.1 months (range 3.08–13.1). Of these, 88 patients (73%) had at least one bleed, and a total of 532 bleeds were reported (median 2 bleeds/patient, range 0–33). When assessing the predic-tive performance, only 530 bleeds were considered as two bleeds occurred during day 1, and no forecast was avail-able for this day. On day 1, 41 patients < 12 years (80% of total) and 107 patients ≥ 12 years (88% of total) had at least one FVIII observation (Table 1). In all studies, a FVIII activity measurement postdose (15–30 minutes) was avail-able at the start of the observation period, and peak and trough samples were collected repeatedly during the course of the study to determine FVIII recovery. In addition, dense PK sampling was measured during the study in a subset of patients.
Furthermore, information concerning 11 covariates was available, including patient and study characteristics at the study start: age; body weight; body mass index; lean body weight (LBW); race; von Willebrand factor; number of bleeds in the 12 months prestudy period; previous ther-apy history (on demand or prophylaxis); number of target joints for bleeds; ratio of the number of bleeds in the 12-month prestudy period to the number of target joints for
bleeds at study start; and study. More information can be found in the PK-RTTE model development study and in the Supplemental Text.24
Model
The Bayesian prior model was the integrated population PK-RTTE model previously developed based on the LEOPOLD data.24 The PK component consisted of a two-compartment model parameterized in terms of clearances (clearance (CL), inter-compartmental clearance (Q)) and volumes of distribu-tion (central volume of distribudistribu-tion (V1), peripheral volume of distribution (V2)). Central CL and V1 were allometrically scaled using LBW. Interindividual variability was included on CL (30.2 percent coefficient of variation (%CV)), V1 (15.1%CV), and on residual unexplained variability (63.1% CV), with individual random effects 𝜂CL
i , 𝜂 V1 i , and 𝜂
𝜀
i,
respec-tively. The repeated time to the occurrence of bleeds was described in a parametric survival model using a Gompertz hazard function. The individual time-varying bleeding hazard (hi(t)) was given by:
where 2.96 year−1 and −0.566 year−1 are the scale and the shape factors of the Gompertz distribution, respectively; t is the time from the start of the study; FVIIIi(t) is the model- predicted individual time-varying FVIII activity; 10.2 IU/
dL is the FVIII activity level resulting in half-maximum in-hibition of the hazard; and 𝜂
hi(t)
i is the individual random
effect accounting for the individual deviation from the typ-ical bleeding hazard (136% CV). Covariates were included using the full random effects modeling approach28,29 in which covariate values were included as observations, their distributions modeled as random effects, and the in-teraction with the model parameters carried out through the covariance elements. For further information, see the Supplemental Text.
Bayesian forecasting
Empirical Bayes estimates of PK and bleeding hazard parameters were obtained through the minimization of a maximum a posteriori Bayesian objective function.30 The EBEs were estimated for each patient based on the infor-mation available from the start of the study up to the end of each consecutive 24-hour period throughout the study. Eventually, each patient had ni sets of EBEs, with ni equal to the number of study days for that patient. This procedure was repeated for three information scenarios, where infor-mation observed up to the end of each 24-hour period was included in the estimation of the EBEs:
1. PK: Only plasma FVIII activity levels were included, the EBEs related to PK were estimated, and the remaining EBEs were set to zero.
2. Bleed: Only the times of bleeding events were in-cluded, the EBEs related to the bleeding hazard were estimated, and the remaining EBEs were set to zero. 3. All: Plasma FVIII activity levels and time of bleeding
events as well as all covariate information were in-cluded in the estimation of all EBEs.
For Bleed and All, a right-censored observation was assumed at the end of each 24-hour period. For all scenarios, patients’ dose information, predicted time-vary-ing FVIII activity, and observed LBW were used durtime-vary-ing forecasting.
Bleeding probabilistic forecast
The individual forecasted probability of having a bleed in the upcoming 24-hour period, Pi(bleeding), was calculated as follows:
where Si(t) is the probability of not having a bleed between
t and t + 24 derived from the time-varying hazard hi(t), and t is the end of the observation period for estimation of the EBEs. Doses registered during the forecasted 24-hour period were considered in the calculation of hi(t) (Eq. 1) to reflect the true individual FVIII activity levels and are therefore reflected in Pi(bleeding). However, doses administered between the occurrence of a bleed and the end of the corresponding 24-hour period were considered to be on-demand doses and therefore not included in the probabilistic forecast. The fore-casted number of total bleeds during the study time was calculated as the sum of the Pi(bleeding) values over the whole study period.
(1) hi(t) = 2.96 ⋅ e−0.566⋅(t−1) ⋅ ( 1 − FVIIIi(t) FVIIIi(t) + 10.2 ) ⋅e𝜂 hi(t) i (2) P i(bleeding) = 1 − Si(t + 24) = 1−e −∫tt+24hi(t)dt Table 1 Number of patients, PK observations, and reported bleeds
over time, stratified by age group Age
group Month
No. patients
in the studya observationsNo. PK No. bleeds
< 12 years 1 51 104 18 2 51 98 15 3 51 64 27 4 50 4 12 5 49 0 13 6 46 20 13 7 2 72 3 8 0 2 0 Total 51 364 101 ≥ 12 years 1 121 131 57 2 121 0 57 3 121 18 53 4 120 14 45 5 119 0 58 6 119 152 51 7 119 355 22 8 119 0 44 9 119 0 26 10 119 0 32 11 118 0 34 12 97 18 44 13 2 110 9 14 0 0 0 Total 121 798 532 PK, pharmacokinetics.
Variation of Bayesian forecasting observation period In the default case, the EBE estimation was based on obser-vations from the start of the study. In addition, observation periods including the past 15 days or 1, 2, 3, or 6 months for each patient were explored using the Bleed information scenario. This step was performed to assess the influence of varying the observation period for EBE estimation within each patient and learn about the trade-off between a longer period (more individual information accumulated for future predictions) and the most recent period (the most up-to-date information).
Predictive performance assessment
The predictive performance was assessed by comparing
Pi(bleeding), with the observed occurrence of a bleed in the forecasted day using the following analyses with graphical illustrations. Separation plots were used to illustrate how the individual probabilistic forecast matched with the occur-rence of a bleed.31 In these plots, P
i(bleeding) was plotted in ascending order of Pi(bleeding), highlighting the Pi(bleeding) associated with the bleed occurrence in the forecasted day. In addition, we performed receiver operating characteris-tic (ROC) analyses to compare the predictive performance between scenarios.32,33 An ROC curve that overlaps the di-agonal line, i.e., the random-classifier baseline, corresponds to an uninformative test, equivalent to a random classifier, and the closer the ROC curve is to the upper left corner, the higher the overall performance of the test. The ROC curves were compared using the area under the curve (AUC), cal-culated with the trapezoidal rule, with higher AUC values indicating higher accuracy.34 The optimal threshold with re-spect to Pi(bleeding) for the discrimination between bleeds and no bleeds was determined by the Youden’s J statis-tics.35 The 95% confidence intervals (CI) of ROC-related summary indices were calculated based on a stratified bootstrap (2,000 replicates). Furthermore, we performed precision- recall (PR) analyses to assess the performance of information scenarios when considering precision. The AUC calculation of the PR curve was calculated using nonlinear interpolation, as suggested by Davis and Goadrich.36
The individual prediction error (PEi) for the ith patient was calculated as:
where Bleedforecast is the number of forecasted bleeds and Bleedobserved is the number of observed bleeds during the whole individual study period.
Software
Bayesian forecasting was performed using NONMEM version 7.4.3 (ICON Development Solutions, Ellicott City, MD), and Perl-speaks-NONMEM version 4.8.1 was used for NONMEM run control.37,38 Data management and graphical analyses were performed using R 3.5.1 (http://www.rproj ect.org/). RESULTS
Bayesian forecasting
The median forecasting period for patients aged < 12 years was 183 days (range 113–217 days), and for patients aged ≥ 12 years was 365 days (range 93–394 days). The values of 𝜂CLi and 𝜂
hi(t)
i over time, obtained through Bayesian
forecast-ing, are represented in Figure 1.
For the information scenario PK, 𝜂CLi values were zero at the start of the study and changed when PK observa-tions became available, and 𝜂
hi(t)
i values were set to zero
because no information about bleeds was provided. In con-trast, when bleeds were considered, 𝜂iCL values were set to zero and 𝜂
hi(t)
i values were zero at the start of the study and
increased when a subject had a bleed or decreased other-wise. For All, 𝜂CLi and 𝜂
hi(t)
i were informed by covariates, PK,
and bleed data from the start of the study. Bleeding probabilistic forecast
The observed and model-predicted plasma FVIII activity, time of bleeds, and forecasted Pi(bleeding) for the three information scenarios for three illustrative patients through-out the first 12 weeks is shown in Figure 2.
The probability of having a bleed on a certain day is in-versely correlated with the plasma FVIII activity predicted for that same day, as expected given the FVIII activity–
(3)
PEi=Bleedforecast−Bleedobserved
Figure 1 Longitudinal changes in 𝜂CLi (left) and 𝜂 hi(t)
i (right) when updated on a 24-hour basis based on each information scenario from
the start of the study. Plots for 𝜂iV1 and 𝜂𝜀i are available in Supplemental Material Figure S1.
PK Bleed All <12 y ear s >=12 ye ar s 0 60 120180240300360420 0 60120180240300360420 0 60120180240300360420 −1.0 −0.5 0.0 0.5 1.0 −1.0 −0.5 0.0 0.5 1.0 Day of forecast ηi CL PK Bleed All <12 y ear s >=12 ye ar s 0 60 120180240300360420 0 60120180240300360420 0 60120180240300360420 −3 −2 −1 0 1 2 3 −3 −2 −1 0 1 2 3 Day of forecast ηi hi ( t )
hazard relationship defined in the Bayesian prior model. At the start of the study, the bleeding probabilities associated with PK or Bleed are similar, provided that no bleeds oc-curred. Throughout time, the forecasted probability given by PK remains relatively constant, regardless of the occur-rence of bleeds, and is a function of dosing schedule and PK parameters, with the latter reevaluated when PK mea-surements are available. In contrast, the probability using only bleed data tends to decrease provided that no bleeds occurred (patient 1, patient 2 before bleed on day 49, patient 3 before bleed on day 7) or to increase if a patient has a bleed (patient 2 after day 49 and patient 3 after bleed on day 7). Moreover, the forecast based on Bleed tends to become closer to the forecast based on all information throughout time, and both tend to decrease over time, provided that no bleeds occur.
Predictive performance
The total number of observed bleeds during the evaluation period was 101 bleeds for the group aged < 12 years, and 530 bleeds for the group aged ≥ 12 years. At a population level, the forecasted number of bleeds during the same pe-riod for the group aged < 12 years was 66 (PK), 96 (Bleed), and 90 bleeds (All), and for the group aged ≥ 12 years was 218 (PK), 461 (Bleed), and 500 bleeds (All). The difference in Pi(bleeding) between days when bleeds occurred and no-bleed days was higher for Bleed and All than for PK, as represented in Figure 3. In addition, the occurrence of bleeds was associated with a sharper change in Pi(bleeding) for the Bleed and All scenarios when compared with PK, which was observed for both age groups.
The ROC curves indicated Bleed and All superior to PK, with the former having higher true positive rates and lower
Figure 2 Observed and model-predicted plasma FVIII activity (upper panels), forecasted bleeding probability (Pi(bleeding)) (lower panels), and observed time of bleeds for three illustrative patients with no bleeds (patient 1), one bleed (patient 2), and multiple bleeds (patient 3). FVIII, factor VIII.
0.1 1.0 5.0 100 500
FVIII activity (IU/dL)
Individual predictions PK observation Dose
Patient 1
0 0.005 0.010 0.015 0 7 14 21 28 35 42 49 56 63 70 77 84 Forecasted day Pi(
bl eed ing)
PK Bleed All 0.1 1.0 5.0 100 500FVIII activity (IU/dL)
Individual predictions PK observation Bleed observation Dose
Patient 2
0 0.01 0.02 0.03 0.04 0 7 14 21 28 35 42 49 56 63 70 77 84 Forecasted day Pi(
bleeding)
PK Bleed All Bleed observation 0.1 1.0 5.0 100 500FVIII activity (IU/dL)
Individual predictions PK observation Bleed observation Dose
Patient 3
0 0.05 0.1 0.15 0 7 14 21 28 35 42 49 56 63 70 77 84 Forecasted day Pi(
bl ee di ng)
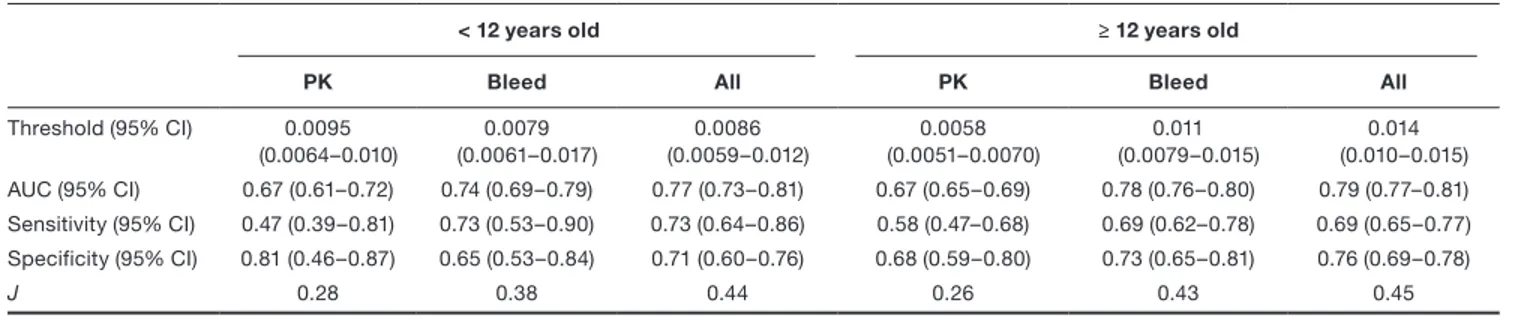
PK Bleed All Bleed observationfalse positive rates at all cut-off values (Figure 4). For the group aged < 12 years, the AUC for PK was 0.67 (95% CI, 0.61–0.72), being slightly lower than for Bleed and All with AUC 0.74 (95% CI, 0.69–0.79) and 0.77 (95% CI, 0.73–0.81), respectively (Table 2). For the group aged ≥ 12 years, the dif-ference between scenarios was more evident with the AUC for PK of 0.67 (95% CI, 0.65–0.69) being considerably lower than for Bleed, 0.78 (95% CI, 0.76–0.80). Bleed and All had similar performances (Table 2).
A similar trend was found in the PR analysis (Figure S2), with the information scenarios All and Bleed being superior
to PK, with PK closer to the performance of a random clas-sifier. For the group aged < 12 years, the AUC of the PR curves were 0.023 (PK), 0.030 (Bleed), 0.033 (All), and 0.011 (random classifier). For the group aged ≥ 12 years, the AUC of the PR curves were 0.028 (PK), 0.064 (Bleed), 0.064 (All), and 0.012 (random classifier).
Variation of Bayesian forecasting observation period The prediction error related to the forecast of bleeds for the whole study while varying the observation period is shown in Figure 5 for the Bleed scenario (chosen given the minor
Figure 3 Separation plots for the bleeding probabilistic forecast Pi(bleeding) for the information scenarios PK, Bleed, and All (note difference in y-axis scale). Bleed events are represented with red vertical bars, and no-bleed events are represented with gray vertical bars. Since the occurrence of bleeds was rare, vertical bars corresponding to bleed events were emphasized. The solid black line represents the values of Pi(bleeding) associated with bleeds (red vertical bars) or no bleeds (gray vertical bars), and the black vertical dashed lines represent the 25th and 50th percentiles of the bleeding event data (red vertical bars). More red vertical bars located on the right-hand side of the plot indicates better predictive performance.
0.000 0.005 0.010 0.015PK 0.00 0.05 0.10 0.15 0.20 Pi ( bleeding ) Bleed 0.00 0.05 0.10 0.15 0.20
Order of Pi(bleeding) (smallest to largest)
All <12 years 0.000 0.005 0.010 0.015 PK 0.00 0.05 0.10 0.15 0.20 Pi ( bl ee ding ) Bleed 0.00 0.05 0.10 0.15 0.20
Order of Pi(bleeding) (smallest to largest)
All
>=12 years
Figure 4 Receiver operating characteristic curves for the ability of each information scenario to predict the occurrence of bleeds. The dashed line is the random-classifier baseline.
0.00 0.25 0.50 0.75 1.00 0.00 0.25 0.50 0.75 1.00
False positive rate
Tr ue positi ve rate PK Bleed All
<12 years
0.00 0.25 0.50 0.75 1.00 0.00 0.25 0.50 0.75 1.00False positive rate
Tr ue positi ve rate PK Bleed All
>=12 years
performance differences when compared with All). The separation plots and results of the ROC analyses can be found in Figures S3 and S4 and Table S1.
Bleeds in patients with a low bleeding risk were over-predicted, improving marginally when longer observation periods were used to estimate the EBEs. In contrast, bleeds in patients with a high bleeding risk were underpredicted and longer observation periods were associated with improved forecasts. In these patients, the estimation of the EBEs was informed mostly by observations in the previous 60–90 days. Concerning the bias observed, it is important to recognize that any good model would underpredict bleeding values higher than the median number of bleeds and overpredict values lower than the median as a result of η-shrinkage. The
prediction of bleeds in patients with a moderate bleeding risk was unbiased, and an observation period longer than 60 days did not contribute substantially with information to improve the bleeding forecast.
DISCUSSION
Pharmacokinetic-based dosing with sparse plasma FVIII ac-tivity observations has been proposed as a tool to optimize prophylactic dosing regimens in hemophilia A. In this study, we assessed the use of a PK-RTTE model for Bayesian forecasting of bleeding events and compared the ability to predict future bleeds using different sources of patient infor-mation, namely, PK observations, bleeds, or all information Table 2 Summary statistics of the receiver operating characteristic analyses and the optimal thresholds
< 12 years old ≥ 12 years old
PK Bleed All PK Bleed All
Threshold (95% CI) 0.0095 (0.0064–0.010) 0.0079 (0.0061–0.017) 0.0086 (0.0059–0.012) 0.0058 (0.0051–0.0070) 0.011 (0.0079–0.015) 0.014 (0.010–0.015) AUC (95% CI) 0.67 (0.61–0.72) 0.74 (0.69–0.79) 0.77 (0.73–0.81) 0.67 (0.65–0.69) 0.78 (0.76–0.80) 0.79 (0.77–0.81) Sensitivity (95% CI) 0.47 (0.39–0.81) 0.73 (0.53–0.90) 0.73 (0.64–0.86) 0.58 (0.47–0.68) 0.69 (0.62–0.78) 0.69 (0.65–0.77) Specificity (95% CI) 0.81 (0.46–0.87) 0.65 (0.53–0.84) 0.71 (0.60–0.76) 0.68 (0.59–0.80) 0.73 (0.65–0.81) 0.76 (0.69–0.78) J 0.28 0.38 0.44 0.26 0.43 0.45
AUC, area under the receiver operating characteristic curve; CI, confidence interval; J, Youden’s J statistics.
Figure 5 Percentiles of the prediction error (PEi) while varying the Bayesian forecasting observation period length, stratified by bleeding risk and age group for the scenario Bleed. Bleeding risk was categorized as low risk if patients did not bleed during the study (< 12 years, N = 23 patients; ≥ 12 years, N = 33); moderate risk if 1–2 bleeds were observed in the group aged < 12 years (N = 11) or 1–4 bleeds in the group aged ≥ 12 years (N = 49), and high risk if ≥ 3 bleeds were observed in the group aged < 12 years (N = 17) or ≥ 5 bleeds in the group aged ≥ 12 years (N = 39).
Low risk Moderate risk High risk
age < 12 ye ars ol d age >= 12 ye ars ol d 15 day s 30 days60 days90 da180 days all studys y
15 days30 days60 days90 da180 days all study 15 days ys30 days60 days90 da180 days ysall stud
y −6 −4 −2 0 2 −14 −12 −10−8 −6 −4 −20 2 4
Observation period length
PE
i(
bleeds
)
Percentiles
10th 50th 90thavailable. The PK data, time of bleeds, and covariates were those observed in children and adults during the LEOPOLD studies. The Bayesian forecasting of bleeds based on indi-vidual daily bleeding information was found to perform better than forecasting based on individual PK information only.
The forecasted number of bleeds during the study was lower for PK than for the other approaches because no bleeding information was used. The distribution of the number of observed bleeds was positively skewed (median 2 bleeds, mean 3.7 bleeds), and the bleeding hazard was modeled using a log-normal distribution. Therefore, in the absence of bleeding information, the typical hazard was translated into the median number of bleeds, which resulted in an underprediction of the number of bleeds in patients with a high bleeding risk. Separation plots can be used to compare predictors of events without having to consider probability thresholds. In these plots, the information sce-nario Bleed had a similar performance when compared with All, and both were superior to PK. The same conclusion can be drawn from the ROC analysis with AUC values for Bleed being substantially higher than PK and only slightly worse than All. We also performed a PR analysis because the ROC analysis could be misleading in the presence of an imbalanced class distribution, as the number of no bleeds outweighs considerably the number of bleeds (bleeds oc-curred during only ~ 1% of the forecasted days).39 The PR analysis was in agreement with the ROC analysis with re-spect to the ranking of the approaches. However, the PR analysis, which specifically focus on precision, revealed a low precision for all information scenarios. This is expected because the occurrence of a bleed has a sustained effect on Pi(bleeding), which remains above the optimal probability thresholds, thus leading to many false positive values.
Overall, the minor improvement of including all information, compared with only including bleeds, confirms the previous observation that covariates are weak predictors of the occur-rence of bleeds.24 Past observed bleeding information driving the forecast of future bleeds agrees with the theoretical mathematical expectations because the unexplained interin-dividual variability on the bleeding hazard is large (136% CV). In addition, it agrees with clinical expectations because the clinical phenotype between patients with severe hemophilia A is known to be variable, and patients may respond differently to identical plasma FVIII activity levels.12,18–21 Information about individual PK is relevant to understand intraindividual fluctuations in the bleeding hazard, which might be useful to adapt dosing regimens to the patient’s needs (e.g., during a period of more intense physical exercise). According to this evaluation, bleed information may be more informative than PK to characterize the interpatient bleeding risk. However, both individual PK and bleeding risk may be necessary to decide a suitable course of action with respect to the future individualization of dosing regimens.
According to our results, the longer the observation pe-riod for EBEs estimation the better, with no advantage to use only the most up-to-date information. Patients with a high bleeding risk were found to require shorter observa-tion periods to inform the EBEs, namely, between 60 and 90 days prior to the EBEs estimation. In contrast, patient
with no bleeds had a much slower learning curve and re-quired longer observation periods. However, these results should be interpreted with caution because in the group aged < 12 years the information was limited (lower number of bleeds and shorter observation periods) for the assessment of the relative merits of the different observation periods.
One limitation of this study is that the individual observed PK, bleed, and covariate data used for Bayesian forecasting were those included in the development of the prior model used in the forecast. The variability found in a real-world scenario might be higher than in the LEOPOLD clinical trials. However, using the same set of data decreases bias related to an inappropriate structural or stochastic prior model and provides a realistic comparison of the bleed prediction be-tween information scenarios. The methodology applied in our study, using maximum a posteriori Bayesian estimation, to estimate the individual PK parameters using the informa-tion scenario PK was similar to the existing tools available for PK-based FVIII dose individualization employing parametric methods. However, a limitation of our evaluation is that the number of PK samples and sampling times available during the LEOPOLD studies did not correspond necessarily to the 2–3 samples recommended for FVIII individual PK profiling used in PK-based prophylaxis.5,9 On some occasions, only one sample was available, whereas on others more samples were available. In addition, the treatment with FVIII in the LEOPOLD studies was efficient, and patients were overall well protected against bleeds by allowing the dose to vary between patients where the individual PK (known from other products) and bleeding phenotype were indirectly consid-ered. Therefore, an extrapolation of our findings to PK-based prophylaxis or when considering other dosing regimens has to be done with caution.
Several aspects related to our evaluation deserve fur-ther study. This work focuses on forecasting bleeds. The translation of the findings to dose optimization through model-based bleed-guided and PK-guided prophylaxis in the clinic requires further exploration. The magnitude of the individual dose change in the case of dose adaption needs to be defined, and the identification of the threshold value of the ROC curves for individual dose adaptation can be expanded to include an efficiency criterion, accounting for the false-positive and false-negative cost.40 In addition, information about covariates may have the potential to im-prove the predictive performance of the Bleed approach, in particular, when a patient is observed for the first time, and deserves further exploration. Finally, the model used in this study assumed a bleeding hazard that decreases over time, likely because of a treatment or trial effect, and how the information strategies perform in the presence of a time- independent hazard merits further analysis.
In this study, we evaluated if an integrated PK-RTTE model could be used to predict the occurrence of future bleeds using past observed data from clinical trials. Bayesian fore-casting using such a model can be applied to other studies involving hemophilia A patients to adapt dosing regimens and to further assess the importance of different sources of patient information to include during Bayesian forecasting. In addition, the approach proposed in this study, through the
calculation of the individual bleeding probabilistic forecast based on the individual’s information about bleeds, could be implemented in a platform providing patients and clin-ics with the prospective time-varying risk of having a bleed. Furthermore, this platform could alert the patient to consult the treating physician for a possible change in the dosing regimen in case the forecasted bleeding probability is above a certain probability threshold for a certain time period.
In conclusion, we developed an integrated PK-RTTE approach for bleeding forecast considering the individual historical bleeding pattern under prophylactic treatment with a recombinant FVIII product. In addition, this work presents promising results suggesting that individual bleeding infor-mation adds value to the optimization of prophylactic dosing regimens in severe hemophilia A. Further steps to optimize the proposed tool for FVIII dose adaptation in the clinic are required.
Supporting Information. Supplementary information accompa-nies this paper on the CPT: Pharmacometrics & Systems Pharmacology website (www.psp-journal.com).
Supplemental Material. Supplemental Text, Figures S1-S4, Table S1. Acknowledgments. The authors thank Megan Giliam of Darwin Healthcare Communications, who managed the editorial process, fully funded by Bayer.
Funding. Bayer sponsored the analysis and the editorial process. Conflict of Interest. J.A.A., E.I.N., S.J., and M.O.K. are employees of the Department of Pharmaceutical Biosciences, Uppsala University. A.S. and D.G. are employees of Bayer. J.A.A., E.I.N., and S.J. have re-ceived funding from Pfizer Limited, United Kingdom, for research in he-mophilia (Moroctocog alfa).
Author Contributions. J.A.A. wrote the manuscript. M.O.K, J.A.A., E.I.N., S.J., A.S., and D.G. designed the research. J.A.A., M.O.K., E.I.N., and S.J. performed the research. J.A.A., M.O.K., E.I.N., and S.J. analyzed the data.
1. Onwuzurike, N., Warrier, I. & Lusher, J.M. Types of bleeding seen during the first 30 months of life in children with severe haemophilia A and B. Haemophilia 2, 137–140 (1996).
2. Collins, P.W. et al. Break-through bleeding in relation to predicted factor VIII levels in patients receiving prophylactic treatment for severe hemophilia A. J. Thromb. Haemost. 7, 413–420 (2009).
3. Ahlberg, A. Haemophilia in Sweden. VII. Incidence, treatment and prophylaxis of arthropathy and other musculo-skeletal manifestations of haemophilia A and B. Acta Orthop. Scand. 77 (suppl.), 73–132 (1965).
4. Berntorp, E. If you know you will also see: population pharmacokinetics is the way to personalize and optimize prophylaxis in hemophilia. J. Thromb. Haemost. 15, 1103–1105 (2017).
5. Iorio, A. et al. Estimating and interpreting the pharmacokinetic profiles of individual patients with hemophilia A or B using a population pharmacokinetic approach: com-munication from the SSC of the ISTH. J. Thromb. Haemost. 15, 2461–2465 (2017). 6. Abrantes, J.A., Nielsen, E.I., Korth-Bradley, J., Harnisch, L. & Jonsson, S.
Elucidation of factor VIII activity pharmacokinetics: a pooled population analysis in patients with hemophilia a treated with moroctocog alfa. Clin. Pharmacol. Ther. 102, 977–988 (2017).
7. Bjorkman, S. et al. Population pharmacokinetics of recombinant factor VIII: the relationships of pharmacokinetics to age and body weight. Blood 119, 612–618 (2012).
8. Garmann, D. et al. Population pharmacokinetic characterization of BAY 81-8973, a full-length recombinant factor VIII: lessons learned—importance of including
samples with factor VIII levels below the quantitation limit. Haemophilia 23, 528– 537 (2017).
9. Bjorkman, S. & Collins, P. Measurement of factor VIII pharmacokinetics in routine clinical practice. J. Thromb. Haemost. 11, 180–182 (2013).
10. Iorio, A. et al. Development of a web-accessible population pharmacokinetic ser-vice-hemophilia (WAPPS-Hemo): study protocol. JMIR Res. Protoc. 5, e239 (2016). 11. Alvarez-Roman, M.T. et al. Experience of tailoring prophylaxis using factor VIII
pharmacokinetic parameters estimated with myPKFiT((R)) in patients with severe haemophilia A without inhibitors. Haemophilia 23, e50–e54 (2017).
12. Valentino, L.A. et al. A randomized comparison of two prophylaxis regimens and a paired comparison of on-demand and prophylaxis treatments in hemophilia A management. J. Thromb. Haemost. 10, 359–367 (2012).
13. Iannazzo, S. et al. Cost-effectiveness analysis of pharmacokinetic-driven prophy-laxis vs. standard prophyprophy-laxis in patients with severe haemophilia A. Blood Coagul. Fibrinolysis 28, 425–430 (2017).
14. Pasca, S., Milan, M., Sarolo, L. & Zanon, E. PK-driven prophylaxis versus standard prophylaxis: When a tailored treatment may be a real and achievable cost-saving approach in children with severe hemophilia A. Thromb. Res. 157, 58–63 (2017). 15. Lissitchkov, T. et al. PK-guided personalized prophylaxis with Nuwiq((R)) (human-cl
rhFVIII) in adults with severe haemophilia A. Haemophilia 23, 697–704 (2017). 16. Megias-Vericat, J.E. et al. Bayesian pharmacokinetic-guided prophylaxis with
recombinant factor VIII in severe or moderate haemophilia A. Thromb. Res. 174, 151–162 (2019).
17. Nagao, A., Yeung, C.H.T., Germini, F. & Suzuki, T. Clinical outcomes in hemophilia A patients undergoing tailoring of prophylaxis based on population-based pharmaco-kinetic dosing. Thromb. Res. 173, 79–84 (2019).
18. Bjorkman, S. Prophylactic dosing of factor VIII and factor IX from a clinical phar-macokinetic perspective. Haemophilia 9 (suppl. 1), 101–108 (2003); discussion 109–110.
19. Ahnstrom, J., Berntorp, E., Lindvall, K. & Bjorkman, S. A 6-year follow-up of dosing, coagulation factor levels and bleedings in relation to joint status in the prophylactic treatment of haemophilia. Haemophilia 10, 689–697 (2004).
20. Aledort, L.M., Haschmeyer, R.H. & Pettersson, H. A longitudinal study of ortho-paedic outcomes for severe factor-VIII-deficient haemophiliacs. The Orthoortho-paedic Outcome Study Group. J. Intern. Med. 236, 391–399 (1994).
21. Petrini, P. What factors should influence the dosage and interval of prophylactic treatment in patients with severe haemophilia A and B? Haemophilia 7, 99–102 (2001).
22. Valentino, L.A. et al. Association of peak factor VIII levels and area under the curve with bleeding in patients with haemophilia A on every third day pharmacokinet-ic-guided prophylaxis. Haemophilia 22, 514–520 (2016).
23. Iorio, A. et al. Target plasma factor levels for personalized treatment in haemophilia: a Delphi consensus statement. Haemophilia 23, e170–e179 (2017).
24. Abrantes, J.A. et al. Relationship between factor VIII activity, bleeds and individual characteristics in severe hemophilia A patients. Haematologica. 2019 https ://doi. org/10.3324/haema tol.2019.217133. [e-pub ahead of print].
25. Saxena, K. et al. Efficacy and safety of BAY 81-8973, a full-length recombinant factor VIII: results from the LEOPOLD I trial. Haemophilia 22, 706–712 (2016). 26. Kavakli, K. et al. Prophylaxis vs. on-demand treatment with BAY 81-8973, a full-length plasma protein-free recombinant factor VIII product: results from a random-ized trial (LEOPOLD II). J. Thromb. Haemost. 13, 360–369 (2015).
27. Ljung, R. et al. BAY 81-8973 safety and efficacy for prophylaxis and treatment of bleeds in previously treated children with severe haemophilia A: results of the LEOPOLD Kids Trial. Haemophilia 22, 354–360 (2016).
28. Yngman, G., Nyberg, J., Jonsson, N. & Karlsson, M.O. Practical considerations for using the full random effects modeling (FREM) approach to covariate modeling. Abstracts of the Annual Meeting of the Population Approach Group in Europe, Budapest, Hungary, June 6–9, 2017. Abstract 7365. < https ://www.page-meeti ng.org/defau lt.asp?abstr act=7365 > (2017).
29. Karlsson, M.O. A full model approach based on the covariance matrix of parame-ters and covariates. Abstracts of the Annual Meeting of the Population Approach Group in Europe, Venice, Italy, June 5–8, 2012. Abstract 2455. < https ://www. page-meeti ng.org/defau lt.asp?abstr act=2455 > (2012).
30. Sheiner, L.B., Beal, S., Rosenberg, B. & Marathe, V.V. Forecasting individual phar-macokinetics. Clin. Pharmacol. Ther. 26, 294–305 (1979).
31. Greenhill, B., Ward, M.D. & Sacks, A. The separation plot: a new visual method for evaluating the fit of binary models. Am. J. Political Sci. 55, 991–1002 (2011). 32. Fawcett, T. An introduction to ROC analysis. Pattern Recogn. Lett. 27, 861–874
(2006).
33. Lusted, L.B. Decision-making studies in patient management. N. Engl. J. Med. 284, 416–424 (1971).
34. Hanley, J.A. & McNeil, B.J. The meaning and use of the area under a receiver oper-ating characteristic (ROC) curve. Radiology 143, 29–36 (1982).
35. Youden, W.J. Index for rating diagnostic tests. Cancer 3, 32–35 (1950). 36. Davis, J. & Goadrich, M. The relationship between Precision-Recall and ROC
curves. Proceedings of the 23rd International Conference on Machine Learning. 233–240 (ACM, New York, 2006).
37. Beal, S.L., Sheiner, L.B., Boeckmann, A.J. & Bauer, R.J. (Eds). NONMEM 7.4 Users Guides (ICON plc, Gaithersburg, MD, 1989–2018).
38. Keizer, R.J., Karlsson, M.O. & Hooker, A. Modeling and simulation workbench for NONMEM: tutorial on Pirana, PsN, and Xpose. CPT Pharmacometrics Syst. Pharmacol. 2, e50 (2013).
39. Saito, T. & Rehmsmeier, M. The precision-recall plot is more informative than the ROC plot when evaluating binary classifiers on imbalanced datasets. PLoS ONE 10, e0118432 (2015).
40. Clements, J.D. et al. Receiver operating characteristic analysis and clinical trial sim-ulation to inform dose titration decisions. CPT Pharmacometrics Syst. Pharmacol. 7, 771–779 (2018).
© 2019 The Authors. CPT: Pharmacometrics & Systems Pharmacology published by Wiley Periodicals, Inc. on be-half of the American Society for Clinical Pharmacology and Therapeutics. This is an open access article under the terms of the Creat ive Commo ns Attri butio n-NonCo mmercial License, which permits use, distribution and reproduc-tion in any medium, provided the original work is properly cited and is not used for commercial purposes.