Abstract
Despite evidence of rising popularity of video on the web (or VOW), little is known about how users access video. However, such a characterization can greatly benefit the design of multimedia systems such as web video proxies and VOW servers. Hence, this paper presents an analysis of trace data obtained from an ongoing VOW experiment in Luleå University of Technology, Sweden. This experiment is unique as video material is distributed over a high band-width network allowing users to make access decisions without the network being a major factor. Our analysis revealed a number of interesting discoveries regarding user VOW access. For example, accesses display high tempo-ral locality: sevetempo-ral requests for the same video title often occur within a short time span. Accesses also exhibited spa-tial locality of reference whereby a small number of machines accounted for a large number of overall requests. Another finding was a browsing pattern where users preview the initial portion of a video to find out if they are inter-ested. If they like it, they continue watching, otherwise they halt it. This pattern suggests that caching the first several minutes of video data should prove effective. Lastly, the analysis shows that, contrary to previous studies, rankings of video titles by popularity did not fit a Zipfian distribution.
1. Introduction
Videos form a significant portion of Internet traffic. In MMCN 1998, we published an investigation of the character-istics of video data stored on the web [1]. One of our key findings was that the number of movies coming online was increasing at a rapid rate. Such an increase, coupled with the large size of the videos in our study (as opposed to other types of WWW documents), hinted that video access would soon constitute a large percentage of WWW bytes trans-ferred on the Internet. This trend was confirmed by a recent analysis [15] of Web related traffic emanating from the entire University of Washington campus over a week in mid-January 1999. The study reported that audio/video data constituted at least 17% of all the bytes transferred.
However, despite the growing popularity of video content, little is known about how users access video on the Web. Our earlier report presents a partial picture of video usage: we know about the properties of the video files but we do not know how these files are accessed. Knowledge of access patterns is crucial for the design of systems that enhance VOW access such as video proxy caches, VOW servers, and multimedia file systems. For example, if access patterns reveal repeated requests of specific video titles by multiple clients from the same organization, client-side caching could improve access performance. Similarly, if smaller videos were more likely to be accessed than large videos, the system could be optimized accordingly. In the absence of such analyses, we conducted our own study of VOW access patterns. Our goal was to answer the following questions:
• Do accesses to videos exhibit temporal locality?
• How frequently are videos accessed compared to HTML documents? • Do users exhibit any specific browsing patterns when viewing videos?
Our answers to these questions are based on a study of user access patterns and file characteristics of an ongoing VOW experiment in Luleå University of Technology, Sweden. This VOW experiment is unique because video mate-rial is distributed over a high bandwidth network. Hence, users can make access decisions without the network being a major factor. Similarly, the stored video data is designed for a high speed network. Sample findings from our study
Soam Acharya Brian Smith
soam@cs.cornell.edu bsmith@cs.cornell.eduDepartment of Computer Science Cornell University
Ithaca, NY 14853
Characterizing User Access To Videos On The World Wide Web
Peter Parnes
peppar@cdt.luth.seCenter For Distance-spanning Technology Luleå University of Technology
included:
1. Inter-arrival times: median interarrival time of about 400 seconds indicate that requests for videos are nowhere near as frequent as those for HTML documents.
2. Video browsing patterns: users often view the initial part of videos in order to determine if they are interested or not. If they like what they see, they continue watching. Otherwise, they stop. We found that about 55% of all playbacks went to completion in our analysis. Most of the remaining 45% stopped very early on in the movie playback.
3. Temporal Locality: accesses to videos also exhibit strong temporal locality. If a video has been accessed recently, chances are that it will be accessed again soon.
4. File size trends: videos are becoming larger as more network bandwidth becomes available and low bitrate streaming protocols get deployed in video distribution. With a high bandwidth network and H.261 based multi-cast architecture in place, the median size of files at the Lulea University video server was 110 MBytes. Median duration was 77 minutes.
The remainder of this paper is organized as follows. Section 2 provides more information about the setup of the VOW experiment and section 3 presents an analysis of the video files actually accessed by the users during the course of the experiment. In this section, we examine the average size and duration of the video files as well as their bitrate distribution. Section 4 is divided into two parts. First, we detail our criteria for eliminating erroneous requests from the user access traces. For example, we ignore requests from the demo machine since they do not represent standard user behavior. In the second part of section 4, we report the results of our access pattern investigation on the filtered trace. We examine properties such as how user requests vary on a day to day basis and whether video accesses exhibit any temporal properties. We outline related work in section 5 and conclude with some observations in section 6.
2. Background
Since 1995, the Centre for Distance-spanning Technology at Luleå University (CDT) has been researching distance education and collaboration on the Internet [17]. Specifically, it has developed a hardware/software infrastructure for giving WWW-based courses and creating a virtual student community. The hardware aspects include the deployment of a high speed network (2-34 Mbps backbone links) to attach the local communities to the actual University campus. The campus is also connected to the national academic backbone by a high speed 34 Mbps link [13] with student apartments being wired together with the rest of campus via 10 or 100 Mbps ethernet. On the software side, the mStar environment, developed at CDT, provides a collection of web-based authoring, presentation and recording tools that use the Mbone for content delivery [8]. In particular, the mMOD (the multicast Media On Demand) system, a compo-nent of mStar, allows for recording and playback of classroom lectures, seminars and meetings [12].
The mMOD system consists of two separate programs, the VCR and the Web Controller. The VCR allows for recording and playing back of broadcasts. H.261 [14] is used for video compression in most cases. Recorded data is stored on the mMOD web server. The VCR also permits the fast forwarding or rewinding of a video stream.
The Web Controller provides an interface for the mMOD system - it allows users to request new video/audio playback sessions from the mMOD server. Additionally, it also permits users to join sessions already in progress. Users are able to view material via standard tools such as vic or vat [10]. A set of Java applets are also available for this purpose [18]. The entire system is available in a commercial version from [19].
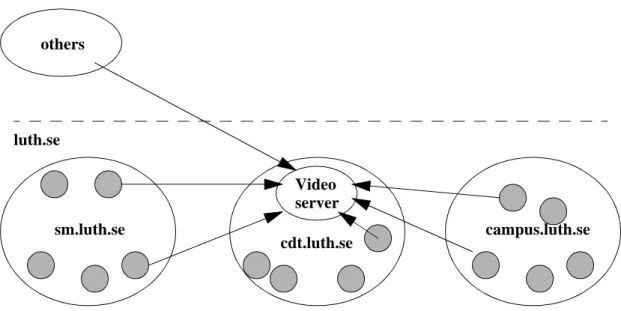
Figure 1 shows the playback architecture of the mMOD system on the Luleå University campus. User requests arrive at the mMOD server from three main subdomains within the campus, as well as from external sources. Since the mMOD server is the focus of both recording and playback, its log files form the basis for video access analysis, while its file system records provide the raw data for determining intrinsic file characteristics.
3. Video File Characteristics
As of 10th March, 1998, the mMOD server (mmod.cdt.luth.se) hosted 139 audio/video titles that, according to the log traces, had been accessed at least once. Video content ranged from classroom lectures and seminars to traditional movies. Student enrollment in the undergraduate courses ranged from 100-140 with smaller numbers attending the
graduate courses. All movies were CIF (320 x 240) in size. In the remainder of this section, we outline the basic char-acteristics of these file - their size, durations, and bitrate distributions.
3.1 Size
The file size analysis was based on detailed directory listings from the mMOD video server. Overall, the files totalled 15.7 Gbytes in size. Individually, each title is composed of separate audio and video files but in this analysis we aggregate them together. Figure 2 shows the individual size distribution of titles. 125 Mbytes is the most common file size and the mean value is about 121 Mbytes. In general, file sizes were several orders of magnitude larger than vid-eos on the web.
3.2 Duration
Since no separate record exists about the duration of the titles, we determined the length of each by hand. This involved fast forwarding each title to its end via the mMOD VCR and noting the time elapsed. Some of the titles did not have accurate embedded timestamps and we ignored those for this analysis. Figure 3 displays the duration distri-butions of all the remaining titles. The distridistri-butions varied widely - from 10 minutes to over two hours. 90-100 min-utes proved to be the most popular time range, most probably because this was the average length of a class lecture. The mean duration was approximately 75 minutes. Once again, the duration of these movies were much larger than those reported by the study of videos on the web.
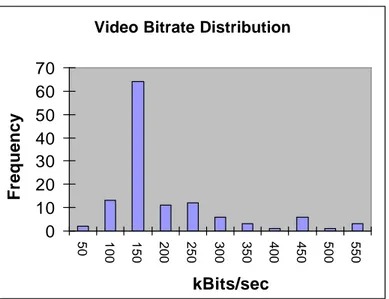
3.3 Bitrate Distribution
To obtain the mean bitrate for each movie, we divided the size by its duration. Figure 4 plots the resulting bitrate dis-tribution. The majority of the files exhibited bitrates between 150-250 kBits/sec, much lower than expected. This was because the video quality of each transmission was deliberately kept low [13] in order to save bandwidth for county viewers outside the campus with low bandwidth network access. Additionally, H.261, the video compression scheme used for the bulk of these streams, is mainly designed to produce low bitrates.
4. Trace Access Analysis
The trace that we analyzed was derived from the logs of the mMOD video web server. These logs recorded accesses to mMOD files from 29th of August, 1997 to 10th March, 1998 - little more than six months. Our first step, the removal of excess and erroneous requests from this raw data, is reported in section 4.1. We divide our subsequent investigation of the refined data into two broad parts:
Figure 1: Video access structure on the mMOD system
others
sm.luth.se
cdt.luth.se
campus.luth.se
luth.se
Video
server
• General: How do video requests vary by day (4.2)? Do accesses to movie titles follow any specific mathematical distributions (4.3)? Do some machines request more often than others (4.4)?
• Pattern Detection: Are there any patterns in inter-access times of user requests (4.5)? Do users view titles all the way through or do they stop beforehand (4.6)? Do accesses vary depending on the type of file (4.7)? Do requests exhibit any degree of temporal locality (4.8)?
Video Server File Size Distribution
0 5 10 15 20 25 30 35 40 25 50 75 100 125 150 175 200 225 250 275 300 325
Movie Size (in Mbytes)
Number of Movies
Figure 2: Video Server File Size distribution
0 5 10 15 20 25 30 10 20 30 40 50 60 70 80 90 100 110 120 130
Movie Length (minutes)
Number of movies
4.1 Initial Log Filtering
The requests logged by the mMOD web server can be classified as follows:
1. Starting a video playback session: the user requests the setup of the appropriate video transmission environment (a multicast/unicast group) for a certain file. Playback starts from the beginning of the file7 by default - however the VCR applet can be used to fast-forward or rewind as necessary.
2. Stopping a session: the web server halts transmission and removes the multicast/unicast group dedicated for the transmission of this file.
3. Joining a session already in progress: the user joins the multicast group devoted for the transmission of this title. 4. Obtaining HTML documents.
5. Retrieving images.
Of these, we eliminated types 3-5 from the initial logs. We ignored session joins (type 3) as, in practice, users rarely used this facility. The remaining two event types (4, 5) were irrelevant to our study. The distilled log consisted of the following entries:
<timestamp> <machine-name> <command> <title>
<timestamp> was the time, in seconds, when the request was made. <machine-name> indicated the originating machine. <command> was either GET or STOP, depending on whether the user wanted to commence or halt a video playback session. Finally, <title> gave the name of the movie desired. A sample log is shown below:
02:01:33 salt.cdt.luth.se GET Movie1
02:03:23 spock.cdt.luth.se GET TVSerial_970206 03:04:12 aniara.cdt.luth.se GET Movie2
03:10:11 aniara.cdt.luth.se STOP Movie2
After this initial cleanup, we performed further filtering on the simplified trace, including:
1. Eliminate all requests from a particular machine which had been used for demo purposes and hence would have had unusual access patterns.
2. Remove dangling STOPs caused by the user hitting the STOP button too many times.
Video Bitrate Distribution
0
10
20
30
40
50
60
70
50 100 150 200 250 300 350 400 450 500 550kBits/sec
Frequency
3. Some machines in the trace were only identified by their IP addresses. We replaced the IP addresses by their symbolic names.
4. Ignore consecutive GET requests from the same machine for the same movie if they are within 20 seconds of each other. For example, in the case of:
02:01:01 aniara.cdt.luth.se GET Movie3 02:01:15 aniara.cdt.luth.se GET Movie3
the time difference between two requests is 14 seconds, hence the first request is ignored. The assumption is that there were problems in getting the first request to run and that is why the user started another request for the same movie. For time gaps more than 20 seconds, we assumed that the user genuinely wanted multiple streams of the same movie possibly because the same machine had multiple users or the user was editing this particular title. If, on the other hand, the first request had a corresponding STOP like the following:
02:01:01 aniara.cdt.luth.se GET Movie3 02:01:10 aniara.cdt.luth.se STOP Movie3 02:01:15 aniara.cdt.luth.se GET Movie3
then both requests were acceptable since the user had deliberately stopped the first request.
Steps 1 and 4 eliminated about 300 playback requests leaving 5249 accesses overall. We carried out our subse-quent analyses on this trace.
4.2 Video Access Grouped By Day
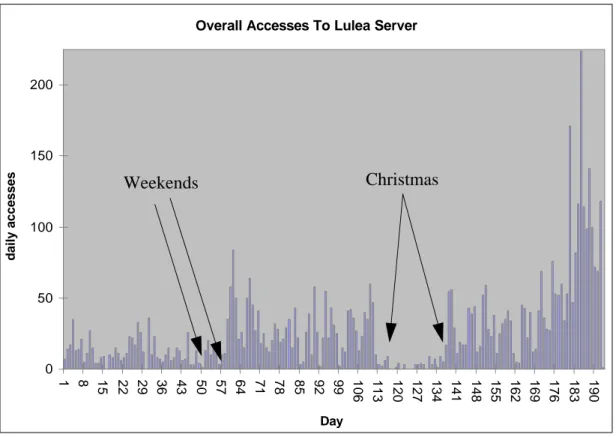
Figure 5 plots six months worth of server access grouped in 24 hour periods. It shows a cyclic pattern of access that, with the exception of days 119-130, gradually increased with time. We found that accesses dropped off during week-ends and rose again during the weekdays. Days 119-130 coincided with Christmas vacation when activity was
mini-Overall Accesses To Lulea Server
0 50 100 150 200 1 8 15 22 29 36 43 50 57 64 71 78 85 92 99 106 113 120 127 134 141 148 155 162 169 176 183 190 Day daily accesses
Figure 5: Accesses To Video Server Grouped By Day
Christmas
Weekends
mal. Finally, the number of accesses increased significantly post Christmas. This was due to more widespread deployment and usage of the mMOD system during the new semester, especially after the initial bugs had been ironed out.
4.3 Video Accesses To Movie Titles
Previous research on WWW traces [6] have shown that accesses to web documents tend to follow a Zipf distribution. Zipf’s law [16], as applied to web access, states that given a collection of documents at a web server and a history of access to them, the frequency of access of a document (P) is related to its rank in popularity (p) by:
P ~ 1/(p1-t) where t = 0.27 (EQ 1)
This particular version of Zipf’s law is based on a study of popularity followed by video store rentals [5]. Equa-tion 1 implies if video accesses follow the Zipf pattern, then a logarithmic plot of video title ranking vs. their total number of accesses should show a straight line. Figure 6 indicates this is not the case. Instead, accesses to videos are even more biased towards popular titles than a Zipfian distribution - for example, the top ten percent ranked titles accounted for about 50% of all the accesses.
4.4 Video Accesses By Machine
The bulk of the machine accesses (67.4%) were local (i.e., originated from the campus). Most of these local accesses (63.5%) came from three subnets: cdt.luth.se (16.0% of total accesses), sm.luth.se (30.1%) and campus.luth.se (30.8%). Investigating further, we found that a small number of machines accounted for most of the video requests, thus indicating high spatial locality. For example, the top ten percent of the most active machines accounted for about 59% of the total requests and the top twenty percent generated about 74%.
4.5 Inter-access Arrival Times Distribution
In an attempt to detect any patterns in request arrival times, we plotted the distribution of inter-access times of the entire request series. This is shown in figure 7. We found the median inter-arrival time to be 411 seconds. With the exception of the observation that time between requests tend to be on the order of minutes, no other clear indications
Popularity Ranking 1 10 100 1000 1 10 100 1000 rank of movie # of accesses
emerged from this plot. 4.6 Partial Accesses
Not all of the playback sessions in the trace went all the way to completion. Assuming that a GET request without a Inter-Acess Time 0 200 400 600 800 1000 100 300 500 700 900 1100 1300 1500 1700 1900 2100 2300 2500 Seconds Number of accesses 0% 10% 20% 30% 40% 50% 60% 70% 80% 90%
Figure 7: Inter-arrival Time Distribution
Percentage of Mov ie Seen
0 200 400 600 800 1000 1200 5 10 15 20 25 30 35 40 45 50 55 60 65 70 75 Percentage Number 0% 10% 20% 30% 40% 50% 60% 70% 80% 90% 100%
F ig u re 9 : D if fe re n ce s in A cc es s P at te rn s B et w ee n t h e T w o C at eg o ri es
matching STOP meant the user viewed that title all the way through, we found that about 55% of all requests played the entire duration. Figure 8 summarizes the degree of movie playback (before stoppage) for the remaining 45% requests as percentage of movie duration. Most stoppages occurred during the first 5% of the movie playback period. 4.7 Access Patterns Vs. Type of Title
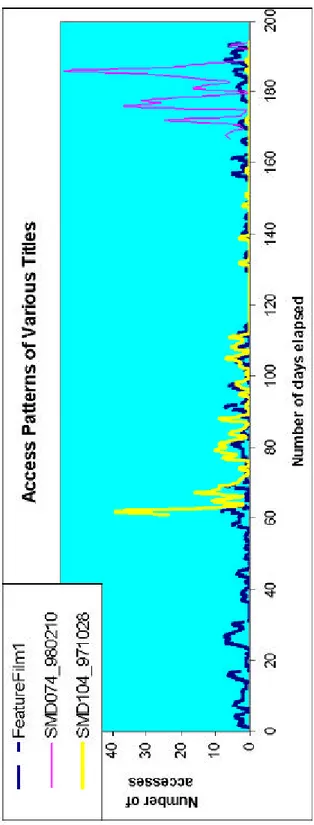
The titles hosted by the mMOD server fell into two categories -- general and educational. The former type involved sort of entertainment or movie. The latter category included recordings of course-lectures, meetings and seminars. A total of seven titles (5% of the total number of titles) were available in the general section. Overall, general titles accounted for 12.3% of the total number of accesses. Table 1 breaks down the types of videos accessed in the three subtraces.
Additionally, we found that accesses to general titles tended to be evenly distributed with time, whereas educa-tional clips exhibited very high accesses over a smaller period. For instance, the popularity of material associated with a particular course would be likely to rise on the eve of homework assignments and prelims but die down shortly thereafter. Figure 9 provides some examples of this trend. Acesses to “FeatureFilm1” are spread out over the entire time period covered by the trace. In contrast, accesses to “SMD074_980210” and “SMD104_971028,” the former being a recording of a single lecture from a Distributed Multimedia course and the latter, an Object Oriented Pro-gramming lecture, show considerable variation over a relatively short period of time.
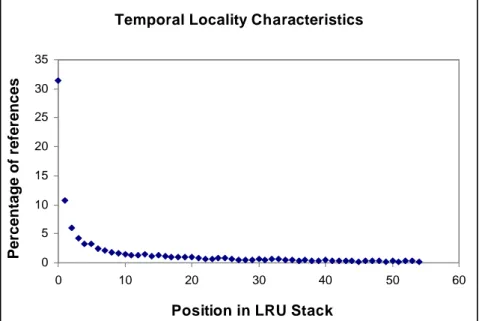
4.8 Temporal Locality Analysis
Temporal locality refers to the notion of the same document being re-referenced frequently within short intervals. We used the standard LRU (Least Recently Used) depth analysis [3] of the trace to measure locality. In LRU stack-depth analysis, when a title is initially referenced, it is placed on top of the LRU stack (i.e. position 0), pushing other documents down the stack by one location. When the document is subsequently referenced, its current location in the stack is recorded, and the document is moved back to the top of the stack, pushing other documents down as neces-sary. After the entire log has been processed in this fashion, temporal locality is indicated if the top few positions in
Table 1: Percentage of Accesses Accounted By General Titles
cdt campus sm
14.8% 14.0% 8.2%
Temporal Locality Characteristics
0 5 10 15 20 25 30 35 0 10 20 30 40 50 60
Position in LRU Stack
Percentage of references
the stack account for the bulk of the cumulative references. Figure 10 shows the analysis results. The top few posi-tions in the stack account for a majority of overall references, thus indicating that the data does indeed display high temporal behavior.
5. Related Work
In the absence of any prior surveys of video access over the web, closest related work can be classified into roughly two types: examination of Web traffic and video access analysis for video on demand systems. Web traffic investiga-tions can deal with requests either emanating from a cluster of clients or directly at the server itself. Mogul [11] and Kwan [9] have investigated access patterns at specific servers. In addition to analyzing the underlying systems and network behavior of the server under study, they also examined incoming HTTP requests by looking at their interar-rival times, variations with time, size and type of files desired, and requesting domain type. The same core criteria (plus some others) were used by Arlitt [4] to extract underlying patterns from a number of server traces. Cunha et al [6] performed client side traffic work. They instrumented browsers at clusters of workstations to collect individual user access traces, which they then collated and analyzed. In all of these studies, videos accounted for a very small percentage (less than 1%) of overall requests. However, since the traffic data in these studies were all collected during 1994 and 1995 when the web presence of videos was insignificant, they do not present an accurate picture of current video activity.
Most recent video on demand models rely on results reported in two studies: Chervenak [5] and Dan, Sitaram and Shahabuddin [7]. These analyses examined statistics in magazines for video rentals and reports from video store own-ers. Both studies concluded that the popularity distribution of video titles could be fitted to a Zipfian distribution.
6. Conclusion
From the analysis of file characteristics, we found that content creators utilized low video bitrates when recording titles to disk. This allowed the capture of events with long durations such as classroom lectures and feature films at manageable, though still very large, file sizes. It also ensured that the bandwidth usage of the titles would be small during playback sessions, a useful feature for users accessing the system from outside the campus network. On the other hand, our trace analysis showed that viewers often accessed movies only partially. This observation, coupled with the high temporal locality present in the trace, indicates a type of video browsing pattern whereby a user might click on a title and let it run for a couple of minutes. If interested, the user lets it run to the end or he/she might stop the title, start it again from the beginning and then let it run to conclusion. If not interested, the user simply stops the playback session. Additionally, we discovered that the category of the movie also affected the type of reference pat-tern. Access to general titles tended to be even over a long period of time, whereas educational title accesses were more bursty over a shorter time period. Finally, our trace analysis exhibited a high degree of temporal locality, indi-cating that a cache based approach to improving video access performance could yield rich dividends. We incorpo-rated our findings into the design of MiddleMan, a video caching web proxy system. Initial evaluations [2] show our architecture to be promising.
In the future, we aim to repeat our analysis methodology on traces from other VOW servers as well as logs from the mMOD server over a longer time period in order to verify our current findings and discover new patterns.
References
[1] S. Acharya, B. Smith, An Experiment To Characterize Videos On The World Wide Web, Proceedings of ACM/SPIE
Multi-media Computing and Networking 1998 (MMCN'98), San Jose, January 1998.
[2] S. Acharya, B. Smith, MiddleMan: A Video Caching Proxy Server, submitted for publication, May 1999. <URL: http://
www.cs.cornell.edu/home/soam/papers/drafts/middleman.pdf>
[3] V. Almeida et al, Characterizing Reference Locality in the WWW, Technical Report TR-96-11, Department of Computer
Science, Boston University, 1996
[4] M. Arlitt, C. Williamson, Web Server Workload Characterization: The Search for Invariants, ACM SIGMETRICS 96-5,
Philadelphia, PA, USA, 1996
[5] A. L. Chervenak, Tertiary Storage: An Evaluation of New Applications, Ph. D. Thesis, University of California at
[6] C.R. Cunha, A. Bestavros, M. E. Crovella, Characteristics of WWW Client Based Traces, Technical Report TR-95-010, Computer Science Department, Boston University, July 1995.
[7] A. Dan, D. Sitaram, P. Shahabuddin, Scheduling Policies for an On-Demand Video Server with Batching, Second Annual
ACM Multimedia Conference and Exposition, San Francisco, CA, 1994.
[8] H. Eriksson, Mbone: The Multicast Backbone, Communications of the ACM, Vol 8, pp 54-60, 1994.
[9] T. T. Kwan, R. E. McGrath, D. A. Reed, User Access Patterns to NCSA's World Wide Web Server, CS Tech Report
UIUCDCS-R-95-1934, University of Illinois at Urbana-Champaign, February 1995.
[10] S. McCanne, V. Jacobson, vic: a Flexible Framework For Packet Video, Proceedings of ACM Multimedia ‘95, Nov 1995.
[11] J. C. Mogul, Network Behavior of a Busy Web Server and its Clients, DEC WRL Research Report 95/5, October 1995.
[12] Peter Parnes, The CDT mStar Environment: Distributed Collaborative Teamwork using IP Multicast, Licentiate Thesis,
Luleâ University of Technology, October 1997.
[13] P. Parnes , K. Synnes, D. Schefstrom, The CDT mStar Environment: Distributed Collaborative Teamwork in Action, Third
IT-conference in the Barit region, September 16-17, 1997, Luleå, Sweden.
[14] Video Codec for audiovisual services at p*64 kbps, 1993, ITU-T Recommendation H.261.
[15] A. Wolman et al, Organization-Based Analysis of Web-Object Sharing and Caching, USITS 1999, January 1999.
[16] G. Zipf, Human Behaviour and the Principle of Least Effort, Addison-Wesley, 1949.
[17] http://cdt.luth.se/
[18] http://mmod.cdt.luth.se/