201 Stuart W. Styles
Daniel J. Howes3 ABSTRACT
In 1999 Sutter Mutual Water Company (SMWC) and Cal Poly ITRC began work together with the USBR on a project effort to install a VFD unit and a SCADA system into the Portuguese Bend Pumping Plant, one of SMWC’s four pumping plants that convey water from the Sacramento River onto 46,746 acres of farmland in the Sutter County sub-basin. The project was formulated and implemented in order to reduce the high amount of power consumed by the existing 30-year-old equipment, to minimize maintenance and labor costs, and to improve control of the in-stream flows to achieve more efficient use of limited water supplies.
After commissioning the equipment, a number of operational problems were encountered. These were resolved once their causes were clearly identified and adequately addressed. Work completed included installing an adequate cooling system for the VFD unit and replacing an air-release valve in place of an outdated siphon breaker that continually adversely affected water flow. Benefits realized from the new technology have included a reduction in power use, cost of labor and maintenance, and a dramatic improvement in the district’s ability to control in-stream water flow through the automatic control of motor and pump
performance.
INTRODUCTION
Sutter-Mutual Water Company (SMWC), a farmer-owned, non-profit water company, decided in 1998 to begin modernizing its irrigation facilities in an attempt to reduce its increasing operation and maintenance costs while conserving water and power resources. The original paper on this effort, a 1999-2001 status report on what has become an ongoing modernization effort, was presented at the July 9-12, 2002 USCID conference on Energy, Climate, Environment and Water - Issues and Opportunities for Irrigation and Drainage in San Luis Obispo, CA.
1 Operations Manager, Sutter Mutual Water Company (SMWC), P.O. Box 128,
Robbins, CA 95676; ffschantz@aol.com
2 Director, Irrigation Training and Research Center (ITRC), California
Polytechnic State University (Cal Poly), San Luis Obispo, CA, 93407; sstyles@calpoly.edu
This paper is a 2005 update of the effort, and presents the reduction in operation and maintenance costs due to the performance of the VFD/SCADA unit.
The on-going effort has been continued due to a coordinated effort between company personnel and professional engineers from the Irrigation Training and Research Center (ITRC), California Polytechnic State University (Cal Poly), in San Luis Obispo, California; Concepts in Controls in Visalia, California; and Wilson Pumps in Woodland, California. This modernization project was partially funded by the United States Bureau of Reclamation (USBR), Mid-Pacific Region, Northern Area Office, through a Field Services Program Grant and technical support agreement with ITRC.
The effort encompassed a project within the company’s service area, located within the boundaries of California’s largest reclamation district, Reclamation District 1500. The project included the automation of the pumping plant at Portuguese Bend with a new Variable Frequency Drive (VFD) pump and a Supervisory Control and Data Acquisition (SCADA) system, completed in 2001. The anticipated and ultimately realized benefits of the modernization effort included a savings to the company due to a reduction in the amount of water diverted, power consumed, and number of personnel required to operate and maintain its system.
BACKGROUND
For over 80 years SMWC has operated and maintained its irrigation facilities, initially using mostly vintage technology that has proven to be very reliable. In the 1960-1970s, three new pumping stations were built and more efficient turbine pumps were installed to help reduce power consumption and to increase water diversion efficiency. For economic and operational reasons, it was decided in 1999 to begin installing additional technology in some of the plants in order to take advantage of the substantial savings offered by such technology.
Agricultural Energy Use for Irrigation Water in California
In 2003 the Irrigation Training and Research Center completed an analysis of agricultural energy use for irrigation water in California for the California Energy Commission (CEC). The results of this analysis were published in a report titled “California Agricultural Water Electrical Energy Requirements” (ITRC, 2003). Results from this study showed the bulk of the energy used for agricultural water is from on-farm groundwater pumping and on-farm booster pumping. Irrigation district (water district, water company, etc.) surface water pumping was a relatively small portion of the overall energy requirement during an average precipitation year. However, ITRC has determined that proper investment in
surface water supply infrastructure, specifically at the irrigation district/water company level, has a significant impact on current and future energy demands. Improved district delivery flexibility will allow the following:
• Drip and microspray irrigators will be able to use surface water instead of groundwater. Historically, groundwater pumping was used to supply water requirements above what could be met by surface water supplies. In general, surface water supplied approximately two-thirds of statewide water demand and groundwater was used to supply the remaining one-third. Irrigation districts were designed to provide high flow rates to water users relatively infrequently (every 7-14 days), which is appropriate for most types of gravity irrigation methods. Drip and microspray require lower flow rates more frequently.
• Water users using pressurized systems will be able to utilize off-peak
pumping, reducing electricity costs. District infrastructure improvements such as the addition of automated gates that maintain water levels regardless of flow rate, VFDs, and re-regulating reservoirs coupled with SCADA, can improve the districts’ surface water delivery flexibility and reduce on-farm pumping demand.
Drip and microspray irrigated acreage has increased from approximately 1.6 million acres in 1978 to over 4.2 million acres today and there is no indication of slow-up. As the drip and microspray acreage doubles, ITRC estimates that the total agriculture water energy demand will increase by over 20% under current conditions. District improvements such as those discussed in this paper are key to reduction.
Description of Sutter Mutual Water Company (SMWC)
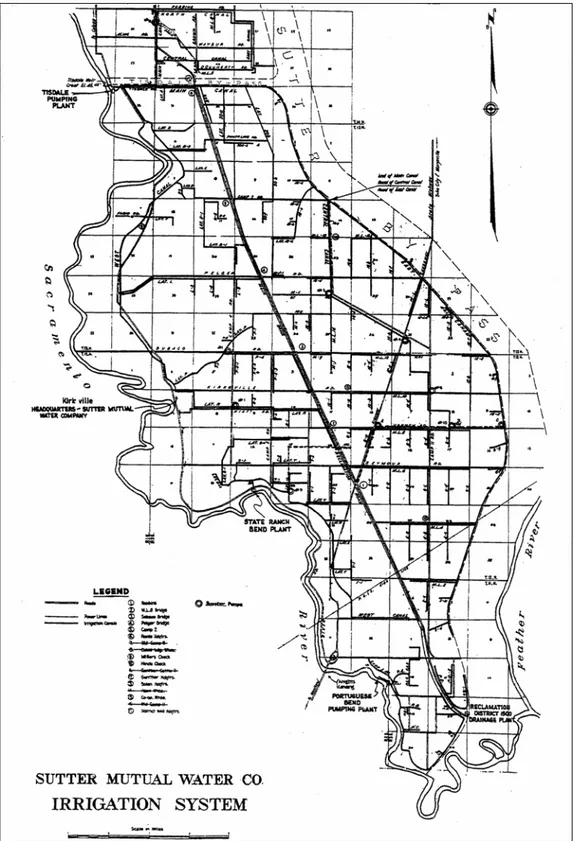
Formed in 1919, SMWC was one of the first water companies to be established in the state of California. The company’s physical location (Figure 1) is
approximately 45 miles northwest of Sacramento, California and is bordered in the north by the Tisdale Bypass, in the west by the Sacramento River, and in the east by the Sutter Bypass. The southern boundary is located at the southern end of Sutter County near the Fremont Weir where the Sacramento River and Feather River join. The company’s 46,746 irrigable acres (18,917 ha), which are part of the 67,850 (27,470 ha) gross service area that is maintained by Reclamation District 1500 flood control and drainage personnel, are served by approximately 400 turnouts. Approximately 200 miles (322 km) of canals and laterals in the distribution system convey water to the fields.
INSTALLING A VFD UNIT AND SCADA SYSTEM AT THE PORTURGUESE BEND PUMPING PLANT
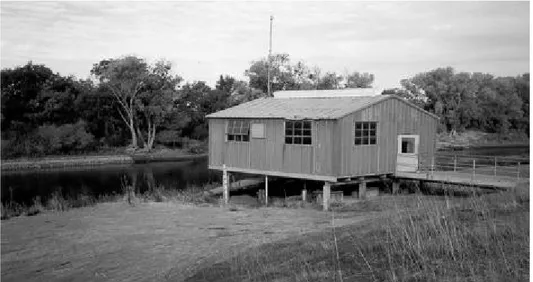
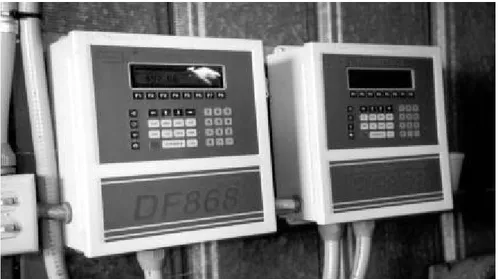
In early 1999 the company decided to proceed with the installation of a Variable Frequency Drive (VFD) unit and a Supervisory Control and Data Acquisition (SCADA) system at the Portuguese Bend pumping plant (Figure 2). ITRC staff explained the technology and detailed the work to be done, the equipment to be used, and the cost and benefits of the project. The VFD, in a manual mode, was successfully installed by the end of the year after three unique problems, critical to the successful operation of the new technology, were identified, evaluated and resolved. The solutions included (1) an adequate radio signal between the office and field site, (2) proper siphon breaker operation, and (3) adequate cooling of the VFD unit.
Figure 2. Portuguese Bend Pumping Plant on the Sacramento River.
The Variable Frequency Drive (VFD) Unit
Constant-speed AC motors drive many pumps used for water distribution and delivery at the district or grower level. When flow control is needed to accommodate changes in downstream demand, two methods are typically
employed to control the flow rate and pressure: (1) a downstream throttling valve is used to alter the system curve, and (2) some of the output is by-passed back into the intake.
With these two methods, a considerable amount of energy can be wasted doing unnecessary work just to achieve the desired flow rate. VFD units provide an effective way of reducing the speed of the pump drive motor, thereby allowing the flow rate or pressure to be adjusted to the desired level without the additional energy from throttling or by-passing. Basically, the VFD is an electronic device that is used in conjunction with a constant-speed AC motor. The VFD accepts the
standard line voltage and frequency, and then converts the signal into a variable frequency and voltage output that allows the standard constant-speed AC motor to be varied in speed.
Advantages of a VFD: VFDs provide the potential for system automation of pumping plants such as Portuguese Bend. Water level sensors can be used as feedback into the controller to continuously adjust the VFD speed for varying downstream conditions. In general, this allows water deliveries to be provided to growers on-demand. In return, growers are able to schedule irrigations to match crop water requirements rather than district limitations. This type of VFD
operation also offers the potential for labor savings over manual adjustment. The further advantages of VFD systems include the following:
• Softer starting. The device limits the current inrush to the motor, providing for a smooth, non-shocking acceleration of the pump shaft speed up to its operational RPM.
• Elimination of pressure surge. Bringing the system up to operating speed slowly removes the pressure surge caused by an almost instantaneous acceleration of the water to its operational flow rate.
• Reduction of operating costs. Reducing the energy input over previous control methods (by-pass) can reduce operating costs.
• Reduction of mechanical stress on motor windings.
• Reduction of peak demand charges. By reducing the energy loads, the overall peak demand of the facility can be reduced.
Disadvantages of a VFD: There are important issues to consider when VFD devices are being used:
• Increased motor stress. Electrical stress increases due to the steep voltage wave that forms in the power supplied by the inverter. Newer VFDs that include “soft switching output technology” can significantly reduce motor stress and interference from harmonics. However, older motors with inferior insulation may have problems. Typically, the motor should be dipped and baked twice.
• Increased maintenance. While VFD units are very reliable, they are still an additional item requiring maintenance. In critical applications, it is essential to have spare parts and maintenance expertise or to retain the ability to by-pass.
• Harmonics. With the increasing number of control systems going on-line, the line interference produced by some VFD units can cause problems. • Environmental conditions. Most units require relatively dust-free
enclosures with some type of temperature control. Most of the pumping VFD applications can utilize a simple water-to-air radiator type cooling system (simple and effective).
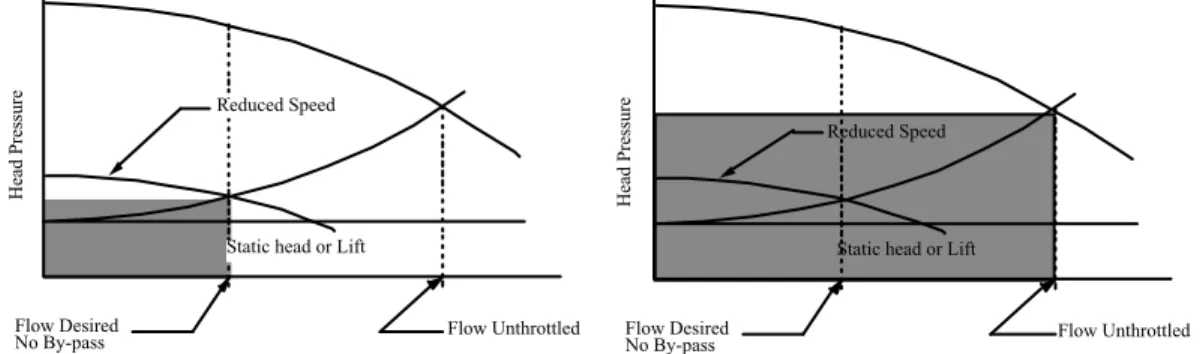
Energy Savings: VFD units usually reduce pumping costs by reducing the pump drive motor speed to match the desired operating conditions, thereby reducing energy input. Without a VFD device this is typically accomplished by using either a by-pass set-up or a downstream throttling valve. The system layout for a typical by-pass installation consists of a pump and by-pass piped into a standtank. With this arrangement, the by-pass maintains a constant head in the standtank regardless of flow, as there is less downstream demand. The excess flow is by-passed to the pump intake to maintain a constant head in the standtank or canal. Determining how a pump will operate in a given situation requires an
understanding of the pump and system curve. The pump characteristic curve for a standard centrifugal pump shows that the pump, at a fixed speed, has a flow rate associated with a particular pressure; high flow, lower pressure vs. low flow, higher pressure. The intersection of the pump curve and the system curve shows the point of system operation.
If, instead, the pump speed is modified using a VFD device to control head just below the by-pass, flow and head are reduced together along the system curve. A comparison of the relative pump water horsepower with (i) VFD, and (ii) by-pass installations are shown by the shaded areas in Figure 3.
Head Pressure
Flow Desired
No By-pass Flow Unthrottled Static head or Lift
Reduced Speed
Head Pressure
Flow Desired
No By-pass Flow Unthrottled Static head or Lift
Reduced Speed
Figure 3. Water horsepower (shaded area) for pumping plant with (i) VFD and (ii) by-pass.
However, the water horsepower differences above are only some of several factors to consider. To properly compare the actual cost savings of a VFD system, the overall pumping plant efficiencies with and without the VFD device also need to be considered. The major additional losses that must also be considered in determining the overall pumping plant efficiency are as follows:
• As the system curve changes or the pump speed is reduced, the operating efficiency of the pump changes. Therefore, for each operating point the pump efficiency must be checked.
• VFD units have some losses associated with the conversion process to the new operating frequencies. In general, the units are relatively efficient at 95%. However, as the frequency is lowered, some units do become less
efficient. The individual specifications should be obtained for the VFD being considered.
• Electric motors, if sized properly near maximum loading, can be very efficient. With VFD units used in pumping, the motor loading is reduced as the speed is reduced. This reduction in motor loading can reduce its efficiency and drive motor losses will result.
• Drive friction losses can be reduced with VFD applications. As the speed is reduced, the mechanical friction on drive shaft components is reduced. In addition to the items above, it is important to consider the relative volume pumped each season. Small pumping volumes generally produce small savings and do not justify VFD installations.
Cost Savings Analysis: To determine the total savings due to the VFD unit, a detailed cost savings analysis was started on the VFD installation on pump #1 (100 hp motor) at the Portuguese Bend pumping plant. Initial savings have already been realized, with the reduction of one employee who had been needed to constantly monitor and reset the plant’s three pumps as dictated by flow requirements out of the plant’s main canal. The main costs, now under evaluation, involve two other components: (1) energy savings as a result of eliminating the by-pass practice (before meter) to control delivery flow, and (2) reduction of spilled water out of the canal, which reduces metered pumping of a purchased volume, plus the additional energy savings associated with the reduction in pumped volume. Neither portion of the savings analysis takes into consideration the specific time of use rates; both are based on the total monthly values. The reduction in canal spill and the associated energy savings are only achievable with the new SCADA system.
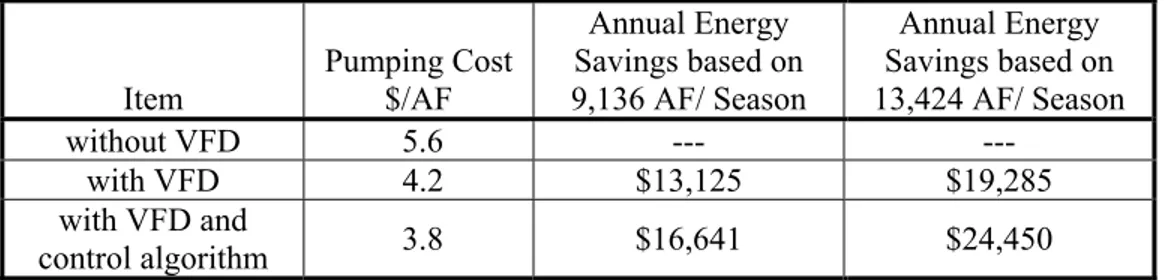
Table 1 shows the actual energy savings at Portuguese Bend after the VFD was installed and after the control algorithm was added to the controller. The cost savings analysis is based on an estimate of the average pumping costs before and after the installation of a VFD unit.
Table 1. Actual energy savings – pre-VFD compared to post-VFD installation with 1996-2004 actual average and maximum volume of water pumped.
Item Pumping Cost $/AF Annual Energy Savings based on 9,136 AF/ Season Annual Energy Savings based on 13,424 AF/ Season without VFD 5.6 --- --- with VFD 4.2 $13,125 $19,285 with VFD and control algorithm 3.8 $16,641 $24,450 In addition, the actual average pumping cost with a VFD using a control
the new SCADA system. Note that the average cost to pump a single acre-foot (AF) of water has increased from $0.08/kWh to $0.11/kWh since the original analysis was completed. It should also be noted that the 1996-2004 average and maximum volume of water pumped (9,136 AF and 13,424 AF) was significantly higher than the ballpark estimates used in the original analysis (6,000 AF and 8,000 AF).
Table 2 shows the anticipated annual savings of approximately $2,000 to the company on Portuguese Bend’s main canal due to the reduction in spilled water along the canal. The data from Table 1, combined with the estimated savings shown in Table 2, indicates an average annual savings of over $18,000 per year, which will increase even more in the future as energy costs continue to increase.
Table 2. Average annual savings anticipated from a reduction in Portuguese Bend canal spill with the new VFD and SCADA system.
Description Amount Approximate annual spill at end of canal (acre-feet) 200
Possible reduction in spill with VFD (acre-feet) 120 Water value as missed opportunity to sell ($/acre-feet) $12.00 Possible revenue from missed sales annually ($) $1,440 Approximate pumping cost $/acre-feet (from pump test data) $4.18 Energy savings from reduced pumped volume ($) $502 Total Anticipated Canal Spill Savings $1,942
Table 3 shows the pumping volume and electricity billing data from 1996 through 2004. The key values to note are the energy requirements to pump a single acre-foot (AF) of water, shown as kWh/AF. After the VFD with control algorithm was installed, the average kWh/AF dropped approximately 25%.
Table 3. Actual energy savings data comparing pre-VFD, VFD, and post-VFD with control algorithm.
Pre-VFD
1996 1997 1998 1999 Average
Plant Meter Volumes (AF) 9,683 6,863 4,314 6,441 6,825
Plant Meter readings (kWh) 412,480 342,400 256,160 334,300 336,335
(kWh/AF) 42.6 49.9 59.4 51.9 50.9
Total Electric Bill ($) 34,813 29,153 21,837 26,070 27,968
Post-VFD
2000 2001 Average
Plant Meter Volumes (AF) 11,512 8,555 10,034
Plant Meter readings (kWh) 439,120 321,840 380,480
(kWh/AF) 38.1 37.6 37.9
Total Electric Bill ($) 33,474 29,868 31,671
Average Electricity Cost ($/kWh) 0.08 0.09 0.08
Post-VFD & Algorithm
2002 2003 2004 Average
Plant Meter Volumes (AF) 10,978 10,457 13,424 11,620
Plant Meter readings (kWh) 390,560 345,760 463,280 399,867
(kWh/AF) 35.6 33.1 34.5 34.4
Total Electric Bill ($) 48,498 41,011 44,417 44,642
Average Electricity Cost ($/kWh) 0.12 0.12 0.10 0.11
The SCADA System
Overview: The basic objective of the automation at Portuguese Bend was to vary the pump flow rates from the pumping plant in order to maintain a target water level in the canal. This required the integration of a VFD unit at the pumping plant and a new SCADA system. Specifically, this involved the ability to remotely monitor the system (water levels, flow rates, pumps on/off, etc.), manually control operations from SMWC’s administration office, and to eventually automatically control the system using the new VFD unit. This required the integration of data acquisition components (sensors for water level, electronic flow meters, etc.) with computerized controllers for implementing supervised commands. Monitoring and controlling operations at a remote site such as Portuguese Bend further required a two-way communications network between the remote office location and the control site. Such a system is often referred to as a Supervisory Control and Data Acquisition (SCADA) system. SCADA is a tool that allows irrigation companies or districts to acquire real-time information and control operations at remote sites from a central location, usually in the main office or at an operations center. By having this real-time information available at the office, the system can also be managed on a real-time basis, thereby providing the ability to achieve maximum water conservation and operational flexibility.
In the water industry, earlier SCADA systems installed were one-of-a-kind systems custom-designed for a specific job. As a result, these systems were not industrially hardened in most cases. Their relatively short-term design efforts did not address all of the day-to-day conditions the components would be subjected
to. Consequently, system reliability was low. In addition, the communication protocols were all unique within these proprietary systems; therefore, no
interchangeability between components and different vendors was possible. The overall communication systems used also added to the unreliability of early SCADA systems. The older systems typically used lower frequency voice radios for data transmission and were prone to many outside disturbances.
Current SCADA systems are now being designed under a term called “open architecture”. This new approach uses off-the-shelf, industrially hardened components, which can be linked together using common communication protocols. One such protocol currently adopted by the industry is Modbus. The current system’s configuration assembles individual components, called Remote Terminal Units (RTU’s), to control or monitor each site independently. These standard components are then configured (programmed) for the specific task. The site RTU information is then linked back to the central location via radio
communication. The open architecture and industrially hardened components have allowed increased scalability and reliability.
Radio communication for SCADA systems has also improved. Equipment and FCC regulations have allowed the operation frequencies to increase, thereby improving reliability. One notable advance in radio communication has been the FCC approval of a technology known as Spread Spectrum radio. This is an unlicensed 900 Mhz frequency ‘hopping’ technique that provides reliable
communication within about a 15-mile range. The range can be extended with a repeater configuration.
Project Phases: Due to the complex nature of installing a SCADA system into an irrigated area, successful implementation is best accomplished in phases.
Initiating change in the routine operation of key facilities and altering the day-to-day activities of company or district personnel can create significant uncertainty. It is therefore necessary to address this uncertainty during each step of the process and gradually build up a level of confidence in the participants. Achieving this critical “buy-in” from the people who will actually use the system is essential for the success of modernization projects. This phased approach has important benefits, including maximizing reliability while allowing an irrigation company or district to prioritize critical modernization needs and implement components on a site-by-site basis. Styles et al. (1999) further describes phased approached advantages based on experience in modernization projects in irrigation districts. The Project Phases used for installing a SCADA system for SMWC are:
• Phase 1 (Completed in April 2001). The first phase of the SCADA part of the project was to install, test and calibrate a new water level sensor in the head of the main canal at Portuguese Bend. The new sensor located in a stilled area at the start of the canal was connected to the RTU/PLC at the Portuguese Bend
pumping plant. The new sensor installation was set up so that water levels in the canal were measured once per second and transmitted via radio to the RTU/PLC, where the levels were stored in a data table and averaged over a one-minute time interval. Upon completion of this task, the Lookout® screens at the district office included information on the canal water levels at two locations, the river stage, the status of each pump (on/off and speed) and target depth (water level setpoint). In addition, the Lookout® screens were configured so that the target depth could be remotely changed from the office (for future automatic control) and so that up to 15 coefficients used for the distributed automatic control could be remotely changed from the office. However, the ability to change these coefficients were “hidden” so that only authorized personnel could change the values.
• Phase 2 (Completed in June 2001). This was the first step toward automating the site, although nothing was actually automated at this stage. The VFD pump was tested on-site in manual mode with occasional remote manual operation, in which the operator sets the motor speed control using the percent speed control located in the pumping plant. This phase facilitated testing of new communications equipment, sensors, VFD controls, connection to the office computer, a new air/vacuum relief valve, etc.
• Phase 3 (Completed in October 2001). This was the second step toward automating the site. There was a continuation of the remote manual mode of operation, but it was expanded to include a new flow meter. Rather than using only water levels as feedback, the operators now had information on specific flow rates at the pumping plant. A new electronic flow measurement device (Panametrics acoustic meter) was installed on one of the three pumping units and the flow rate was available to the operator. The digital display screens for the new Panametrics meters are shown in Figure 4. This did not mean that operators were expected to make hourly changes from the remote office location. This step required at least two months of operational testing that extended into the peak irrigation season.
Figure 4. Digital display screens for new Panametrics flow meters inside the Portuguese Bend pumping plant.
• Phase 4 (Completed in December 2001). This was the third and final step of automating the Portuguese Bend pumping plant. A Proportional-Integral-Filtered (PIF) algorithm for control of the site was programmed into the RTU/PLC and implemented. The control algorithm was a PIF algorithm supplied by ITRC and not the internal Proportional-Integral (PI) equation supplied by the VFD’s manufacturer.
The Lookout® screens in the office necessary to support this automation were already in place. The ladder logic and additional site programming were completed during this stage. At this time the effect of fluctuations in the Sacramento River level was factored in and added to the ladder logic
programming, allowing the minimum VFD speed to shift with the river level. The Lookout® screens were modified to allow a person in the remote office location to shift the pumps to automatic or manual control. In the case of remote manual control, this meant the ability to control the speed of the VFD and the number of pumps operating from the office. This final step allowed for the fullest possible (or desirable) automation of the site.
CanalCAD Modeling: During the modernization effort, ITRC completed several unsteady flow hydraulic simulations on the first pool of the Portuguese Bend canal to determine the optimum control scheme for the new VFD unit. The algorithm uses PIF control logic based on water depth measurements 1,800 feet downstream of the Portuguese Bend pumping plant. The algorithm controls that water depth using the VFD and single stage pumps in the pumping plant.
The following is the control logic with optimized algorithm parameters: VFD pump speed change: DS =1.3 * Round (DQ, 3)
Required flow rate change: DQ=35.315*[KP*(FE1-FE2)+(KI*FE1)] with: FE1 =fc*FE2+(1-fc)*ENOW
FE2 = FE1 of previous step. KP = -6.50
KI = - 0.18 fc = 0.84
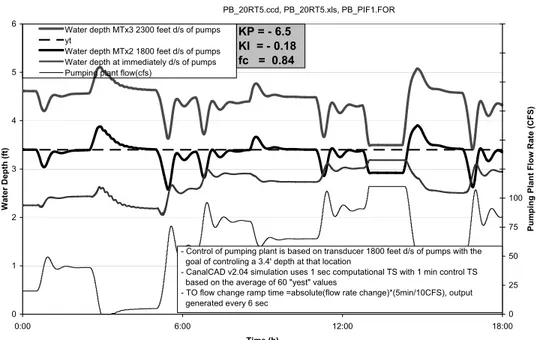
Simulation Results: Figure 5 summarizes the best modeling results and algorithm for controlling the water depth about three-quarters of the way downstream from the Portuguese Bend canal. The graph demonstrates satisfactory water level control with frequent flow rate changes over a relatively short period of time using the ITRC-selected control algorithm. The target water level to maintain is 3.44 ft and the control location is 1,800 ft downstream of the pumping plant. This is the location of two transducers for measuring water depth5.
Sutter Mutual Water Co. Portugese Bend Pumping Plant (CC STN 1+00)
0 1 2 3 4 5 6 0:00 6:00 12:00 18:00 Time (h) W ate r De pth (ft) 0 25 50 75 100 125 150 175 200 225 250 Pum p ing Pla n t Flow Ra te (CFS)
Water depth MTx3 2300 feet d/s of pumps yt
Water depth MTx2 1800 feet d/s of pumps Water depth at immediately d/s of pumps Pumping plant flow(cfs)
PB_20RT5.ccd, PB_20RT5.xls, PB_PIF1.FOR
KP = - 6.5 KI = - 0.18 fc = 0.84
- Control of pumping plant is based on transducer 1800 feet d/s of pumps with the goal of controling a 3.4' depth at that location
- CanalCAD v2.04 simulation uses 1 sec computational TS with 1 min control TS based on the average of 60 "yest" values
- TO flow change ramp time =absolute(flow rate change)*(5min/10CFS), output generated every 6 sec
Figure 5. Water level control results when turnout flow changes occur at a rate of 5 minutes for every 10 cfs change.
4 The target water level was later changed to 5.6 ft after the canal was de-silted
and the sensor height adjusted.
5 A redundant measurement (Y2) is used to check the integrity of the (Y1)
The control action occurs once a minute based on the average of at least
60 measurements of water depth. The graph presents the control results for nine simulated end-of-canal turnout flow changes that range from 5 to 110 cfs and that occur over an 18-hour period. The turnout flow changes occurred based on five minutes per every 10 cfs change in flow.
The graph shows the following information:
• Water depth immediately downstream of the pumping plant, • Water depth at 1,800 ft downstream of the pumping plant, • Water depth at 2,300 ft (end of the pool), and
• Pumping plant flow rate
Documented VFD Response: The documented response of the Portuguese Bend pumping plant from field tests conducted in December 2001 is shown in Figure 6. During the final evaluation, the demand flow was varied with multiple flow rate changes to test the response time, stability and robustness of the VFD and
SCADA systems. The flow changes were made manually by the operator adding or removing weir boards and opening or closing the gate at the check structure located at the downstream end of the first pool of the Portuguese Bend canal.
VFD Documented Response and CanalCAD Results Sutter-Mutual Water Company, Portuguese Bend
December 11, 2001 3.5 4.0 4.5 5.0 5.5 6.0 6.5 7.0 7.5 7:45 8:00 8:15 8:30 8:45 9:00 9:15 9:30 9:45 10:00 10:15 10:30 10:45 Time Wa ter Dept h, f t 0 10 20 30 40 50 60 70 80
VFD Pump, % Flow Rate, cfs
Actual water depth 1800 feet d/s of pump, ft Predicted water depth 1800 feet d/s of pump, ft Water level target = 5.6 ft
Approximate demand flow rate, cfs VFD pump speed, %
Demand flow changed from 20 cfs to 4 cfs at 9:05 Predicted water level
from CanalCAD
Actual water level
Figure 6. Documented VFD response, water level control results and predicted water depth with an 80% change in demand flow.
SUMMARY
The modernization effort at SMWC continues. SMWC intends to install a SCADA system in its two Tisdale pumping plants during the construction of a 300-foot long positive barrier fish screen begun in July 2005 and scheduled for completion in 2007. Savings resulting from the installation of the VFD and
SCADA system at the Portuguese Bend pumping plant have shown important benefits to the water company and reclamation district as a whole, especially in the area of conserved water and reduced energy costs.
REFERENCES
Schantz, F.F., S.W. Styles, C.M. Burt, D. Stevens, and B.J. Freeman. 2002. Modernizing Irrigation Facilities at Sutter Mutual Water Company: A Case Study. Presented at the USCID Conference on Energy, Climate, Environment and Water - Issues and Opportunities for Irrigation and Drainage. July 9-12, 2002. San Luis Obispo, California.(http:www.ffschantz@aol.com).
Irrigation Training and Research Center. 2003. California Agricultural Water Electrical Energy Requirements. ITRC Report No. R 03-006, Available at (http://www.itrc.org/reports/energyreq/energyreq.htm).
Styles, S.W., C.M. Burt, M. Lehmkuhl, and J. Sweigard. 1999. Case Study: Modernization of the Patterson Irrigation District. Presented at the USCID Workshop on Modernization of Irrigation Water Delivery Systems. Oct. 17-21, 1999. Phoenix, Arizona.