Technical Bulletin
TB13-02
Ag
ricultural
Experiment Station
College of Agricultural Sciences Department of Soil and Crop
Sciences Department of Bioag Sciences and Pest Management USDA-ARS-NRRC
Sustainable Dryland
2013
SUSTAINABLE DRYLAND AGROECOSYSTEMS MANAGEMENT
1N.C. Hansen
2, L.Sherrod
5, G.A. Peterson
3, D.G. Westfall
3, F.B. Peairs
4, D. Poss
9, T. Shaver
6K. Larson
7, D.L. Thompson
6, and L.R. Ahuja
8A Cooperative Project
of the
Colorado Agricultural Experiment Station
Department of Soil and Crop Sciences
Department of Bioagricultural Sciences and Pest Management
Colorado State University
Fort Collins, Colorado
and the
USDA - ARS
Natural Resources Research Center
Great Plains Systems Research Unit
Fort Collins, Colorado
1
Funding is provided by the Colorado Agricultural Experiment Station and USDA-ARS.
2
Associate Professor, Department of Soil and Crop Sciences, Colorado State University, Fort
Collins, CO 80523
3
Professor Emeritus, Department of Soil and Crop Sciences, Colorado State University, Fort
Collins, CO 80523
4
Professor, Department of Bioagricultural Sciences and Pest Management, Colorado State
University, Fort Collins, CO 80523
5
USDA-ARS Soil Scientist–Agricultural Systems Research Unit, Fort Collins
6
Research Associate, Colorado State University
7
Research Scientist, Plainsman Research Center at Walsh, Colorado
8
USDA-ARS Research Leader - Great Plains Systems Research Unit
9
Former Research Associate, Colorado State University, presently Support Scientist,
USDA-ARS Central Great Plains Research Station
**Mention of a trademark or proprietary product does not constitute endorsement by the Colorado Agricultural Experiment Station** Colorado State University is an equal opportunity/affirmative action institution and complies with all Federal and Colorado State laws, regulations, and executive orders regarding affirmative action requirements in all programs. The Office of Equal Opportunity is located in 101 Student Services. In order to assist Colorado State University in meeting its affirmative action responsibilities, ethnic minorities, women, and other protected class members are encouraged to apply and to so identify themselves.
Contents
Subject
Pages
Project History
1-2
Introduction
3
Materials and Methods
3-10
Section A - Dryland Cropping Systems Production – 2008
Results and Discussion
Climate
11
Wheat
11
Corn and Sorghum
11
Proso millet
12
Nitrogen Content of Grain and Stover
12-13
Soil Moisture
13
Section B - Dryland Cropping Systems Production – 2009
Results and Discussion
Climate
13
Wheat
13-14
Corn and Sorghum
14
Forage millet & Proso millet
14
Nitrogen Content of Grain and Stover
14
Residual Soil Nitrate
14-15
Soil Moisture
15
Crop Residue
15
References
15
Data Tables Section A- 2008
16-43
Data Tables Section B - 2009
44-72
Appendix A - Annual Herbicide Programs for Each Site
73-84
Table Title
Page
Table 1. Elevation, long-term average annual precipitation, and evaporation characteristics for each site.
4
Table 2a. Cropping systems for each of the original sites in 2007-2008 and 2008-2009 cropping year.
16
Table 2b. Opportunity cropping history from 1985 to 2008 at the three original sites.
17
Table 3.Nitrogen fertilizer application by soil and crop for 2008.
18
Table 4. Monthly precipitation for the original sites for the 2007-2008 growing season.
19
Table 5a. Precipitation by growing season segments for the Sterling site from 1987-2008.
20
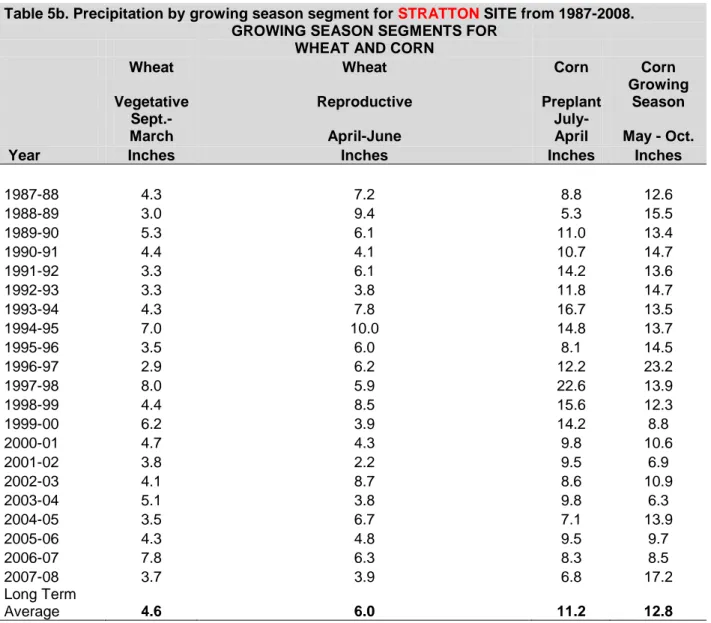
Table 5b. Precipitation by growing season segment for the Stratton site from 1987 -2008.
21
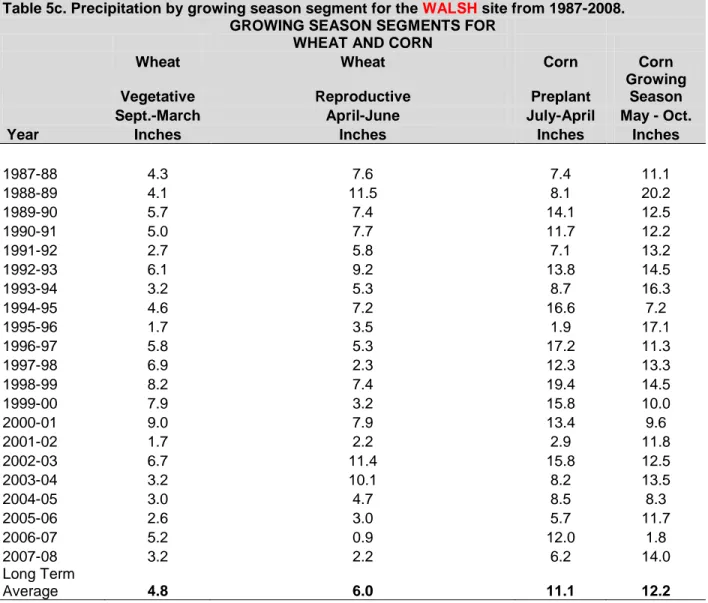
Table 5c. Precipitation by growing season segment for the Walsh site from 1987-2008.
22
Table 6. Crop variety, seeding rate, and planting date for each site in 2007-2008.
23
Table 7. Grain and stover (straw) yields for wheat at Sterling, Stratton, and Walsh in 2008.
24
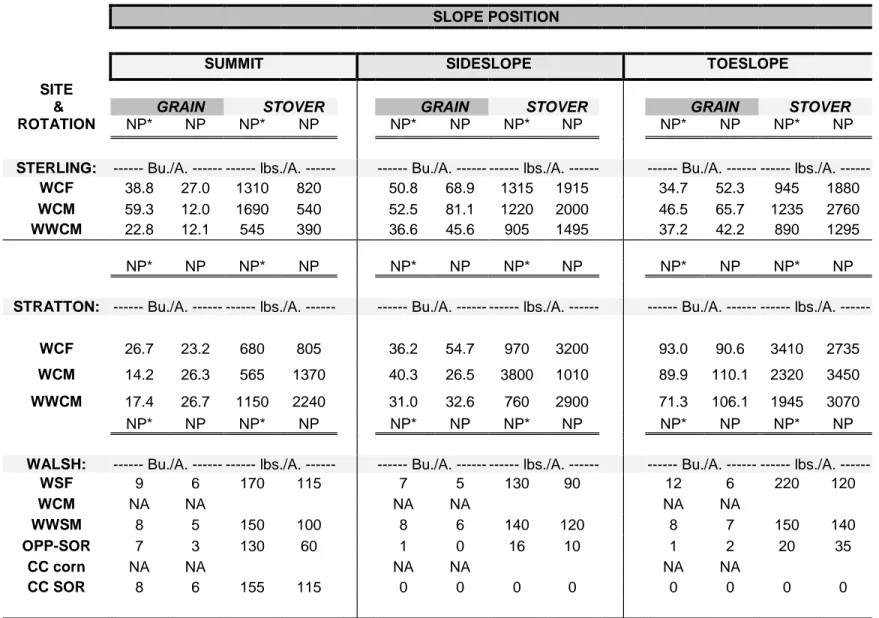
Table 8. Grain and stover yields for corn and sorghum at Sterling, Stratton, and Walsh in 2008.
25
Table 9. Grain and stover yields for millet at Sterling, Stratton and Walsh in 2008.
26
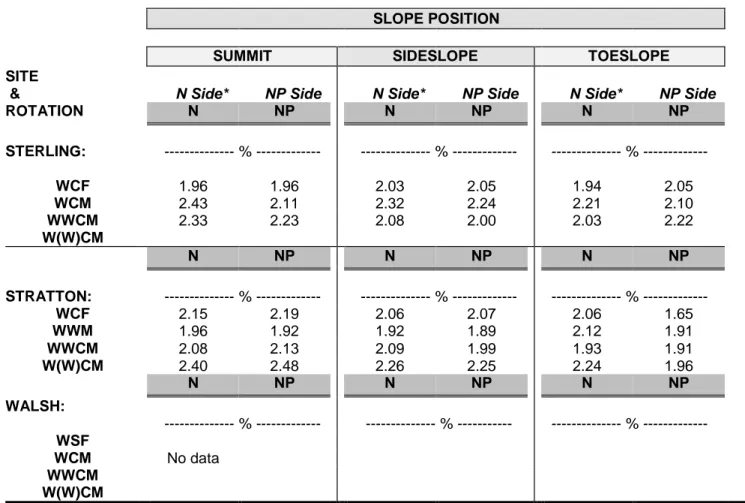
Table 10. Total nitrogen content of wheat grain at Sterling, Stratton, and Walsh in 2008.
27
Table 11. Total nitrogen content of wheat straw at Sterling, Stratton, and Walsh in 2008.
28
Table 12. Total nitrogen content of corn or sorghum grain at Sterling, Stratton, and Walsh in 2008.
29
Table 13. Total nitrogen content of corn or sorghum stover at Sterling, Stratton, and Walsh in 2008.
30
Table 14. Total nitrogen content of millet grain at Sterling, Stratton, and Walsh in 2008.
31
Table 15. Total nitrogen content of millet stover at Sterling, Stratton, and Walsh in 2008.
32
Table 16. Available soil water by soil depth of the WHEAT phase in the WCM rotation at Sterling,
Stratton, and Walsh in 2008.
33
Table 17. Available soil water by soil depth of the WHEAT phase in the WCF rotation at Sterling and
Stratton, and the WSF rotation at Walsh in 2008.
34
Table 18. Available soil water by soil depth of the WHEAT 1 phase in the WWCM rotation at Sterling
and Stratton, and the WWSM rotation at Walsh in 2008.
35
Table 19. Available soil water by soil depth of the WHEAT 2 phase in the WWCM rotation at Sterling
and Stratton, and the WWSM rotation at Walsh in 2008.
36
Table 20. Available soil water by soil depth of the CORN phase in the WCM rotation at Sterling,
Stratton, and Walsh in 2008.
37
Table 21. Available soil water by soil depth of the CORN phase in the WCF rotation at Sterling and
Stratton, and the Sorghum phase of the WSF rotation at Walsh in 2008.
38
Table 22. Available soil water by soil depth of the CORN phase in the WWCM rotation at Sterling and
Stratton, and the Sorghum phase of the WWSM rotation at Walsh in 2008.
39
Table 23. Available soil water by soil depth of the MILLET phase in the WCM rotation at Sterling,
Stratton, and Walsh in 2008.
40
Table 24. Available soil water by soil depth of the MILLET phase in the WWCM rotation at Sterling,
Stratton, and Walsh in 2008.
41
Table 25. Available soil water by soil depth of the MILLET phase in the OPP rotation at Sterling,
Stratton and Walsh in 2008.
42
Table 26. Nitrate-N content of the soil profile at planting for each crop during the 2007-2008 crop year.
43
Table 27. Nitrogen fertilizer application by soil and crop for 2009.
44
Table 28. Crop variety, seeding rate, and planting date for each site in the 2008-2009 season.
45
Table 29. Monthly precipitation for the original sites for the 2008-2009 growing seasons.
46
Table 30a. Precipitation by growing season segments for Sterling from 1987-2009.
47
Table 30b. Precipitation by growing season segment for Stratton from 1987 -2009.
48
Table 30c. Precipitation by growing season segment for Walsh from 1987-2009
49
Table 31. Grain and straw yields for wheat at Sterling, Stratton, and Walsh in 2009.
50
Table 32. Grain and stover yields for corn/sorghum at Sterling, Stratton and Walsh in 2009.
51
Table 33. Grain and stover yields for millet at Sterling, Stratton, and forage sorghum at Walsh in 2009.
52
Table 34a.Total nitrogen content of wheat grain at Sterling, Stratton, and Walsh in the 2009 crop.
53
Table 34b. Total nitrogen content of wheat straw at Sterling, Stratton, and Walsh in the 2009 crop.
54
Table 35a.Total nitrogen content of corn and sorghum grain at Sterling, Stratton, and Walsh in the 2009
crop.
55
Table 35b. Total nitrogen content of corn and sorghum stover at Sterling, Stratton, and Walsh in the 2009
crop.
56
Table 36a. Total nitrogen content of millet grain at Sterling, Stratton, and Walsh in the 2009 crop.
57
Table 36b. Total nitrogen content of millet stover at Sterling and Stratton, and forage sorghum at Walsh
in the 2009 crop.
58
Table 37. Nitrate-N content of the soil profile at planting for each crop during 2008-2009 crop year.
59
Table 38. Available soil water by soil depth in the WHEAT phase of the WCF rotation at Sterling,
Stratton, and WSF at Walsh in 2009.
60
Table 39. Available soil water by soil depth in the WHEAT phase of the WCM rotation at Sterling,
Stratton, and WSF at Walsh in 2009.
61
Table 40. Available soil water by soil depth in the WHEAT 1 phase of the WWCM rotation at Sterling,
Stratton, and WWSM at Walsh in 2009.
62
Table 41.Available soil water by soil depth in the WHEAT 2 phase of the WWCM rotation at Sterling,
Stratton, and WWSM at Walsh in 2009.
63
Table 42. Available soil water by soil depth of the CORN phase in the WCM rotation at Sterling and
Stratton, and Sorghum in the WSM rotation at Walsh in 2009.
64
Table 43. Available soil water by soil depth of the CORN phase in the WCF rotation at Sterling and
Stratton, and the Sorghum in the WSF rotation at Walsh in 2009.
65
Table 44. Available soil water by soil depth of the CORN phase in the WWCM rotation at Sterling and
Stratton, and SORGHUM in the WWSM rotation at Walsh in 2009.
66
Table 45. Available soil water by soil depth of the CORN and SORGHUM in the CC rotation at Walsh in
2009.w
67
Table 46. Available soil water by soil depth of the MILLET phase in the WCM rotation at Sterling and
Stratton, and the WWSM rotation at Walsh in 2009.
68
Table 47. Available soil water by soil depth of the MILLET phase in the WCM rotation at Sterling and
Stratton, and the WWSM rotation at Walsh in 2009.
69
Table. 48. Crop residue weights at wheat planting in fall 2008.
70
Table. 49. Crop residue weights at corn and sorghum planting in 2009.
71
PROJECT HISTORY
The Dryland Agroecosystems Project was established in the fall of 1985 with the first
winter wheat and corn crops harvested in 1986. The long-term research objectives are to provide
producers with information that can be used to make management decisions under dryland
cropping conditions and to learn more about soil quality and carbon sequestration parameters as
impacted by intensive no-till dryland cropping systems in the semi-arid environment of the west
central Great Plains. Grain yields, stover yields, crop residue amounts, soil water measurements,
and crop N and P contents have been reported annually in previously published technical
bulletins. This bulletin covers the 2008 and 2009 research results. Common introduction and
materials and methods sections are presented for the two years, while the production parameters
mentioned above are presented by year, in two sections identified as Section A (2008) and
Section B (2009).
Results from past years have shown that cropping intensification, compared to traditional
stubble mulch tillage winter wheat-fallow, is feasible and profitable in this environment if
managed under no-till or minimum-till systems. The cropping systems evaluated from 1986 to
1998 included intensive rotations like winter corn(sorghum)-fallow and winter
wheat-corn(sorghum)-millet-fallow with traditional winter wheat-fallow as the standard of comparison.
The intense rotations of winter fallow and winter
wheat-corn(sorghum)-millet-fallow more than doubled grain water use efficiency relative to winter wheat-fallow. The
increased soil water storage resulting from adoption of no-till systems made cropping
intensification possible. The deletion of summer fallow, however, does increases the risk of water
deficit for the following crop. The traditional winter wheat-fallow system requires less
management skill and poses less risk relative to the intensive systems, but over time is less
profitable. Government programs also affect management decisions greatly, particularly where
producers have developed a good wheat or corn yield base.
Based on our findings with the intensive systems from 1985 to 1997 (12 cropping
seasons), we altered the systems in 1998 to reduce the amount of fallow in our cropping systems.
We now consider the 3-year (winter wheat-corn(sorghum)-fallow) system as the standard of
comparison. These changes will be outlined later in this report. Unfortunately, shortly after we
made these changes the region was hit with a drought. Some of the more intensive cropping
systems have not been successful during the drought. Winter wheat planted after wheat or millet
with no fallow period has had a high rate of crop failure and/or low yields due to lack of soil
moisture for seed germination and/or inadequate stored soil moisture.
Adoption of Intensive Cropping Systems:
Corn is one of the principal crops grown in the more intensive cropping systems; thus we can use
its acreage as an index of adoption rate by producers. Producers in northeastern Colorado
adopted more intensive cropping systems at an increasing rate from 1990 until 2002. The
drought of 2002 had a devastating effect on dryland crop yields. Colorado Agricultural Statistic
reported that there were only 55,000 acres of dryland corn harvested in 2002 (See table below),
but many thousands of additional acres were planted and not harvested. After 2002, the harvested
dryland corn acreage rebounded to 205,000 in 2003, and since then has averaged about 300,000
acres per year.
Dryland Corn Acreage in Eight Northeastern Colorado Counties and state total from 1971 to 2009.
Year Eight NE Counties* Total for State
Acres 1971-1988 21,200 23,700 1989 27,000 28,000 1990 26,000 26,000 1991 32,500 33,000 1992 48,500 50,000 1993 79,000 90,000 1994 92,500 100,000 1995 95,500 100,000 1996 104,000 110,000 1997 138,500 150,000 1998 191,000 240,000 1999 220,000 290,000 2000 198,000 340,000 2001 233,000 305,000 2002 50,000 55,000 2003 150,700 205,000 2004 183,700 325,000 2005 140,900 235,000 2006 164,500 235,000 2007 204,300 360,000 2008 238,500 350,000
2009 (Data not available) 290,000
*Data from CO Agric. Statistics (Adams, Kit Carson, Logan, Morgan, Phillips, Sedgewick, Washington, Yuma)
Since dryland corn is almost exclusively grown under no-till in a three or four year
rotation, we can estimate the total acreage under intensive dryland cropping systems from the
corn acreage statistics. Thus the state acreage of intensified dryland cropping systems is at least
INTRODUCTION
Colorado agriculture is highly dependent on precipitation from both snow and rainfall. In
the dryland environment each unit of precipitation is critical to production. At Akron each
additional inch (25 mm) of water above the initial yield threshold translates into 4.5 bu/A of
dryland winter wheat (12 kg/ha/mm), consequently profit is highly related to water conservation
(Greb et al., 1974). These data point to the need for maximum precipitation use efficiency in this
semi-arid cropping environment and the importance of this project to producers.
The dryland cropping systems research project was established in 1985 to identify
systems that maximize efficient water use under dryland conditions in Eastern Colorado. A
more comprehensive justification for its initiation can be found in Peterson, et al. (1988). A
summary of our general understanding of the climate-soil-cropping systems interactions can be
found in a recent publication by Peterson and Westfall (2004).
The general objective of the project is to identify no-till dryland crop and soil
management systems that will maximize water use efficiency of the total annual precipitation
and economic return.
Specific objectives are to:
1. Determine if cropping sequences with fewer and/or shorter summer fallow periods are
feasible.
2. Quantify the relationships among climate (precipitation and evaporative demand), soil
type, and cropping sequences that involve fewer and/or shorter fallow periods.
3. Quantify the effects of long-term use of no-till management systems on soil structural
stability, micro-organisms and faunal populations, and the organic C, N, and soil
test P content of the soil, all in conjunction with various crop sequences.
4. Identify cropping or management systems that will minimize soil erosion by crop
residue maintenance.
5. Develop a data base across climatic zones that will allow economic assessment of
entire management systems.
Peterson, et al. (1988) document details of the project in regard to the "start-up" period
and data from the 1986-87 crop year. Previous year’s results have been reported in CSU
Agricultural Experiment Station Technical Bulletins that are available at the following web site:
http://www.colostate.edu/Depts/aes/pubs_list.html
. Other publications related to this project
have been published by various graduate students, faculty, and postdoctoral students and are
listed in Appendix C.
MATERIALS AND METHODS
From 1986 -1997 we studied interactions of climate, soils and cropping systems at three
sites, located near Sterling, Stratton, and Walsh, in Eastern Colorado, that represent a gradient in
potential evapotranspiration (PET) (Fig. 1). Elevation, precipitation and evaporative demand are
shown in Table 1. All sites have long-term precipitation averages of approximately 14-17 inches
(400-450 mm), but increase in PET from north to south. Growing season open pan evaporation is
used as an index of PET.
Table 1. Elevation, long-term average annual precipitation-, and evaporation characteristics
for each site.
Site
Elevation
Annual
Precipitation
1Growing Season Open Pan Evaporation2
Deficit (Precip. - Evap.)
--Ft. (m) -- ---In. (mm) --- ---In. (mm) --- In. (mm)
Briggsdale 4850 (1478) 13.7 (350) 61 (1550) - 48 (- 1220) Sterling 4400 (1341) 17.4 (440) 63 (1600) - 45 (- 1140) Akron 4540 (1384) 16.0 (405) 63 (1600) - 47 (- 1185) Stratton 4380 (1335) 16.3 (415) 68 (1725) - 52 (- 1290) Lamar 3640 (1110) 14.7 (375) 76 (1925) - 62 (- 1555) Walsh 3720 (1134) 15.5 (395) 78 (1975) - 61 (- 1555) 1
Annual precipitation = 1961-1990 mean;
2Growing season = March - October
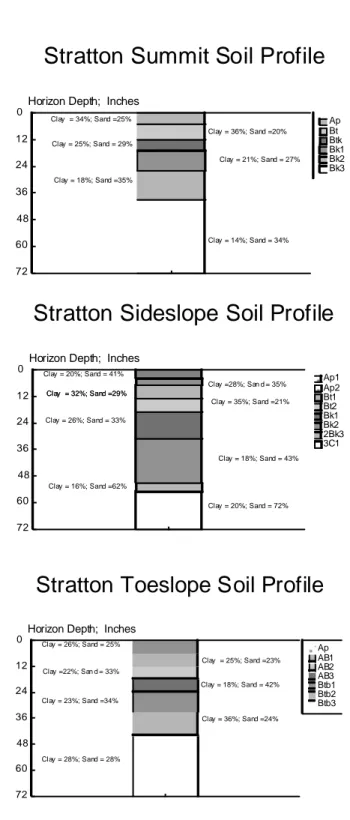
Each of the original three sites (Sterling, Stratton, and Walsh) was selected to represent a
catenary sequence of soils common to the geographic area. Textural profiles for each soil at each
location are shown in Figures 2a, 2b, and 2c. There are dramatic differences in soils across slope
position at a given site and from site to site. Each profile was described by NRCS personnel in
the summer of 1991. Note first how the summit soils at the three sites differ in texture and
horizonation. The surface horizons of these three soils (Ap) present a range of textures from loam
at Sterling, to silt loam at Stratton, to sandy loam at Walsh. Obviously the water holding
capacities and infiltration rates differ. An examination of the horizons below the surface reveals
even more striking differences.
Figure 2a. Soil profile textural characteristics for soils at the Sterling site.
Sterling Summit Soil Profile
Horizon Depth; Inches
Ap Bt1 Bt2 Bt3 Bk1 Bk2 2Bk3 2Bk4 Clay = 21%; Sand= 45% Clay = 31%; Sand =33% Clay = 27%; Sand = 27% Clay = 22%; Sand =30% 0 12 24 36 48 60 72 Clay = 21%; Sand =43% Clay = 32%; Sand = 45% Clay = 23%; Sand =37% Clay = 38%; Sand=24% Partially cemented with lime
Sterling Sidelope Soil Profile
Horizon Depth; Inches
Ap1 Ap2 Bt Btk Bk1 2Bk2 2Bk3 2Bk4 Clay = 21% ; Sand= 54% Clay = 26% ; Sand =44% Clay = 28% ; Sand = 27% Clay = 22% ; Sand =36% 0 12 24 36 48 60 Clay = 9%; Sand =67% Clay = 3%; Sand = 79% Clay = 2%; Sand =86% Clay = 31% ; Sand=32%
Sterling Toeslope Soil Profile
Horizon Depth; Inches
Ap1 Ap2 Bt1 Bt2 Bk1 Bk2 2Bk3 2Bk4 Clay = 18%; Sand= 42% Clay = 20%; Sand =47% Clay = 25%; Sand = 40% Clay = 27%; Sand =30% 0 12 24 36 48 60 72 Clay = 20%; Sand =38% Clay = 14%; Sand = 59% Clay = 10%; Sand =76% Clay = 24%; Sand=46%
Figure 2b. Soil profile textural characteristics for soils at the Stratton site.
Stratton Sideslope Soil Profile
Horizon Depth; Inches
Ap1 Ap2 Bt1 Bt2 Bk1 Bk2 2Bk3 3C1 Clay = 32%; Sand =29% Clay = 35%; Sand =21% Clay = 26%; Sand = 33% Clay = 16%; Sand =62% 0 12 24 36 48 60 72 Clay = 18%; Sand = 43% Clay = 20%; Sand = 72% Clay = 32%; Sand =29% Clay =28%; San d = 35% Clay = 20%; Sand = 41%
Stratton Toeslope Soil Profile
Horizon Depth; Inches
Ap AB1 AB2 AB3 Btb1 Btb2 Btb3 Clay = 23%; Sand =34% Clay = 18%; Sand = 42% Clay = 36%; Sand =24% 0 12 24 36 48 60 72 Clay = 28%; Sand = 28% Clay = 25%; Sand =23% Clay =22%; San d = 33% Clay = 26%; Sand = 25%
Stratton Summit Soil Profile
Horizon Depth; Inches
Ap Bt Btk Bk1 Bk2 Bk3 Clay = 34%; Sand =25% Clay = 36%; Sand =20% Clay = 25%; Sand = 29% Clay = 18%; Sand =35% 0 12 24 36 48 60 72 Clay = 21%; Sand = 27% Clay = 14%; Sand = 34%
Walsh Summit Soil Profile
Horizon Depth; Inches
Ap Bk1 Bk2 Bk3 Bk4 Btkb Clay = 14%; Sand =65% Clay = 18%; Sand =66% Clay = 17%; Sand = 68% Clay = 21%; Sand =56% 0 12 24 36 48 60 72 Clay =19%; Sand = 61% Clay = 40%; Sand = 6%
Walsh Sideslope Soil Profile
Horizon Depth; Inches
Ap BAk Btk Btkb1 Btkb2 Bkb1 Bkb2 Clay = 10%; Sand =72% Clay = 26%; Sand =30% Clay = 38%; Sand = 13% Clay = 36%; Sand =7% 0 12 24 36 48 60 72 Clay =37%; Sand = 10% Clay = 33%; Sand = 12% Clay = 20%; Sand = 57%
Walsh Toeslope Soil Profile
Horizon Depth; Inches
Ap AB Btb1 Btb2 Btbk Bkb1 Bkb2 Bkb3 Clay = 24%; Sand =38% Clay = 30%; Sand =30% Clay = 29%; Sand = 30% Clay = 32%; Sand =23% 0 12 24 36 48 60 Clay =31%; Sand = 28% Clay = 30%; Sand = 42% Clay = 26%; Sand = 32%
Cropping Systems/Management
The cropping systems that were in place in 2008 and 2009 at Sterling, Stratton and Walsh
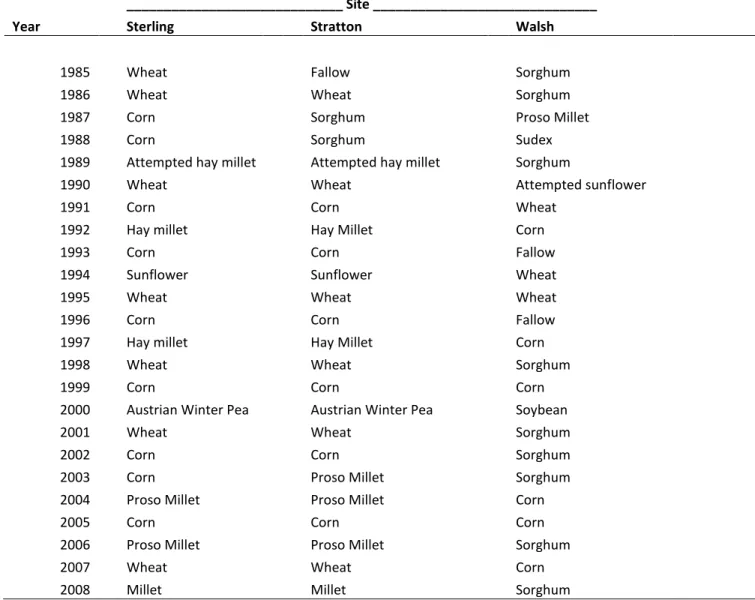
are shown in Table 2a. The “opportunity cropping system” has the goal of producing a crop
every year without summer fallow, and the “opportunity” crops grown from initiation to 2008
are listed in Table 2b. The cultivars planted, planting rates, dates and harvest information for
each site are reported in Table 6 for 2008 and Table 28 for 2009.
Nitrogen fertilizer is applied annually in accordance with the residual NO
3-N content of
the soil profile (0-6 ft), soil organic matter content (0-6 in) before planting, and expected yield on
each soil position at each site. Therefore, N rate changes by year, crop grown, and soil position,
if needed. The N rates at Sterling, Stratton, and Walsh for 2008 are given in Table 3 and for
2009 in Table 27. Nitrogen fertilizer for wheat, corn, and sunflower was dribbled on the soil
surface over the row at planting time at Sterling and Stratton. Zinc (0.9 lb/A) was applied to the
corn with the P fertilizer. Nitrogen on wheat at Walsh was topdressed in the spring, and N was
sidedressed on corn and sorghum. The N source was 32-0-0 solution of urea-ammonium nitrate.
Phosphorus management is one of the experimental variables. Phosphorus fertilizer
(10-34-0) is applied at planting near the seed for all crops. Phosphorus is applied on one-half of each
corn and proso millet plot over all soils, but applied to the entire wheat plot when a particular
rotation is in wheat. The rate of P is determined by the lowest soil test on the catena, which is
usually found on the sideslope position. This rate has been 20 lbs P
2O
5/A (9.5 kg/ha of P) at
each site each year thus far. We changed the P fertilization treatment for wheat in fall 1992, so
that the half plot that had never received P fertilizer in previous years receives P in the wheat
phase of the rotation. This was required because low P availability was resulting in poor wheat
stand establishment and low yields. Other crops in the rotation only receive P on the half plot
designated as NP. Zinc (0.9 lbs/A) is banded near the seed at corn planting at Sterling and
Stratton to correct a soil Zn deficiency.
Yields, Nitrogen, and Available Soil Moisture
Grain yields were determined using a small plot research combine. The center section of
each treatment was harvested on each slope position. At maturity, meter row samples of each
crop were collected and processed to determine stover (straw) to grain ratio. The stover (straw)
and grain were processed and analyzed for total N using a combustion N analyzer.
Soil moisture measurements were taken at planting and harvest of each crop for each
treatment and slope positions using the neutron-scatter technique. This timing also represents the
beginning and end of non-crop fallow periods. Galvanized metal conduit was used for neutron
probe access tubes and were installed, two per soil position, in each treatment at the Sterling,
Stratton and Walsh sites. The access tubes were installed at the initiation of this study in 1987
and have not been moved since original installation. Available soil water and change over the
growing season was calculated based upon the available soil water holding capacity for each
treatment, depth and slope position.
SECTION A
2008 Results & Discussion
Climatic Data
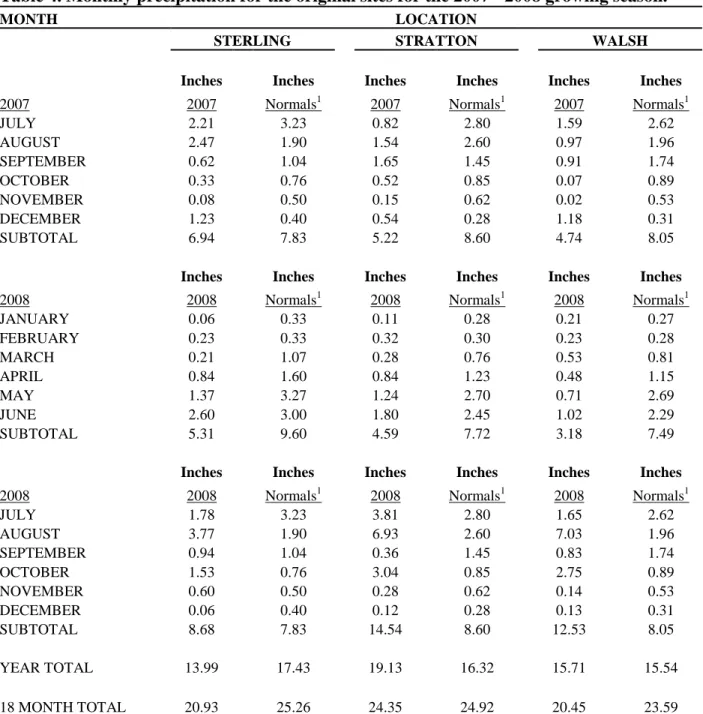
Precipitation is the most limiting variable in dryland agriculture in Eastern Colorado.
The precipitation received during the last six months of a given year greatly influences crop yield
potential for the following crop year, especially spring planted crops. For the last half of 2007
Sterling received 6.9 in of precipitation, which is near the normal, but the Stratton and Walsh
sites only received about 60% of the normal (Table 4).
Precipitation in the first six months of 2008 was well below the long-term normal
amounts at all three sites. Sterling and Stratton received less than 60% of the normal, and Walsh
only received about 40% of the normal. Based on these precipitation observations, yield
potential for both fall-planted and spring-planted crops would be expected to be adversely
affected at all sites.
Precipitation in the last six months of 2008 exceeded the normal amounts at all three
sites: Sterling by 11%, Stratton by 65%, and Walsh by 55% (Table 4). These conditions provide
excellent potential for the following winter wheat crop. In addition, late season rainfall, if stored
in the soil, provides a good starting point for spring crops the following year.
An overall view of the 18 month period precipitation that affected 2008 yield potentials
indicated that the Sterling, Stratton, and Walsh sites were about 80, 115, and 85% of the normal
for the period, respectively (Table 4).
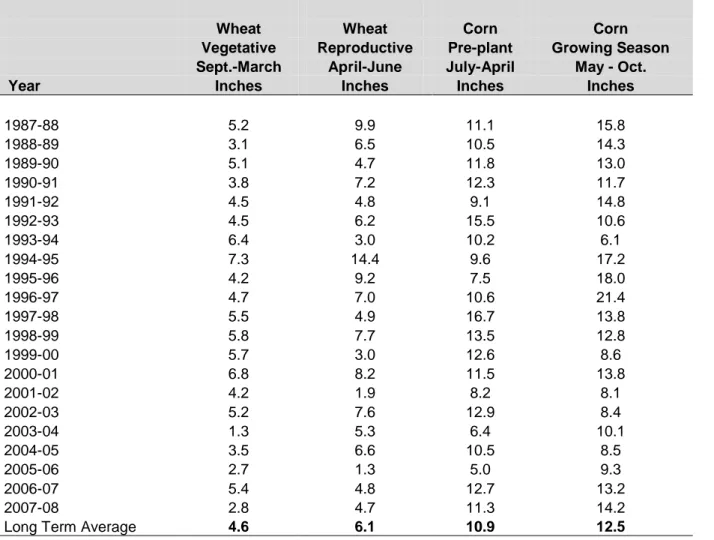
Precipitation received during the vegetative production stage (Sept-Mar) and the
reproductive stage for corn and wheat from 1987-2008 are shown in Tables 5a-c for Sterling,
Stratton, and Walsh. We will refer to these data more extensively in the crop yield discussion
section of the bulletin.
Wheat Production
Winter wheat yields at the Sterling and Walsh sites (Table 7) were below average (site
average yields less than 27 bu/A at Sterling and less than 3 bu/A at Walsh) below average fall
precipitation (Table 4) and below normal rainfall during the reproductive period (Tables 5a and
5c). Wheat yields at Stratton after summer fallow (WCF rotation) were near the long-term
expected yields, averaging 42 bu/A across soil positions. The higher yields at Stratton were
related to more soil water content at planting (Table 17). Below average precipitation during the
reproductive period at Stratton probably decreased the yields relative to the potential given the
good water content at planting.
Wheat yields following fallow in the WCF and WSF systems were the highest at all sites,
as would be expected, because of the greater opportunity to store soil water. All of the more
intensely cropped systems had substantially lower wheat yields than wheat following fallow.
This was to be expected given the poor soil water conditions at wheat planting and the low
rainfall in late 2007.
amounts (Nielsen et al. 1996), and according to the data in Table 4 it would seem that Sterling
corn yields should have been higher. However, June precipitation at all sites was below normal,
and thus the corn and sorghum plants may have been too drought stressed to recover.
Corn yields on the sideslope soil position at Sterling and Stratton tended to be higher on
the side receiving P fertilizer. This is not usually the case because usually there is enough P
carryover on all slope positions from the previous wheat crop to satisfy the corn crop’s needs.
Soil test P levels on the toeslope positions are in the high category and no response is expected in
any year. The lack of corn yield response on the summit positions probably indicates that the
carryover from the wheat P fertilization was adequate for the corn.
Corn yield and sorghum yields were not affected by rotation, which is as expected
because in all cases these crops follow a wheat crop and thus have the same soil moisture regime.
Proso Millet Production
The proso millet yields at Sterling were about average for this site and above average for
the Stratton site, except at the summit soil position where yields were much below the expected
levels. Because the proso millet stand at the summit was thin due to poor emergence, there was
significant competition from sandburs that reduced yields (Table 9). The above normal August
precipitation (Table 4) at both sites undoubtedly contributed to the good grain yields. No proso
millet was planted at the Walsh site because there was no soil moisture to support germination.
There were no consistent effects of rotation on proso yield at either Sterling or Stratton in
the WCM and WWCM system. However, proso yields in the opportunity system at Sterling
were greater than either of the rotations. The proso followed a wheat crop in the opportunity
system at both Sterling and Stratton, and had larger soil water reserves relative to proso
following corn in the two rotations (Tables 23-25). Even though the opportunity system had
more available water than the two rotations, the yields at Stratton did not react similarly.
Nitrogen Content of Grain and Stover (straw)
The N content of all grain and stover (straw) in all crops is measured annually at the
Sterling, Stratton and Walsh sites (Tables 10-15). Wheat grain N content (Table 10) ranged from
a low of 1.9 to a high of 2.4%, which is equivalent to grain protein contents of 10.8 to 13.7%,
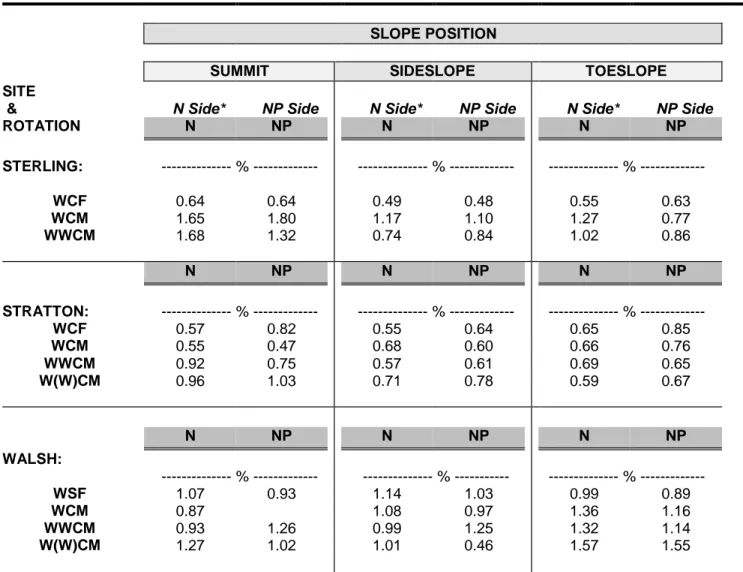
which would be considered normal at the wheat yield levels achieved in 2008. Straw N content
varied widely depending on grain yield level (Table 11). The lowest grain N content levels were
associated with the highest grain yields and vice versa.
Corn and sorghum grain N contents (Table 12) ranged from a low of 1.2 to a high of
2.4%, which is equivalent to grain protein contents of 7.4 to 14.9%. The highest N contents were
found in the grain sorghum at Walsh, which had the lowest grain yields (Table 8).
Proso millet grain N content ranged from 1.5 to 1.9% at Sterling and Stratton, which is
equivalent to 9.3 to 11.8% protein (Table 14). No millet was planted at Walsh in 2008. Millet
stover N contents at Sterling and Stratton ranged from 0.7 to 1.6%, but there was no consistent
pattern with grain yield (Table 15).
Residual Soil Nitrate
Residual soil nitrate levels before planting wheat and corn and sorghum at Sterling,
Stratton, and Walsh are reported in Table 26. The residual soil N levels for the wheat crop
ranged from 14 to 197 kg N/ha in the soil profile across all sites and slope positions. Residual
across all sites and slope positions. Residual levels prior to proso millet planting ranged from 28
to 223 kg N/ha in the soil profile across all sites and slope positions. Residual N levels did not
appear to be related to soil position or crop grown previously.
Soil Moisture
Available soil moisture contents are measured annually at planting and harvest of each
crop in one foot depth increments at the Sterling, Stratton, and Walsh sites to a depth of six feet
or to bedrock in the case of the shallower soils. Soil moisture data for 2008 are presented in
Tables 16-25. The total amount water used by a given crop can be estimated by adding the
change in soil water content between planting and harvesting to the amount of precipitation
received during the growing season. Since we have no measure of how much of the precipitation
infiltrates, the crop water use with this method is an estimate.
SECTION B
2009 Results & Discussion
Climatic Data
The precipitation received during the last six months of a given year greatly influences
crop yield potential for the following crop year, especially spring planted crops. For the last half
of 2008 the Sterling site received 10% more rainfall than normal, the Stratton site 69%, and the
Walsh site 55% more than normal (Table 29). These above normal amounts provided excellent
soil moisture conditions for the winter wheat crop.
Precipitation in the first six months of 2009 also was above the long-term normal
amounts at all three sites (Table 29). The amounts above normal were: 14% at Sterling, 9% at
Stratton, and 12% at Walsh. The above normal precipitation in late 2008 and early 2009
provided excellent crop production potential for both winter wheat and spring crops.
Precipitation in the last six months of 2009, which is the most influential on yield
potential of spring planted crops, exceeded the normal amounts at Sterling by 17%, at Stratton by
40%, and at Walsh by over 200%.
Obviously the precipitation for the entire 18 month period was highly favorable for crop
production (Table 29). Soil water data provided in Tables 38-47 indicates that all crops had
excellent soil water conditions at planting.
Wheat Production
Winter wheat production in 2009 was average to above average at all three sites (Table
31), which was to be expected given the above normal precipitation in late 2008 and all of 2009
(Table 29). Wheat yields were generally the highest in the WC(S)F rotation at all sites as would
be expected. Note however, that wheat yields in all phases of the intensive WCM and WWCM
rotations ranged from 60 to 100% of wheat yields after fallow in the WC(S)F rotation.
is planted in that plot. This change was necessary because low P availability was resulting in
poor wheat stand establishment and low yields. Other crops in the rotation only receive P on the
half plot designated as NP. This adjustment also permits us to measure the residual P fertilizer
effect on the yield of other crops.
It should also be noted that the excellent precipitation permitted excellent wheat straw
production at all sites, which is a benefit for future crop production in all rotations (Table 31)
Corn/Sorghum Production
Corn yields at Sterling exceeded the long-term mean for this site, and the sorghum yield
at Walsh sites was near the long-term means for that site (Table 32). However, the corn yields at
Stratton were below expectations given the excellent late summer precipitation; the reason being
the combined effects of hail and lodging from corn root worm damage. The hail lowered
average yields and resulted in a great deal of inconsistency in yields across rotations and soil
positions. Rotation had no effect on corn yields at Sterling or on sorghum yields at Walsh. At
Stratton there were no distinct effects of P fertilization across site or soil position.
Forage Millet and Proso Millet Production
Proso millet was replaced by forage millet at the Sterling and Stratton sites in 2009
(Table 33). Forage millet yields at Sterling averaged 2500 lbs/A with the highest yields on the
toeslope position. Forage millet yields at Stratton averaged 3800 lbs/A with the highest yields on
the toeslope position. There were no consistent effects of rotation or P fertilization on forage
yields at either site.
Proso millet yields at the Walsh site ranged from 8 to 26 bu/A with the highest yields
occurring at the toeslope position (Table 33). Given the excellent summer precipitation, the
proso yields were less than anticipated on the summit and sideslope positions because of rodent
damage. There was a tendency, on both the summit and sideslope soil positions, for the NP side
to have the highest yields. These soils always test low in available P, whereas the toeslope soil
tests high available P.
Nitrogen Content of Grain and Stover (straw)
The N content of all grain and stover (straw) in all crops is measured annually at the
Sterling, Stratton and Walsh sites (Tables 34a-36b). Wheat grain N content (Table 34a) ranged
from a low of 2.0 to a high of 3.0%, which is equivalent to grain protein contents of 11.4 and
17.1%. Given the excellent wheat yields at all sites in 2009, these grain N contents are excellent
and indicate that the N fertilization program is adequate. Wheat straw N contents reported in
Table 34b ranged from 0.4 to 1.25%, but in general fell below the 1.0% level.
Corn and sorghum grain N contents ranged from a low of 1.4 to a high of 2.1% (Table
35a), which is equivalent to grain protein contents of 8.7 to 13.0%. Stover N contents ranged
from 0.6 to 1.2% (Table 35b).
Proso millet grain N contents are only reported for the Walsh site. They averaged 1.9%,
which is equivalent to 11.8% protein (Table 36a). Millet stover N contents averaged 0.65%
(Table 36b).
Forage millet at the Sterling and Stratton sites had forage N contents ranging from 1.7 to
2.5%. This is equivalent to 10.5 to 15.5% crude protein. Obviously the forage millet had
Residual Soil Nitrate
Residual soil nitrate levels before planting wheat and corn and sorghum at Sterling,
Stratton, and Walsh are reported in Table 37. The residual soil N levels at wheat planting ranged
from 21 to 169 kg N/ha (Divide kg/ha by 1.12 to convert to lb/A) in the soil profile across all
sites and slope positions. Residual levels prior to corn and sorghum planting ranged from 17 to
209 kg N/ha in the soil profile across all sites and slope positions. Residual levels prior to proso
millet planting ranged from 9 to 188 kg N/ha in the soil profile across all sites and slope
positions. Residual N levels did not appear to be related to soil position or crop grown
previously. The high N levels prior to corn planting at Sterling probably resulted because of low
wheat yields at that site in the prior year.
Soil Moisture
Available soil moisture contents are measured annually at planting and harvest of each
crop in one foot depth increments at the Sterling, Stratton, and Walsh sites to a depth of six feet
or to bedrock in the case of the shallower soils. Soil moisture data for 2009 are presented in
Tables 38-47. The total amount water used by a given crop can be calculated by adding the
change in soil water content between planting and harvesting to the amount of precipitation
received during the growing season.
Crop Residue
Crop residue on the soil surface is critical to water conservation in dryland no-till
systems. The amounts present at crop planting time are an indication of the minimum cover
point in a particular cropping system. A snap-shot of residue present in each system is available
in Tables 48-50. Note that residue present is greatly affected by location, particular phase of the
cropping system, and soil position. The reader should be aware that the data in these tables
represents only one year, and that the particular values vary greatly over the years depending on
the climatic conditions of that year.
REFERENCES
Greb, B.W., D.E. Smika, N.P. Woodruff, and C.J. Whitfield. 1974. Summer fallow in the Central
Great Plains. In: Summer Fallow in the Western United States. ARS-USDA. Conservation
Research Report No. 17.
Kaan, D.A., D.M. O’Brien, P.A. Burgener, G.A. Peterson, and D.G, Westfall, D.G. 2002. An
economic evaluation of alternative crop rotations compared to wheat-fallow in Northeastern
Colorado. Tech. Bull. TB02-1. Agric. Exp. Stn., Colo. State Univ., Fort Collins, CO.
Nielsen, D., G.A. Peterson, R. Anderson, V. Ferreira, W. Shawcroft, and K. Remington. 1996.
Table 2a. Cropping systems for each of the original sites in 2007-2008 and 2008-2009 cropping year. Site Rotations Sterling 1) Wheat-Corn-Fallow (WCF) 2) Wheat-Corn-Millet (WCM) 3) Wheat1-Wheat2-Corn-Millet (WWCM) 4) Opportunity Cropping* 5) Perennial Grass Stratton 1) Wheat-Corn-Fallow (WCF) 2) Wheat-Corn-Millet (WCM) 3) Wheat1-Wheat2-Corn-Millet (WWCM) 4) Opportunity Cropping* 5) Perennial Grass Walsh 1) Wheat-Corn-Fallow (WSF) 2) Wheat-Corn-Millet (WCB) 3) Wheat1-Wheat2-Corn-Mung Bean (WWCB) 4) Opportunity Cropping* 5) Perennial Grass
6) Continuous Row Crop (Alternate corn & sorghum) *Opportunity cropping is designed to be continuous cropping without fallow, but not monoculture. See Table 2b for specific crops present each year.
Table 2b. Opportunity cropping history from 1985 to 2008 at the original dryland sites. _____________________________ Site ______________________________
Year Sterling Stratton Walsh
1985 Wheat Fallow Sorghum
1986 Wheat Wheat Sorghum
1987 Corn Sorghum Proso Millet
1988 Corn Sorghum Sudex
1989 Attempted hay millet Attempted hay millet Sorghum
1990 Wheat Wheat Attempted sunflower
1991 Corn Corn Wheat
1992 Hay millet Hay Millet Corn
1993 Corn Corn Fallow
1994 Sunflower Sunflower Wheat
1995 Wheat Wheat Wheat
1996 Corn Corn Fallow
1997 Hay millet Hay Millet Corn
1998 Wheat Wheat Sorghum
1999 Corn Corn Corn
2000 Austrian Winter Pea Austrian Winter Pea Soybean
2001 Wheat Wheat Sorghum
2002 Corn Corn Sorghum
2003 Corn Proso Millet Sorghum
2004 Proso Millet Proso Millet Corn
2005 Corn Corn Corn
2006 Proso Millet Proso Millet Sorghum
2007 Wheat Wheat Corn
Table 3. Nitrogen fertilizer application (lb/A) by soil and crop for
2008.
ROTATION
SITE
SLOPE
CROP
W'WCM
WW'CM
WCM WCF
OPP
Sterling
Summit
Wheat
60 lb
60 lb
60 lb
60 lb
60 lb
Sideslope
"
60 lb
60 lb.
60 lb
60 lb
60 lb
Toeslope
"
60 lb
60 lb
60 lb
60 lb
60 lb
Summit
Corn
52 lb
52 lb
52 lb
52 lb
-
Sideslope
"
52 lb
52 lb
52 lb
52 lb
-
Toeslope
"
52 lb
52 lb
52 lb
52 lb
-
Summit
Millet
42 lb
42 lb
42 lb
-
-
Sideslope
"
42 lb
42 lb
42 lb
-
-
Toeslope
"
42 lb
42 lb
42 lb
-
-
Stratton
Summit
Wheat
60 lb
60 lb
60 lb
60 lb
60 lb
Sideslope
"
60 lb
60 lb
60 lb
60 lb
60 lb
Toeslope
"
60 lb
60 lb
60 lb
60 lb
60 lb
Summit
Corn
52 lb
52 lb
52 lb
52 lb
-
Sideslope
"
52 lb
52 lb
52 lb
52 lb
-
Toeslope
"
52 lb
52 lb
52 lb
52 lb
-
Summit
Millet
42 lb
42 lb
42 lb
-
-
Sideslope
"
42 lb
42 lb
42 lb
-
-
Toeslope
"
42 lb
42 lb
42 lb
-
-
WWSM
WSM
WSF
WCM
CC
Walsh
Summit
Wheat
58 lb
58 lb
58 lb
58 lb
-
Sideslope
"
58 lb
58 lb
58 lb
58 lb
-
Toeslope
"
58 lb
58 lb
58 lb
58 lb
-
Summit
Sorghum
45 lb
45 lb
45 lb
-
-
Sideslope
"
45 lb
45 lb
45 lb
-
-
Toeslope
"
45 lb
45 lb
45 lb
-
-
Summit
Corn
-
-
-
60 lb
60 lb
Sideslope
"
-
-
-
60 lb
60 lb
Toeslope
"
-
-
-
60 lb
60 lb
Summit
Millet
45 lb
45 lb
45 lb
-
-
Sideslope
"
45 lb
45 lb
45 lb
-
-
Table 4. Monthly precipitation for the original sites for the 2007 - 2008 growing season.
MONTH LOCATION
STERLING STRATTON WALSH
Inches Inches Inches Inches Inches Inches
2007 2007 Normals1 2007 Normals1 2007 Normals1
JULY 2.21 3.23 0.82 2.80 1.59 2.62 AUGUST 2.47 1.90 1.54 2.60 0.97 1.96 SEPTEMBER 0.62 1.04 1.65 1.45 0.91 1.74 OCTOBER 0.33 0.76 0.52 0.85 0.07 0.89 NOVEMBER 0.08 0.50 0.15 0.62 0.02 0.53 DECEMBER 1.23 0.40 0.54 0.28 1.18 0.31 SUBTOTAL 6.94 7.83 5.22 8.60 4.74 8.05
Inches Inches Inches Inches Inches Inches
2008 2008 Normals1 2008 Normals1 2008 Normals1
JANUARY 0.06 0.33 0.11 0.28 0.21 0.27 FEBRUARY 0.23 0.33 0.32 0.30 0.23 0.28 MARCH 0.21 1.07 0.28 0.76 0.53 0.81 APRIL 0.84 1.60 0.84 1.23 0.48 1.15 MAY 1.37 3.27 1.24 2.70 0.71 2.69 JUNE 2.60 3.00 1.80 2.45 1.02 2.29 SUBTOTAL 5.31 9.60 4.59 7.72 3.18 7.49
Inches Inches Inches Inches Inches Inches
2008 2008 Normals1 2008 Normals1 2008 Normals1
JULY 1.78 3.23 3.81 2.80 1.65 2.62 AUGUST 3.77 1.90 6.93 2.60 7.03 1.96 SEPTEMBER 0.94 1.04 0.36 1.45 0.83 1.74 OCTOBER 1.53 0.76 3.04 0.85 2.75 0.89 NOVEMBER 0.60 0.50 0.28 0.62 0.14 0.53 DECEMBER 0.06 0.40 0.12 0.28 0.13 0.31 SUBTOTAL 8.68 7.83 14.54 8.60 12.53 8.05 YEAR TOTAL 13.99 17.43 19.13 16.32 15.71 15.54 18 MONTH TOTAL 20.93 25.26 24.35 24.92 20.45 23.59 1
Table 5a. Precipitation by growing season segments for STERLING SITE from 1987-2008.
Wheat Wheat Corn Corn
Vegetative Reproductive Pre-plant Growing Season
Sept.-March April-June July-April May - Oct.
Year Inches Inches Inches Inches
1987-88 5.2 9.9 11.1 15.8 1988-89 3.1 6.5 10.5 14.3 1989-90 5.1 4.7 11.8 13.0 1990-91 3.8 7.2 12.3 11.7 1991-92 4.5 4.8 9.1 14.8 1992-93 4.5 6.2 15.5 10.6 1993-94 6.4 3.0 10.2 6.1 1994-95 7.3 14.4 9.6 17.2 1995-96 4.2 9.2 7.5 18.0 1996-97 4.7 7.0 10.6 21.4 1997-98 5.5 4.9 16.7 13.8 1998-99 5.8 7.7 13.5 12.8 1999-00 5.7 3.0 12.6 8.6 2000-01 6.8 8.2 11.5 13.8 2001-02 4.2 1.9 8.2 8.1 2002-03 5.2 7.6 12.9 8.4 2003-04 1.3 5.3 6.4 10.1 2004-05 3.5 6.6 10.5 8.5 2005-06 2.7 1.3 5.0 9.3 2006-07 5.4 4.8 12.7 13.2 2007-08 2.8 4.7 11.3 14.2
Table 5b. Precipitation by growing season segment for STRATTON SITE from 1987-2008.
GROWING SEASON SEGMENTS FOR
WHEAT AND CORN
Wheat Wheat Corn Corn
Vegetative Reproductive Preplant
Growing Season Sept.-March April-June
July-April May - Oct.
Year Inches Inches Inches Inches
1987-88 4.3 7.2 8.8 12.6 1988-89 3.0 9.4 5.3 15.5 1989-90 5.3 6.1 11.0 13.4 1990-91 4.4 4.1 10.7 14.7 1991-92 3.3 6.1 14.2 13.6 1992-93 3.3 3.8 11.8 14.7 1993-94 4.3 7.8 16.7 13.5 1994-95 7.0 10.0 14.8 13.7 1995-96 3.5 6.0 8.1 14.5 1996-97 2.9 6.2 12.2 23.2 1997-98 8.0 5.9 22.6 13.9 1998-99 4.4 8.5 15.6 12.3 1999-00 6.2 3.9 14.2 8.8 2000-01 4.7 4.3 9.8 10.6 2001-02 3.8 2.2 9.5 6.9 2002-03 4.1 8.7 8.6 10.9 2003-04 5.1 3.8 9.8 6.3 2004-05 3.5 6.7 7.1 13.9 2005-06 4.3 4.8 9.5 9.7 2006-07 7.8 6.3 8.3 8.5 2007-08 3.7 3.9 6.8 17.2 Long Term Average 4.6 6.0 11.2 12.8
Table 5c. Precipitation by growing season segment for the WALSH site from 1987-2008.
GROWING SEASON SEGMENTS FOR
WHEAT AND CORN
Wheat Wheat Corn Corn
Vegetative Reproductive Preplant
Growing Season
Sept.-March April-June July-April May - Oct.
Year Inches Inches Inches Inches
1987-88 4.3 7.6 7.4 11.1 1988-89 4.1 11.5 8.1 20.2 1989-90 5.7 7.4 14.1 12.5 1990-91 5.0 7.7 11.7 12.2 1991-92 2.7 5.8 7.1 13.2 1992-93 6.1 9.2 13.8 14.5 1993-94 3.2 5.3 8.7 16.3 1994-95 4.6 7.2 16.6 7.2 1995-96 1.7 3.5 1.9 17.1 1996-97 5.8 5.3 17.2 11.3 1997-98 6.9 2.3 12.3 13.3 1998-99 8.2 7.4 19.4 14.5 1999-00 7.9 3.2 15.8 10.0 2000-01 9.0 7.9 13.4 9.6 2001-02 1.7 2.2 2.9 11.8 2002-03 6.7 11.4 15.8 12.5 2003-04 3.2 10.1 8.2 13.5 2004-05 3.0 4.7 8.5 8.3 2005-06 2.6 3.0 5.7 11.7 2006-07 5.2 0.9 12.0 1.8 2007-08 3.2 2.2 6.2 14.0 Long Term Average 4.8 6.0 11.1 12.2
Table 6. Crop Variety, seeding rate, and planting date for each site in 2007-2008
season.
Site Crop Variety Seeding Rate Planting Date Harvest Date
Sterling Wheat Hatcher 60 lb/A 09/27/07 07/16/08
Corn DKC 46-60 12K seeds/A 05/05/08 11/05/08
Proso Millet Huntsman 15 lb/A 06/02/08 9/18/08
Stratton Wheat Hatcher 60 lb/A 09/20/07 07/15/08
Corn DKC 46-60 12K seeds/A 05/05/08 11/04/08
Proso Millet Huntsman 15 lb/A 06/03/08 09/17/08
Walsh Wheat Hatcher 45 lb/A 10/22/07
Corn NC+4252VT3 17K seeds/A 05/13/08
Grain Sorghum
Four Star 207 40K seeds/A 05/13/08 12/02/08
Proso Millet Not Planted
Table 7. Grain and stover yields for WHEAT in 2008.
SLOPE POSITION
SUMMIT SIDESLOPE TOESLOPE
SITE
& GRAIN STOVER GRAIN STOVER GRAIN STOVER
ROTATION NP* NP NP* NP NP* NP NP* NP NP* NP NP* NP
STERLING: --- Bu./A. --- --- lbs./A. --- --- Bu./A. --- --- lbs./A. --- --- Bu./A. --- --- lbs./A. ---
WCF 18.9 21.5 2011 2435 28.2 33.4 2804 4912 30.2 30.9 2200 5898 WCM 7.1 3.3 2463 2105 7.5 3.6 821 564 8.4 11.1 544 756 W1WCM 4.2 3.1 1898 1011 11.4 7.5 1325 1074 9.9 4.7 1067 403.0 WW2CM 0 0 0 0 0 0 0 0 0 0 0 0 OPP NP* NP NP* NP NP* NP NP* NP NP* NP NP* NP
STRATTON: --- Bu./A. --- --- lbs./A. --- --- Bu./A. --- --- lbs./A. --- --- Bu./A. --- --- lbs./A. ---
WCF 36.6 37.4 3571 6888 38 36 5639 6756 56.1 48 7571 10158 WCM 22.2 16.6 2300 1379 15.7 13.9 1970 1757 33.7 37.8 2369 5250 W1WCM 4.5 3.9 1250 560 19.0 17.2 1889 3383 35.5 38.7 5234 3799 WW2CM 5.3 4.6 1371 1121 11.3 5.0 2181 694 33.3 48.0 4866 7344 OPP NP* NP NP* NP NP* NP NP* NP NP* NP NP* NP
WALSH**: --- Bu./A. --- --- lbs./A. --- --- Bu./A. --- --- lbs./A. --- --- Bu./A. --- --- lbs./A. ---
WSF 0.6 0.1 352 220 0.8 0.7 313 473 3.8 2.2 1155 1022
WCM 0.8 0.1 288 494 1.1 0.9 520 370 2.5 4.5 570 791
W1WCM 0.8 0.6 470 368 0.5 0.9 371 504 3.1 5.2 798 939
WW2CM 1.2 1.2 488 658 3.8 4.5 646 769 3.6 3.2 744 1019
1. Corn grain yield expressed at 15.5% moisture. 2. Sorghum grain yield expressed at 14% moisture.
Table 8. Grain and stover yields for CORN AND SORGHUM in 2008.
SLOPE POSITION
SUMMIT SIDESLOPE TOESLOPE
SITE
& GRAIN STOVER GRAIN STOVER GRAIN STOVER
ROTATION NP* NP NP* NP NP* NP NP* NP NP* NP NP* NP
STERLING: --- Bu./A. --- --- lbs./A. --- --- Bu./A. --- --- lbs./A. --- --- Bu./A. --- --- lbs./A. ---
WCF 38.8 27.0 1310 820 50.8 68.9 1315 1915 34.7 52.3 945 1880
WCM 59.3 12.0 1690 540 52.5 81.1 1220 2000 46.5 65.7 1235 2760
WWCM 22.8 12.1 545 390 36.6 45.6 905 1495 37.2 42.2 890 1295
NP* NP NP* NP NP* NP NP* NP NP* NP NP* NP
STRATTON: --- Bu./A. --- --- lbs./A. --- --- Bu./A. --- --- lbs./A. --- --- Bu./A. --- --- lbs./A. ---
WCF 26.7 23.2 680 805 36.2 54.7 970 3200 93.0 90.6 3410 2735
WCM 14.2 26.3 565 1370 40.3 26.5 3800 1010 89.9 110.1 2320 3450
WWCM 17.4 26.7 1150 2240 31.0 32.6 760 2900 71.3 106.1 1945 3070
NP* NP NP* NP NP* NP NP* NP NP* NP NP* NP
WALSH: --- Bu./A. --- --- lbs./A. --- --- Bu./A. --- --- lbs./A. --- --- Bu./A. --- --- lbs./A. ---
WSF 9 6 170 115 7 5 130 90 12 6 220 120
WCM NA NA NA NA NA NA
WWSM 8 5 150 100 8 6 140 120 8 7 150 140
Table 9. Grain and stover yields for MILLET in 2008.
SLOPE POSITION
SUMMIT SIDESLOPE TOESLOPE
SITE
& GRAIN STOVER GRAIN STOVER GRAIN STOVER
ROTATION NP* NP NP* NP NP* NP NP* NP NP* NP NP* NP
STERLING: --- Bu./A. --- --- lbs./A. --- --- Bu./A. --- --- lbs./A. --- --- Bu./A. --- --- lbs./A. ---
WCM 25 26 908 445 31 31 802 1088 33 33 975 1090
WWCM 18 18 784 759 31 31 1240 982 27 27 980 1229
OPP 43 42 1298 955 42 42 1321 1745 50 50 1886 1784
NP* NP NP* NP NP* NP NP* NP NP* NP NP* NP
STRATTON: --- Bu./A. --- --- lbs./A. --- --- Bu./A. --- --- lbs./A. --- --- Bu./A. --- --- lbs./A. ---
WCM 8 8 213 246 53 53 1771 1305 68 69 2873 2788
WWCM 34 34 1173 1138 56 56 1867 1951 31 31 987 1193
OPP 17 25 503 1015 37 22 2752 2873 26 17 1894 1177
NP* NP NP* NP NP* NP NP* NP NP* NP NP* NP
WALSH: --- Bu./A. --- --- lbs./A. --- --- Bu./A. --- --- lbs./A. --- --- Bu./A. --- --- lbs./A. ---
WCB
W1WCM Not Planted
WW2CM
1. Corn grain yield expressed at 15.5% moisture. 2. Sorghum grain yield expressed at 14% moisture.
Table 10. Total Nitrogen content of WHEAT GRAIN in the 2008 crop.
SLOPE POSITION
SUMMIT SIDESLOPE TOESLOPE
SITE
& N Side* NP Side N Side* NP Side N Side* NP Side
ROTATION N NP N NP N NP STERLING: --- % --- --- % --- --- % --- WCF 1.96 1.96 2.03 2.05 1.94 2.05 WCM 2.43 2.11 2.32 2.24 2.21 2.10 WWCM 2.33 2.23 2.08 2.00 2.03 2.22 W(W)CM N NP N NP N NP STRATTON: --- % --- --- % --- --- % --- WCF 2.15 2.19 2.06 2.07 2.06 1.65 WWM 1.96 1.92 1.92 1.89 2.12 1.91 WWCM 2.08 2.13 2.09 1.99 1.93 1.91 W(W)CM 2.40 2.48 2.26 2.25 2.24 1.96 N NP N NP N NP WALSH: --- % --- --- % --- --- % --- WSF WCM No data WWCM W(W)CM
Table 11. Total Nitrogen content of WHEAT STRAW in the 2008 crop.
SLOPE POSITION
SUMMIT SIDESLOPE TOESLOPE
SITE
& N Side* NP Side N Side* NP Side N Side* NP Side
ROTATION N NP N NP N NP STERLING: --- % --- --- % --- --- % --- WCF 0.64 0.64 0.49 0.48 0.55 0.63 WCM 1.65 1.80 1.17 1.10 1.27 0.77 WWCM 1.68 1.32 0.74 0.84 1.02 0.86 N NP N NP N NP STRATTON: --- % --- --- % --- --- % --- WCF 0.57 0.82 0.55 0.64 0.65 0.85 WCM 0.55 0.47 0.68 0.60 0.66 0.76 WWCM 0.92 0.75 0.57 0.61 0.69 0.65 W(W)CM 0.96 1.03 0.71 0.78 0.59 0.67 N NP N NP N NP WALSH: --- % --- --- % --- --- % --- WSF 1.07 0.93 1.14 1.03 0.99 0.89 WCM 0.87 1.08 0.97 1.36 1.16 WWCM 0.93 1.26 0.99 1.25 1.32 1.14 W(W)CM 1.27 1.02 1.01 0.46 1.57 1.55
Table 12. Total Nitrogen content of CORN GRAIN in the 2008 and Sorghum Grain in the 2008 crop.
SLOPE POSITION
SUMMIT SIDESLOPE TOESLOPE
SITE
& N Side* NP Side N Side* NP Side N Side* NP Side
ROTATION N NP N NP N NP STERLING: --- % --- --- % --- --- % --- WCF 1.52 1.33 1.39 1.48 1.32 1.39 WCM 1.59 1.47 1.46 1.43 1.42 1.40 WWCM 1.47 1.49 1.41 1.44 1.44 1.44 N NP N NP N NP STRATTON: --- % --- --- % --- --- % --- WCF 1.36 1.27 1.20 1.22 1.18 1.18 WCM 1.64 1.48 1.48 1.47 1.43 1.35 WWCM 1.49 1.46 1.43 1.44 1.32 1.31 N NP N NP N NP WALSH: --- % --- --- % --- --- % --- WSF 1.95 2.19 2.18 2.31 2.29 2.30 WCM 2.45 2.47 2.30 2.36 2.44 2.33 WWSM 2.22 2.23 2.22 2.36 2.30 2.25 CC SORG 2.28 2.47 2.18 2.18 OPP- SORG 2.39 2.49 2.30 2.36 2.44 2.33
Table 13. Total Nitrogen content of CORN STOVER in the 2008 crop.
SLOPE POSITION
SUMMIT SIDESLOPE TOESLOPE
SITE
& N Side* NP Side N Side* NP Side N Side* NP Side
ROTATION N NP N NP N NP STERLING: --- % --- --- % --- --- % --- WCF 1.18 1.23 0.94 0.83 1.09 1.22 WCM 1.47 1.20 1.05 1.14 1.61 1.31 WWCM 1.25 1.29 1.16 1.34 1.18 1.38 N NP N NP N NP STRATTON: --- % --- --- % --- --- % --- WCF 1.03 1.32 1.13 1.06 0.89 0.86 WCM 1.63 1.56 1.49 1.26 1.05 1.09 WWCM 1.76 1.64 1.40 1.55 0.97 1.05 N NP N NP N NP WALSH: --- % --- --- % --- --- % --- WSF 1.21 1.40 0.76 1.34 . 1.58 1.25 WCM WWSM 1.30 1.21 1.26 1.51 1.39 1.40 CC SORG 1.55 1.62 1.44 1.71 1.57 1.75 OPP-SORG 1.37 1.65 1.86 1.92 1.80 1.62
Table 14. Total Nitrogen content of MILLET GRAIN in the 2008 crop.
SLOPE POSITION
SUMMIT SIDESLOPE TOESLOPE
SITE
& N Side* NP Side N Side* NP Side N Side* NP Side
ROTATION N NP N NP N NP STERLING: --- % --- --- % --- --- % --- WCM 1.69 1.73 1.63 1.57 1.64 1.55 WWCM 1.92 2.04 1.79 1.48 1.84 1.73 OPP 1.86 1.82 1.85 1.77 1.71 1.67 N NP N NP N NP STRATTON: --- % --- --- % --- --- % --- WWM 1.83 1.70 1.73 1.40 1.54 1.65 WWCM 1.88 1.91 1.59 1.59 1.71 1.87 OPP 1.88 1.79 1.79 1.58 1.64 1.40 N NP N NP N NP WALSH: --- % --- --- % --- --- % --- WCM Not Planted WWSM
Table 15. Total Nitrogen content of MILLET STRAW in the 2008 crop.
SLOPE POSITION
SUMMIT SIDESLOPE TOESLOPE
SITE
& N Side* NP Side N Side* NP Side N Side* NP Side
ROTATION N NP N NP N NP STERLING: --- % --- --- % --- --- % --- WCM 1.06 0.95 0.70 0.88 0.96 0.77 WWCM 1.38 1.37 1.01 0.67 1.08 1.26 OPP 1.11 1.26 1.04 1.06 1.26 1.28 N NP N NP N NP STRATTON: --- % --- --- % --- --- % --- WCM 1.54 1.05 1.07 0.72 0.99 1.28 WWCM 1.41 1.42 1.02 0.91 1.18 1.33 OPP 1.37 1.05 1.47 0.90 1.11 0.73 N NP N NP N NP WALSH: --- % --- --- % --- --- % --- WCM Not planted WWSM
Table 16. Available soil water by soil depth of the WHEAT phase in the WCM rotation at Sterling and Stratton, and the WCM rotation at Walsh in 2008.
SLOPE POSITION
SITE
& SUMMIT SIDESLOPE TOESLOPE
DEPTH (cm)
Planting Harvest Change Planting Harvest Change Planting Harvest Change
---mm/30cm--- ---mm/30cm--- ---mm/30cm--- STERLING: 15 5 0 5 0 0 0 6 0 6 45 5 0 5 7 0 7 26 13 13 75 6 1 5 7 0 7 44 11 33 105 28 30 (2) 2 0 2 47 10 37 135 - - - - - - 14 9 5 155 - - - - - - 17 0 17 TOTAL 44 31 13 16 0 16 154 43 111 STRATTON: 15 14 0 14 0 0 0 13 14 (1) 45 10 0 10 0 0 0 51 0 51 75 9 0 9 9 0 9 72 0 72 105 10 0 10 18 0 18 69 0 69 135 15 0 15 11 20 (9) 47 14 33 155 0 0 0 0 9 (9) 0 44 (44) TOTAL 58 0 58 38 19 19 252 72 180 WALSH: 15 0 0 0 0 9 (9) 0 0 0 45 0 0 0 0 9 (9) 0 0 0 75 0 4 (4) 0 13 (13) 0 32 (32)