PAPER • OPEN ACCESS
Evaluation of Water quality in the Tigris River within Baghdad, Iraq using
Multivariate Statistical Techniques
To cite this article: Salwan Ali Abed et al 2019 J. Phys.: Conf. Ser. 1294 072025
Content from this work may be used under the terms of theCreative Commons Attribution 3.0 licence. Any further distribution of this work must maintain attribution to the author(s) and the title of the work, journal citation and DOI.
Published under licence by IOP Publishing Ltd 1
Evaluation of Water quality in the Tigris River within
Baghdad, Iraq using Multivariate Statistical Techniques
Salwan Ali Abed 1 ,Salam Hussein Ewaid 2 and Nadhir Al-Ansari 3
1 Department of Environment, College of Science, University of Al-Qadisiyah, Iraq 2 Technical Institute of Shatra, Southern Technical University, Iraq
3 Luleå University of Technology, Luleå , Sweden
Email :Salwan.abed@qu.edu.iq
Abstract .This research concentrated on the Tigris River water quality monitoring
information. Some multivariate statistical techniques were applied like basic Ingredient (PC) test, discriminant analysis (DA), multiple linear regression analysis (MLRA) to evaluate important parameters affecting water quality during year 2017-2018. The study included 25 water quality parameters, viz., Temperature (T), Potential of Hydrogen (pH), Turbidity (Tur), Total Alkaline (TA), Full rigidity (TH), Calcium (Ca+2), Chloride (Cl-1), Magnesium (Mg+2), Electrical Conductivity (EC), Sulfate (SO4-2), Total Solids (TS), Suspended Solids (SS), Iron (Fe+2), Fluoride (F-1), Aluminum (Al+3), Nitrite (NO2-1), Nitrate (NO3-1), Silica (SiO2), Phosphate (PO4-3), Ammonia (NH3), Dissolved Oxygen (DO), Biochemical Oxygen Demand (BOD5), Chemical Oxygen Demand (COD), Sodium (Na+1), and Total Dissolved Solids (TDS). Generally, all the parameters were within the standards except Tur, TA, Ca+2, EC, SO4-2. The levels of Tur and EC are of critical factors influence upon the Tigris water quality. The PCA identified six principal components responsible for 78.12% of the variation caused by the industrial, domestic, municipal and agricultural runoff pollution sources. DA results produced the eight parameters; T, BOD5, EC, Mg+2, DO, Tur, Na+1, and COD as the most significant parameters differentiating the two parts of the year (the cold and warm seasons). The result of MLRA showed that BOD5, Na+1, T, DO, and PO4-3 are the important dependable factors for predicting the COD value as an indicator of organic and nonorganic pollution. This research demonstrated success importance utilizing Multivariate statistical methods like valuable instrument of administration, control, and preserve the water of the river.
Keywords: Multivariate statistical techniques, Water quality, Tigris River, Iraq
1. Introduction
Quality of surface water in rivers, can be affected by normal processes such as soil weathering, rainfall and erosion, as well as human activities like manufacturing and agrarian production [1]. In addition, rivers can be polluted due to high exposition to various forms of contamination from domestic, agricultural and industrial waste [2].
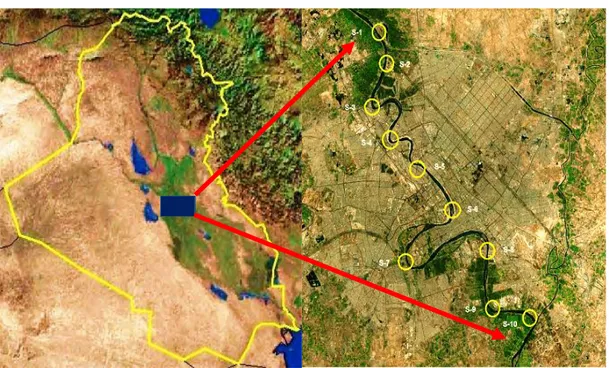
There are two major rivers in Iraq (Figure 1), one of which is the Tigris. Because of the presence of water, fertile ground and appropriate natural views, the Tigris basin is densely populated [3]. People use the river water for industrial, agricultural and domestic purposes. Discharging urban
and industrial wastewater, has resulted in the deterioration of river water quality, especially during past 30 years [4-5].
Using large sets of physical, chemical and biological information to evaluate water quality by descriptive processes have a few direct importance of decision makers, and interpreting and analyzing such datasets is a complex task, especially given the large number of variables involved [6]. Many studies dealing with the hydrochemistry of the river were conducted [7-11] and show significant spatial and temporal changes in the parameters along the river. Therefore, continuous monitoring is of critical importance to explain the main changes and the cause of these changes using suitable methods and techniques [12]. It is, thus, also necessary to employ multivariate methods in order to achieve meaningful results. Such methods are particularly useful for decision makers in terms of assessing environmental quality [13]. These methods include Principle Component Analysis (PCA), Multiple Linear Regression (MLR), Mass Analysis (CA) and Discriminant Analysis (DA) are suitable for interpreting large datasets with multiple variables and for identifying potential factors that influence water quality. Thus, they are a valuable tool for developing effective water quality management strategies [14].
This study aims to apply certain multivariate analysis methods to identify the major parameters that contribute to pollution and influence water quality, which enables decision makers and authorities to use this information in their water management strategies.
2. Materials and Method
2.1. The Search Space
The Tigris River rises from the eastern mountains of Turkey, and its total length is about 1,900 km. The catchment area includes Turkey, Iraq, Syria, and Iran and is approximately 235,000 km2 [3]. The river length is about 1,415Km inside Iraq and flows throughout the whole country from the north to the south [5] (Figure 1).
There are many cities located on both sides of the Tigris, the most important is the Iraqi capital Baghdad. The river bisects the capital Baghdad, which is inhabited by more than seven million people, for a length of about 50Km (Figure 1) [15].
3
To predict and control the water quality of the Tigris River, the Baghdad Water Directorate launched a program to monitor the water of the Tigris River for several decades. Water samples were collected and tested with standard methods of Rice et al [16] by trained staff at the laboratories of the Directorate as part of the ongoing monitoring scheme at the ten stations on the river [17]. Ten sockets of Baghdad purification factories located along river (Figure 1) were chosen as the sampling stations for this work. These are: 1. Karkh, 2. Sharq Dijla, 3. Sadr, 4. Wathba, 5. Karama, 6. Kadhimya, 7. Qadisia, 8. Dora, 9. Wahda, and 10. Rasheed plant. These factories supply city with its requirements of water.
2.2. Data pretreatment and analysis
In this study, the monthly (December 2016 - November 2017) monitoring dataset (3,000 measurements), obtained from Baghdad Water Authority has been tested by multivariate statistical methods to generate useful information, including 25 water quality parameters. These parameters are: Temperature (T), Potential of Hydrogen (pH), Turbidity (Tur), Total Alkalinity (TA), Total Hardness (TH), Calcium (Ca+2), Chloride (Cl-1), Magnesium (Mg+2), Electrical Conductivity (EC), Sulfate (SO4
-2
), Total Solids (TS), Suspended Solids (SS), Iron (Fe+2), Fluoride (F-1), Aluminum (Al+3), Nitrite (NO2
-1
), Nitrate (NO3 -1
), Silica (SiO2), phosphate (PO4 -3
), Ammonia (NH3), Dissolved Oxygen (DO),
Biochemical Oxygen Demand (BOD5), Chemical Oxygen Demand (COD), Sodium (Na
+1
), and Total Dissolved Solids (TDS).
The monthly water qualities monitoring information were divided into two sets: the hot Summer and Autumn months (June, July, August, September, October, and November) and moderate winter and spring months (December, January, February, March, April, and May) to be analyzed by the DA technique. In this study, SPSS v.24 Software bundle of Windows was used in the description of the data and multivariate statistical analysis. All the 25 items were joined together using Shift recording (excluding pH) normal extraction and recover variable`s effect for very low or very high rate of variance.
2.3. Principal Component Analysis (PCA)
This type of analysis can identify the most significant parameters which characterize all datasets and generating factors [18]. The factors that have >1 variance are included only because each element must explain the difference more than any one element [19]. The PCA was applied to describe all datasets and data reduction, giving the correlation between water elements without altering the original data [20].
This study determined the normalized variables of the significant principal components which reduce the influence of the variables with small importance by utilizing varimax turnover with log modification and eliciting linear transformation coefficient from the matrix link. Number of important factors and amount of distinction elucidated by any factor were counted [21].
2.4. Discriminant Analysis (DA)
DA aids in grouping samples, which have the same properties and which are used with a mean of discriminating variables to find the dependable groups for the classification of a dataset. It can produce significant outcomes without disturbing the original variables and can forecast the correlation between two or more groups as compared to other statistical techniques [22].
DA includes the derivation of linear combinations of the independent variables that will be discriminate between the established groups to create a discriminant function for each group and transforms the original set of measurements of a sample to a single discriminant score [23].
2.5. Multiple linear regression analysis (MLRA)
The MLR is a statistical technique that explains the dependent- independent relation
between the variables [24]. The information are to be prepared depending on sampling sites
and monitoring
system. Then, Regression analysis assumptions (linear, normality, multiple linear, andsymmetric inequality) were tested as follows:Linear hypothesis is verified by disorganized items. Natural distribution is the examination by a diagram, Installation of natural curve, Q-Q-item and with Kolmogorov-Smirnoff (Valid quality test). Multiple linear testing, established link transactions smaller than 0.8 among independent variables and Variance Inflation Factor (VIF) < 10. Homoscedasticity hypothesis was verified by the scatter plot [25].
COD-calculated values were set to be dependent variables and rates of 25Physical WQ standards to be Independent Variables in MLR analysis to find which variables can predict water COD in the river. COD indicates organic and nonorganic pollution to simplify WQ monitoring.
3. Results and Discussion
3.1. The General situation of river water
Descriptive Statistics for the range of: minimum, maximum, mean, standard error (SE), standard deviation (SD), and variance values of the 25 physicochemical parameters during the year 2016-2017 are tabulated in table 1. The variables are: (T, pH, Tur, TA, TH, Ca+2, Cl-1, Mg+2, EC, SO4
-2 , TS, SS, Fe+2, F-1, Al+3, NO2 -1 , NO3 -1 , SiO2, PO4 -3
, NH3, DO, BOD5, COD, Na
+1
, and TDS). Physicochemical parameters study in the river water reveals more about the WQ. This investigation separates the parameters that are responsible for diminishing WQ. In this search, standards intend rates contrasts were compared with Iraqi parameters (IQS, 2009) for drinking purpose. Results showed that all parameters were within the standard value except Tur, TA, and Ca+2, which were higher than the
acceptable limits and sometimes the EC, SO4
-2, and Fe+2 do (Table 2). Apparently, Tur and EC amounts
are the critical factors affecting the river WQ.
Tigris undergoes genuine lack of water and annual variances in water quantity and quality. The variation of the discharge is due to climate change and dam construction in the neighboring countries. In summer and autumn (Drought seasons), water coming from upstream is contaminated with dark organic matters, causing WQ changes [17].
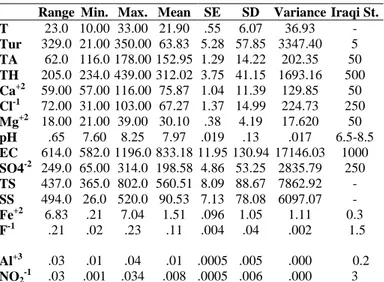
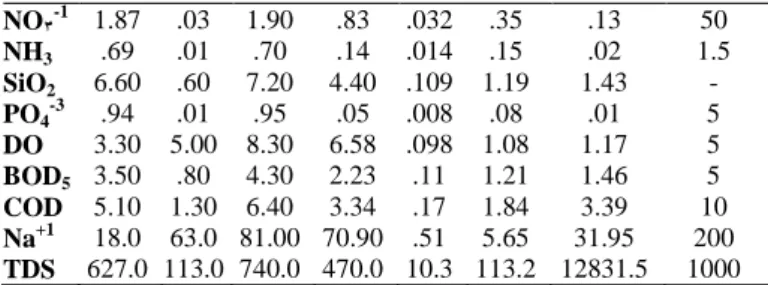
Table 1. Descriptive statistics of the year 2016-2017 Tigris River data.
All parameters in mg/l except the T in (ºC), Tur in (NTU), EC in (μS/cm-1), and pH in pH unit.
Range Min. Max. Mean SE SD Variance Iraqi St.
T 23.0 10.00 33.00 21.90 .55 6.07 36.93 - Tur 329.0 21.00 350.00 63.83 5.28 57.85 3347.40 5 TA 62.0 116.0 178.00 152.95 1.29 14.22 202.35 50 TH 205.0 234.0 439.00 312.02 3.75 41.15 1693.16 500 Ca+2 59.00 57.00 116.00 75.87 1.04 11.39 129.85 50 Cl-1 72.00 31.00 103.00 67.27 1.37 14.99 224.73 250 Mg+2 18.00 21.00 39.00 30.10 .38 4.19 17.620 50 pH .65 7.60 8.25 7.97 .019 .13 .017 6.5-8.5 EC 614.0 582.0 1196.0 833.18 11.95 130.94 17146.03 1000 SO4-2 249.0 65.00 314.0 198.58 4.86 53.25 2835.79 250 TS 437.0 365.0 802.0 560.51 8.09 88.67 7862.92 - SS 494.0 26.0 520.0 90.53 7.13 78.08 6097.07 - Fe+2 6.83 .21 7.04 1.51 .096 1.05 1.11 0.3 F-1 .21 .02 .23 .11 .004 .04 .002 1.5 Al+3 .03 .01 .04 .01 .0005 .005 .000 0.2 NO2-1 .03 .001 .034 .008 .0005 .006 .000 3
5 NO3-1 1.87 .03 1.90 .83 .032 .35 .13 50 NH3 .69 .01 .70 .14 .014 .15 .02 1.5 SiO2 6.60 .60 7.20 4.40 .109 1.19 1.43 - PO4-3 .94 .01 .95 .05 .008 .08 .01 5 DO 3.30 5.00 8.30 6.58 .098 1.08 1.17 5 BOD5 3.50 .80 4.30 2.23 .11 1.21 1.46 5 COD 5.10 1.30 6.40 3.34 .17 1.84 3.39 10 Na+1 18.0 63.0 81.00 70.90 .51 5.65 31.95 200 TDS 627.0 113.0 740.0 470.0 10.3 113.2 12831.5 1000
3.2. Principal Component Analysis (PCA)
PCA was calculated in this study for the 25 variables from the 10 sampling stations on the river during 2016-2017, to identify the most important water quality variables by knowing the eigenvalues which give the highest degree of factor significance. Eigenvalues of 1.0 or more are considered as significant (Fig. 2 and Table 3) [21]. Classification of PCs (weak, moderate, and strong) is agreeing to the absolute loading values of 0.30-0.50, 0.50-0.75 and > 0.75 respectively and the PC which had an eigenvalue more than 1 was used to assess the important parameters in the river water [19].
From the obtained PCA data, six components were extracted, explaining 78.12% of the total variance, which helps clarifies the results and in finding out the sources of pollution from the water quality data. Table (3) and Figure (2) includes the eigenvalues and loadings of the six PCs, explaining the total and the cumulative variance. The rotation, which increased the factors number, is necessary to clarify the same variance amount in the original dataset [21].
PC1 explained 27.83% of the variance and loaded heavily on TS, EC, Cl-1, TH, Mg+2. It is clear that SO4
-2
, Ca+2, TS, and EC, come from the non-point source pollution of the hydro-geochemical and mineralization processes of the soil components. The Cl-1, TH, and Mg+2 represent the contribution of point pollution and the chemistry of the river [26].
PC2 explained 21.66% of the total variance and was loaded mainly by SS, Tur, COD, BOD5, Na +1
, Fe+2, TDS, and DO. This PC represents the role of the non-point source of organic pollution from agricultural areas and point-source pollution from domestic sewage [18]. PC3 was responsible for 8.97% of the variance and was best represented by NO2
-1
, NH3, SiO2, and TA. This component
contains the runoff, the municipal sewage and the contribution of non-point source pollution from the geological components of soil [27]. An additional 6.93% of the water quality variance was explained in PC4; this PC contains F-1 and pH which indicate mineral pollution [26].
The PC5 explained 6.78% of the variance and loaded by PO4
-3
and Al+3. The presence of PO4 -3
is due to agricultural runoff and the municipal sewage because PO4
-3
is a component of detergents [18]. The Al+3 may come from the Alum Al (OH)3 used in water purification plants along the river within the
city. The PC6 explained 5.94% of the variance and loaded by T and NO3
-1
. Water temperature reflects the atmospheric temperature, and the loadings on NO3
-1
represent the contribution of non-point source pollution and refer to the decayed organic matters from agricultural areas [27].
Table 2. Loadings of 25 variables on 6 significant PCs in the
varimax rotated component matrix.
PCs Variables 1 2 3 4 5 6 TS .949 -.115 .073 .063 .013 .025 EC .942 -.164 .105 -.062 -.095 .062 Cl-1 .932 -.035 .192 .019 -.022 -.142 TH .918 -.224 .022 .065 .005 .226 SO4-2 .891 -.070 .031 .151 .109 -.163 Ca+2 .867 -.200 .096 -.077 -.028 .267
Mg+2 .818 -.129 -.067 .317 .082 .076 SS .016 .914 -.057 -.202 .060 -.024 Tur -.068 .880 .044 -.042 .068 .092 COD .410 -.803 -.198 -.175 -.091 -.158 BOD5 .404 -.795 -.200 -.179 -.103 -.135 Na+1 .516 -.708 -.112 -.103 -.021 -.117 Fe+2 -.005 .704 .151 .126 -.325 -.165 TDS .477 -.698 .153 .263 .052 .039 DO -.007 .595 -.011 .065 .102 .338 NO2-1 .034 .093 .808 -.106 -.091 .001 NH3 .229 .106 .799 -.156 -.143 -.009 SiO2 -.053 -.203 .547 .075 .480 -.072 TA .277 .412 .542 .145 .272 .175 F-1 .242 .012 -.307 .786 .118 -.122 pH .041 .071 .048 .720 -.181 .339 PO4-3 -.059 .095 .061 -.357 .759 .261 Al+3 .108 .150 -.189 .169 .725 -.246 T -.446 -.172 -.075 -.163 .158 -.707 NO3-1 -.083 .490 -.084 .051 .121 .549 Eigenvalue 6.96 5.41 2.24 1.73 1.69 1.48 % of Variance 27.83 21.66 8.97 6.93 6.78 5.94 % Cumulative of Variance 27.83 49.49 58.47 65.39 72.18 78.12
Moderate and strong loadings values in bold red.
Figure 2. Scree plot of the Eigenvalue and the component number.
3.3. Discriminant Analysis (DA)
In the present study, a stepwise discriminant function analysis method was employed in order to identify the major parameters affecting river water quality. The data was divided into two groups, based on atmospheric temperatures, season - winter/spring (December to May) and summer/autumn (June to November).
Wilks’ lambda is an indication of how well the cases can be divided into separate groups. It is calculated as the fraction of the total variance in the discriminant scores which are not otherwise
7
explained by differences between the groups. A low Wilks’ lambda figure means higher separation [22].
Chi-square analysis can verify whether the means of the functions are equal across the various groups. A small significance value means the discriminant function is better at separating the groups than purely random chance [23].
In the current study, the value of Wilks’ Lambda was 0.18; Chi-square value was 192.0 for the function, and the significance level was 0.00 below 0.05, (Table 3). These results demonstrate the function can be significantly discriminate, and that the two groups are statistically significant. All cases were correctly classified in the two groups, according to cross-validated classification (Table 4). The eigenvalues of the function were greater than one (4.349), and the conical correlation value was 0.902. Thus, they can be used to evaluate the dominant features in the dataset. DA provided the most significant parameters (eight discriminants: T, BOD5, EC, Mg, DO, Tur, Na, and COD) as shown in Table 4. Furthermore, stepwise DA indicates those eight parameters are more significant and discriminate between the two different groups of months (the moderate and hot months) and play the most important role in the variation of water quality of Tigris River.
Table 3. The canonical discriminant function.
Function Eigenvalue % of Variance Cumulative % Canonical Correlation
1 4.349 100.0 100.0 0.902
First 1 canonical discriminant functions were used in the analysis.
Test of Function Wilks' Lambda Chi-square df Sig.
1 0.187 192.005 7 0.000
3.4. Multiple Linear Regression Analysis(MLRA)
In this study, Multiple Linear Regression Analysis (MLRA) which is a preferable analysis method for checking linear dependent-independent connection in the variables. Standard MLRA incorporates all items in equation by one step, whereas gradual MLR operates by adding/removing variables in each step till the optimal predictors are reached [28].
In this study, data from 25 WQ standards of the river in monthly measurement (separate items), and the measured COD (connected items) were analyzed by gradual MLRA to define the most significance standards that are accountable for the distinction in QW and predicting COD value. The result showed that the five variables (BOD5, Na
+1
, T, DO, and PO4 -3
) are the best to predict the COD value which is a measure for organic and nonorganic pollution (Table 4 and 5).
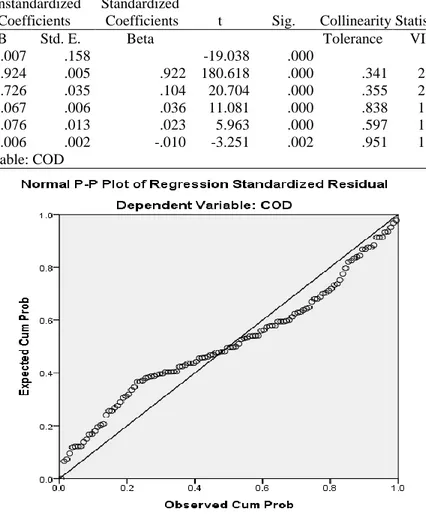
The predicted COD values are presented in Fig. 3 and compared with the observed COD. It offers proximity and equal apportionment of the steps in a direct way. The predicted COD average was a few times higher or lower than the observed rate. The multiple R is above (0.999), and that means a maximum of the parameters has a positive relationship with COD which indicates organic and nonorganic pollution. The R2 (coefficient of determination) values were above 99%, and that means mainly that these factors could provide an explanation of environmental pollution sources of industrial as well as domestic pollution (Table 4). Table 4 shows the right R2 average of the water quality standards that are highly correlated with COD. Results reveal evidently that only five factors (BOD5,
Na+1, T, DO, and PO4
-3) can be considered decisive and most significant, which are accountable for
predicting water quality discrimination, or illustrating about 0.999 value of the separate items (COD) within river information. This highlight the reality that distinction of the connected items greater than distinction of the residual (Figure.3).
Table 4. The data gained from the stepwise MLRA application to predict the COD value.
R R2 Adjusted R2 SE of the Estimate Durbin- Watson
0.999 0.999 0.999 0.01805 1.385
Predictors: (Constant),BOD5, Na+1, T, DO, and PO4-3
Dependent Variable: COD
Table 5. The MLRmodel validation.
Model
Unstandardized Coefficients
Standardized
Coefficients t Sig. Collinearity Statistics
B Std. E. Beta Tolerance VIF
(Constant) -3.007 .158 -19.038 .000 BOD5 .924 .005 .922 180.618 .000 .341 2.929 Na .726 .035 .104 20.704 .000 .355 2.813 T .067 .006 .036 11.081 .000 .838 1.194 DO .076 .013 .023 5.963 .000 .597 1.674 PO4 -.006 .002 -.010 -3.251 .002 .951 1.052 Dependent Variable: COD
Figure 3. Comparison of observed and predicted COD values.
4. Conclusion
In this study, some important multivariate techniques were applied to evaluate the complex water quality data of the Tigris River. The strong loading of certain variables in the PCA identified the pollution sources` inputs. DA reduced the data and gives the significant parameters (T, BOD5, EC,
Mg, DO, Tur, Na, and COD) which discriminate between the moderate and hot seasons during the year. MLRA identified the most important variables which contribute towards the increase of COD as an indicator of pollution. This study will be supportive to control critical parameters existing in the river route and supportive in the application of techniques as per calculated parameters. Thus, for the improvement on the river system, the managing authorities should consider the results of PCA, DA, and MRA for a complete evaluation of the river ecosystem.
9
5. Acknowledgments
The authors would like to thank the staff of the laboratories of Baghdad Water Authority and gratefully acknowledge the director, the engineer Mrs. Jullanar Al-Sharqi for her help in facilitating this research. Thanks also are due to the faculty of Science in the University of Al-Qadisiyah and the Technical Institute of Al-Shatra in the Southern Technical University in Iraq for the logistic assistance and thanks are also extended to Mr. Mohamad Mahdi for proofreading the text.
6. References
[1 ] Kumar, B., Singh, U. K., & Ojha, S. N. (2018). Evaluation of geochemical data of Yamuna River using WQI and multivariate statistical analyses: a case study. Inter. J. of River Basin Manag. 1-13.
[2 ] Ewaid, S. H. & Abed, S. A., (2017 a). Water Quality Assessment of Al-Gharraf River, South of Iraq Using Multivariate Statistical Techniques. Journal of Al-Nahrain University-Science, 20(2), 114-122.
[3 ] Varol, M., Gökot, B., Bekleyen, A., & Şen, B. (2012). Water quality assessment and apportionment of pollution sources of Tigris River (Turkey) using multivariate statistical techniques—a case study. River research and applications, 28(9), 1428-1438.
[4 ] Rabee, A. M., Abdul-Kareem, B. M., & Al-Dhamin, A. S. (2011). Seasonal variations of some ecological parameters in Tigris River water at Baghdad Region, Iraq. Journal of Water Resource and Protection, 3(04), 262.
[5 ] Al-Ansari, N., AlJawad, S., Adamo, N., Sissakian, V., Laue, J., & Knutsson, S. (2018a). Water Quality within the Tigris and Euphrates Catchments: Water Quality within the Tigris and Euphrates Catchments. Journal of Earth Sciences and Geotechnical Engineering, 8(3), 95-121.
[6 ] Ling, T. Y., Soo, C. L., Liew, J. J., Nyanti, L., Sim, S. F., & Grinang, J. (2017). Application of multivariate statistical analysis in the evaluation of surface river water quality of a tropical river. Journal of Chemistry, 2017.
[7 ] Sulaymon, Abbas H., Abdul-Fattah M. Ali, and Saadi K. Al-Naseri. "Natural organic matter removal from Tigris River water in Baghdad, Iraq." Desalination 245, no. 1-3 (2009): 155-168.
[8 ] Al-Ansari, Nadhir, Ammar Ali, and Sven Knutsson. "Present conditions and future challenges of water resources problems in Iraq." Journal of Water Resource and Protection 6, no. 12 (2014): 1066-1098.
[9 ] Al-Obaidy, A. H. M. J., Zahraa Z. Al-Janabi, and Eman Shakir. "Assessment of water quality of Tigris River within Baghdad City." Mesop. Environ. J. 1 (2015): 90-98.
[10 ] Abdulwahab, Shayma, and Adel M. Rabee. "Ecological factors affecting the distribution of the zooplankton community in the Tigris River at Baghdad region, Iraq." The Egyptian
Journal of Aquatic Research 41, no. 2 (2015): 187-196.
[11 ] Omar, Khairi Ali. "Prediction of Dissolved Oxygen in Tigris River by Water Temperature and Biological Oxygen Demand Using Artificial Neural Networks (ANNs)." J. of Duhok Univ. 20, no. 1 (2017): 691-700.
[12 ] Ewaid, S. H., & Abed, S. A. (2017 b). Water quality index for Al-Gharraf River, southern
Iraq. The Egyptian Journal of Aquatic Research, 43(2), 117-122.
https://doi.org/10.1016/j.ejar.2017.03.001
[13 ] Zafar MU, Ahmad W (2018) Water Quality Assessment and Apportionment of Northern Pakistan by Multivariate Statistical Techniques, A Case Study. Int J Hydro 2 (1): 00040. [14 ] Herojeet, R., Rishi, M. S., Lata, R., & Dolma, K. (2017). Quality characterization and
pollution source identification of surface water using multivariate statistical techniques, Nalagarh Valley, Himachal Pradesh, India. Applied Water Science, 7(5), 2137-2156.
[15 ] Al-Ansari, N., Adamo, N., Sissakian, V., Knutsson, S., & Laue, J. (2018b). Water Resources of the Tigris River Catchment: Water Resources of the Tigris River Catchment. J. of Earth Sciences and Geotechnical Engineering, 8(3), 21-42.
[16 ] Rice, A., Baird, E. W., & Eaton, R. B. (2017). APHA 2017 Standard Methods for Examination of Water and Wastewater (Washington: American Public Health Association, American Water Works Association, and Water Env. Federation ISBN).
[17 ] Al-Sharqi, J. (2017) Personal connection with Mrs. Jullanar Al-Sharqi the director of laboratories in Baghdad Water Authority.
[18 ] Bouguerne, A., Boudoukha, A., Benkhaled, A., & Mebarkia, A. H. (2017). Assessment of surface water quality of Ain Zada dam (Algeria) using multivariate statistical techniques. Inter. J. of River Basin Management, 15(2), 133-143.
[19 ] Khaledian, Y., Ebrahimi, S., Natesan, U., Basatnia, N., Nejad, B. B., Bagmohammadi, H., & Zeraatpisheh, M. (2018). Assessment of water quality using multivariate statistical analysis in the Gharaso River, Northern Iran. In Urban ecology, water quality and climate change (pp. 227-253). Springer, Cham.
[20 ] Zheng, L. Y., Yu, H. B., & Wang, Q. S. (2015). Assessment of temporal and spatial variations in surface water quality using multivariate statistical techniques: A case study of Nenjiang River basin, China. Journal of Central South University, 22(10), 3770-3780.
[21 ] Bhardwaj, V., Singh, D. Sen & Singh, A. K. (2010). Water quality of the Chhoti Gandak River using principal component analysis, Ganga Plain, India. J. Earth Syst. Sci. 119,, (1), pp.117–127.
[22 ] Hajigholizadeh, M., & Melesse, A. M. (2017). Assortment and spatiotemporal analysis of surface water quality using cluster and discriminant analyses. Catena, 151, 247-258.
[23 ] Cronk, B. C. (2017). How to use SPSS®: A step-by-step guide to analysis and interpretation. Routledge.
[24 ] Ewaid S. H, Abed S.A and Kadhum S. A (2018). Predicting the Tigris River Water Quality within Baghdad, Iraq by Using Water Quality Index and Regression Analysis. Environmental Technology & Innovation, 11 (2018) 390–398. https://doi.org/10.1016/j.eti.2018.06.013 [25 ] Fu, L., Wang, Y.G., 2012. Statistical Tools for Analyzing Water Quality Data, Water Quality
Monitoring, and Assessment, Dr. Voudouris (ed.), InTech, ISBN: 978-953-51-0486-5.
[26 ] Zhang, Y., Li, Y., Da, W., Yu, M., Quan, Q., & Li, Y. (2018). Application of multivariate statistical methods in the assessment of water quality in selected locations in Jialing river basin in Guangyuan, China. Water Science and Technology: Water Supply, ws2018058. [27 ] Barakat, A., El Baghdadi, M., Rais, J., Aghezzaf, B., & Slassi, M. (2016). Assessment of
spatial and seasonal water quality variation of Oum Er Rbia River (Morocco) using multivariate statistical techniques. International Soil and Water Conservation Research, 4(4), 284-292.
[28 ] Park, S., Hamm, S. Y., Jeon, H. T., & Kim, J. (2017). Evaluation of Logistic Regression and Multivariate Adaptive Regression Spline Models for Groundwater Potential Mapping Using R and GIS. Sustainability, 9(7), 1157.
[29 ] Ewaid, S.H., Abed, S.A., 2017a. Water quality assessment of Al-Gharraf River, south of Iraq using multivariate statistical techniques. J. Al-Nahrain Univ. Sci. 20 (2), 114–122.
[30 ] Ewaid, S.H., Abed, S.A., 2017b. Water quality index for Al-Gharraf river, southern Iraq. Egypt. J. Aquatic Res. 43 (2), 117–122. http://dx.doi.org/10.1016/j. ejar.201703001.
[31 ] Ewaid, S.H., Abed, S.A., Kadhum, S.A., 2018. Predicting the Tigris river water quality within Baghdad, Iraq by using water quality index and regression analysis. Environ. Technol. Innov. 11 (2018), 390–398. http://dx.doi.org/10.1016/j.eti.201806013.
[32 ] Abed S A. 2014. Bio-Ecological study of Marbled Teal Marmaronetta angustirostris in Hor Al-Dalmaj - Iraq. Ph.D. dissertation, University of Baghdad, Iraq.