Potentials of Insurance Market Development in Jizzak
region
Master’s Thesis
Blekinge Institute of Technology
Ronneby, Sweden
By Abdullaev Shuhrat and
Abdurahmonov Sharof
Abstract
Title: Potentials of Insurance Market Development in Jizzak region Authors: Shuhrat Abdulaev, Sharof Abdurahmonov
Supervisor: Anders Hederstierna
Department: Business Administration, Blekinge Technology Institute Course: Master’s thesis in Business Administration, 10 credits
Background and Problem Discussion: The main reasons why we have chosen this topic “Potentials of insurance market development in Jizzak region” for our thesis are the followings:
1) Strong and Competitive insurance market is one of the essential parts of well-developed market economy. How to reach well-well-developed insurance market is a complex problem that the economy of Uzbekistan is facing now.
2) Having studied previous researches regarding insurance market of Uzbekistan and the role of marketing in development of companies we concluded that there are huge potentials for growing in insurance market which have not learned yet.
Purpose: The purpose of this thesis is to find the answers to following questions: How is the current situation in the insurance market of Uzbekistan?
What kind of insurance services are there and what is the demand for them? The determination of main clientele of insurance companies;
The determination of factors that can affect on insurance services
The analysis of proportion of population who do not apply for insurance services and the reasons;
The role of marketing research in companies’ growth;
Method: This research used Quantitative method. Survey technique used to conduct a quantitative study. Primary data collected through questionnaire. Secondary data collected from banks and department of Statistics of the local government. This research can be seen as deductive research since it begins by examining theories related to insurance and consumer behavior to insurance services. Following hypothesis were developed by the assumption that
• Person’s insurance expenditure dependent of their annual income
• Person’s positive opinion about insurance dependent of their gender • Person’s positive opinion about insurance dependent of their age
• Person’s positive opinion about insurance dependent of their education • Person’s who is insured dependent of their income
Theory: The theory section contains a review of theories concerning in economic nature and functions of insurance, marketing in insurance, insurance market in Uzbekistan.
Analysis: Statistical program SPSS 14v.(Statistical Package for the Social Sciences) - is used to
compute the correlation values and the regression coefficients. The results presented in appropriate table and graph. We divided our analysis into three parts:
1) Using the secondary data, we analyzed accidents that happened during the last two years, obligatory insurance, insurance companies in Jizzak.
2) We analyzed dependence of respondents’ annual insurance expenditure on their annual income using the multiple regression analysis.
3) Based on the primary data and using Chi-square statistical test, we analyzed consumer behavior to insurance service interviewing people individually. Conclusion: Analysis
showed that insurance premiums mostly come from obligatory insurance. We discovered that banks are the main clients of insurance agencies at the present and insurance market undeveloped yet, the main reasons are low level of insurance culture, low level of citizens income, lack of understanding by the population and legal entities the need in insurance services; undeveloped economy of country, which doesn’t allow the insurance market to develop as a whole; lack of brokerage companies to work with insurance agencies; lack of skilled specialists and prepared insurance managers.
Acknowledgments
We are grateful to the survey respondents who participated in our questionnaires and interviews. First of all, we would like to thank the officials of local banks, credit unions and building companies of Jizzak region.
Special thanks to officials of banking association of Uzbekistan in Jizzak branch, “Turon Bank”, “Galla Bank”, and other branches of the “Ishonch” insurance agency for collecting survey data. We are also grateful to the officials of the Regional Department of Statistics of the local government, The Regional Department of Fire Prevention, The Regional Department of Emergency Situations and The Regional department of Central Bank for supporting us with statistical information.
We also appreciate the scientific suggestions of Dr.Anders Hederstierna during the period of our academic years.
During our academic years at Blekinge Institute of Technology we obtained an extensive knowledge in the field of business.
We realize that the gained knowledge at Blekinge Institute of Technology is already giving the results in the sphere of business.
Table of Contents
List of Tables 5
List of Figures 6
Introduction 7
Chapter 1 Literature Review
1.1 Economic nature and functions of insurance 9
1.2 Marketing and marketing research in insurance 13
1.3 Insurance market in Uzbekistan 15
1.5 Marketing research tools 20
Chapter 2 Analyses and Results
2.1. Factors that can affect to insurance market 23
2.1.1 Natural disasters 23
2.1.2 Obligatory insurance: Banks and Credit unions 26
2.1.3 Obligatory insurance: Construction companies 29
2.1.4 Competitors 30
2.2 Analysis of people’s annual expenditures 33
2.3. Analysis of consumer behavior in insurance market 38
Chapter 3 Conclusion and Recommendations 58
References 62
Appendices 64
List of tables
Table 2.1 Natural disasters for 2004 and 2005 years 24
Table 2.2 Fires in 2004 and 2005 years 24
Table 2.3 Rates of obligatory transport insurance 26 Table 2.4 Credit portfolio (Jizzak regional banks) for 2003-2004 27 Table 2.5 Credit portfolio (Jizzak regional banks) for 2004-2005 27 Table 2.6 Market share and types of insurance service 30 Table 2.7 Our score for insurance companies 32 Table 2.8. Multiple regression analysis of Number of Population, and Average Annual Income, on Population Insurance Expenditures
33
Table 2.9 Descriptive Statistics 34
Table 2.10 Pearson Correlations 34
Table 2.11 Significance for Pearson Correlations 35
Table 2.12 Summary 35
Table 2.13 ANOVA 36
Table 2.14 Regression Coefficients 36
Table 2.15 Statistics 40
Table 2.16 Respondent’s gender 41
Table 2.17 Age of respondent's 42
Table 2.18 Education 43
Table 2.19 Monthly income of respondent's 44
Table 2.20 “Are you insured?” 45
Table 2.21 “Do you have sufficient income to be insured?” 46
Table 2.22 “Is insurance reasonable?” 47
Table 2.23 “Do you believe in insurance?” 48
Table 2.24 Cross table “Is insurance reasonable? * Respondent’s gender” 49 Table 2.25 Chi-Square test results “Is insurance reasonable? * Respondent’s
gender” 50
Table 2.26 Cross table “Is insurance reasonable? * Age of respondent's” 51 Table 2.27 Chi-Square test results “Is insurance reasonable? * Age of respondent's” 52 Table 2.28 Cross table “Is insurance reasonable? * Education” 53 Table 2.29 Chi-Square test results “Is insurance reasonable? * Education” 55 Table 2.30 Cross table “Are you insured? * Do you have sufficient income to be
insured?”
55 Table 2.31 Chi-Square test results “Are you insured? * Do you have sufficient
income to be insured?”
List of figures
Figure 1. Respondents’ gender 41
Figure 2 Age of respondents 42
Figure 3 Education 43
Figure 4 Monthly income of respondents 44
Figure 5 “Are you insured?” 45
Figure 6 “Do you have sufficient income to be insured?” 46
Figure 7 “Is insurance reasonable?” 47
Figure 8 “Do you believe in insurance?” 48
Figure 9 “Is insurance reasonable? * Respondent’s gender” 50 Figure 10 “Is insurance reasonable? * Age of respondent's” 52 Figure 11 “Is insurance reasonable? * Education” 54 Figure 12 “Are you insured? * Do you have sufficient income to be insured?” 56
INTRODUCTION
After becoming independent in 1991 Uzbekistan chose a market economy as a way to develop. Every market infrastructure is on the step of development today here, insurance is not exclusion. Government of Uzbekistan passes necessary laws and regulations and insurance companies’ quantity is growing year by year.
The main reasons why we have chosen this topic “Potentials of insurance market development in Jizzak region” for our thesis are the followings:
Strong and Competitive insurance market is one of the essential parts of well-developed market economy. How to reach well-developed insurance market is a complex problem that the economy of Uzbekistan is facing now.
Having studied previous researches regarding insurance market of Uzbekistan and the role of marketing in development of companies we concluded that there are huge potentials for growing in insurance market which have not learned yet.
To analyze deeply the current insurance market and to learn potentials to grow we tried to find the answers to following questions:
How is the current situation in the insurance market of Uzbekistan?
What kind of insurance services are there and what is the demand for them? The determination of main clientele of insurance companies;
The determination of factors that can affect on insurance services
The analysis of proportion of population who do not apply for insurance services and the reasons;
Why did we decide to choose Jizzak region? Because Jizzak is situated in the center of Uzbekistan geographically, the population lives not only in urban area but also in rural area as well, the competition among insurance companies is not tough yet and there is huge potential to grow.
We looked through several foreign and local scientific literatures to write this thesis. There is a little information of marketing researches on insurance market of Uzbekistan. The secondary information was gathered according to Statistic department’s and analytical department’s data of Jizzak region.
The primary information was gathered by questionnaires and interviews with the local population and officials of local banks.
Chapter 1. Literature Review
1.1. Economic nature and functions of insurance
The insurance is the way to provide protection against financial losses resulting from a variety of perils. By purchasing insurance policies, individuals and businesses can receive reimbursement for losses due to car accidents, theft of property, and fire and storm damage; medical expenses; and loss of income due to disability or death. Indemnifying the losses is produced from facilities of insurance fund. The Insurance is reasonable when insurance events (risks) cause significant need for money.
As an economic category an insurance presents the system of economic relations, including forms and methods of creating insurance fund and its use on indemnifying the insurance events and helping to people when certain events happens in their life. Alexandrov A. (1998) describes following characters of the economic category of insurance:
• presence of redistribution relations;
• presence of insurance risk (and criterion of its estimation);
• organizing of insurance community from underwriters and insurers;
• combination individual and group insurance interests;
• united liability of all underwriters for damage;
• closed spreading of damage;
• redistribution of damage in space and time;
• returning of insurance payments;
• self-sufficiency of insurance activity.
Transition to market economy provides essential growth of interest to insurance, increases the sphere of insurance services and development of alternatives to state insurance. Changes touch also sphere of property and the personal insurance of people that is directly connected with economic interests of population. Offers of insurance
service increase with transition to market economy and gradual shaping of insurance market occurs. Voluntary types of insurance will be preferable.
Biryuchev O. notes (2000) that on the one hand insurance plays as a protection of business and well-being of people in market economy, on other hand it is an activity which brings income. The main sources of income are insurance activity, investment of temporarily free facilities to production and non-production spheres, share in companies, bank deposits, securities and etc.
He divides main functions of economic category of insurance to three parts: 1. Shaping specialized insurance fund.
2. Indemnifying the damage and the personal material provision ensuring the people. 3. Warning of insurance event and minimization of damage.
The First function is creation of specialized insurance fund to indemnify risks, which
insurance companies take as liability. This fund can be formed both obligatorily and voluntarily. Government depending on economic and social situation adjusts the development of insurance in country. With development of insurance market the mechanism of using temporarily free facilities will improve.
The Second function is indemnifying the damage and the personal material provision
of people. Only individuals and organizations who are participants in forming of insurance fund have right on indemnifying. The order of indemnifying the damage is defined on contract between insurance companies and clients is adjusted the state (licensing of insurance activity).
The Third function of insurance is warning of insurance event and minimization of
damage - expects the broad complex of measures, including financing the actions on reduction of negative consequences of accidents, natural disasters. Insurance company forms the special fund of preventive actions to realize this function.
A risk-averse person is willing to pay money – a risk premium- to avoid risk. The demand for risk reduction is met by insurance companies, which bear the risk for anyone who buys an insurance policy. Many risk-averse individuals and firms buy insurance.
To clarify “How much Insurance Individuals Want” Jeffrey M. Perloff (2004) notes that the way insurance works is that a risk-averse person or firm gives money to the insurance company in the good state of nature, and the insurance company transfers money to the policyholder in the bad state of nature. The transaction allows the risk-averse person or firm to shift some or all if the risk to the insurance company.
For example, Mr. X is risk-averse person. He wants to insure his house, which is worth $80 (thousand). There is a 25% probability that his house will burn next year. If a fire occurs, the house will be worth only 40$.
With no insurance, the expected value of his house is (1/4*$40) + (3/4*$80) = $70.
Mr. X faces a good deal of risk. The variance of the value of his house is (1/4*($40-$70)*($40-$70) + (3/4*($80-$70)2) = $300
Now suppose that an insurance company offers a fair bet, or fair insurance; a bet between an insurer and a policyholder in which the value of the bet to the policyholder is zero. The insurance company offers to let Mr. X trade $1 in the good state of nature (no fire) for $3 in the bad state of nature (fire). This insurance is fair because the expected value of this insurance to Mr. X is zero:
Because Mr. X is risk averse, he fully insures by buying enough insurance to eliminate his risk altogether. With this amount of insurance, he has the same amount of wealth in either state of nature.
Mr. X pays the insurance company $10 in the good state of nature and receives $30 in the bad state. In the good state, he has a house worth $80 less the $10 he pays the insurance company, for a net wealth of $70. If the fire occurs, he has a house worth $40 plus a payment from the insurance company of $30, for a net wealth, again, of $70. Mr. X’s expected value with fair insurance, $70, is the same as his expected value without insurance. The variance he faces drops from $300 without insurance to $0 with insurance. Mr. X is better off with insurance because he has the same expected value and faces no risk.
Jeffrey M.Perloff (2004) describes when fair insurance is offered, risk-averse people fully insure. If insurance companies charge more than the fair-insurance price, individuals buy less insurance.
Because insurance companies do not offer fair insurance, most people do not fully insure. An insurance company could not stay in business if I offered fair insurance. With fair insurance the insurance company’s expected payments would equal the amount the insurance company collects. Because the insurance company ha operating expenses-costs of maintaining offices, printing forms, hiring sales agents, an so forth- an insurance firm providing fair insurance would lose money. Insurance companies’ rates must be high enough to cover their operating expenses, so the insurance is less than fair to policyholder.
How much can insurance companies charge for insurance? A monopoly insurance company could charge an amount up to the risk premium a person is willing to pay to
avoid risk. The more risk averse an individual is, the more a monopoly insurance company can charge. If there are many insurance companies competing for business, the price of an insurance policy is less than the maximum that risk-averse individuals are willing to pay-but sill high enough that firms cover their operating expenses.
1.2. Marketing and marketing research in insurance.
Marketing starts with human needs and wants. People need food, air, water, clothing, and shelter to survive. Beyond this, people have a strong desire for recreation, education, and other services. They have strong preferences for particular versions and brands of basic goods and services.
Marketing has been defined in various ways. Kotler (1997) describes marketing as follows:
Marketing is a social and managerial process by which individuals and groups obtain what they need and want through creating, offering, and exchanging products of value with others.
The American Marketing Association’s definition of marketing provides a more specific, yet broader, definition:
Marketing is the process of planning and executing the conception, pricing, promotion, and distribution of ideas, goods, and services to create exchanges that will satisfy individual and organizational objectives.
This definition stresses that marketing requires the business to conceive of a good, service, or idea and then develop it. In other words, marketers must have ideas for products that may be brought to market and purchased by buyers. How do marketers learn what the customer wants? Marketing research fulfills the marketing manager’s need for information about the market. The emphasis of marketing research is to shift decision makers from risky decisions to decisions based on carefully planned investigations.
Marketing research is the systematic and objective process of gathering information for aid in making decisions. This research information should be objective, not intuitive or haphazardly gathered. Marketing research involves analysis of primary data or secondary data. Primary data are data gathered and assembled specifically for the project at hand. Secondary data are data previously collected and assembled for some purpose other than the project at hand.
In accordance with specified principles of insurance marketing is orientated on achievement of high quantitative, qualitative and social factors such as amount of the concluded agreements, amount of the profit, share of the insurance field, covered by insurer, amount of the dues and amount of the agreements, amounts and degree of client’s request on volume, structure and quality of the services, provided insurance company, as well as ability of the provision by insurer to safety of information.
As Zubes states (1999) the purpose of marketing in insurance company can be: Maximization of company’s profit.
Earning by insurance company sufficient profit alongside with execution some additional function.
He confirms that marketing in insurance is enough powerful to differ from marketing, existing in the field of commodities production. At first this is connected with particularity with the insurance business, surrounded by which main are:
long period life of the insured product, long-term character of interaction insurer and consumer, determined by validity of the contract (for example, legality contract of insurance life can reach 50 and more years), therefore in a number of cases profitability, the properties and characteristic of the insurance product become to be comprehensible through many years after its sale.
The most important part for client of his contact with insurance company (investigation and settlement of an insurance case) can be delayed behind for many years from the moment of the conclusion and agreement, insurer can refuse or the other reason to refuse in payment of the indemnity. In step of buying the insurance product, client can not sufficiently value its quality.
Inseparable insurance facilities from insurer, which undertakes the permanent obligations on indemnifying the damage in consequence which quality of the insurance service can change on subjective reason in the course of time.
Strong risking component typical of insurance that traditional marketing in sphere of production does not provide. In detailed analysis different risks are available in process life cycle of goods (thus risk its estimation and management to it) are main component of insurance product.
a strong state regulation of the insurance business, in particular, presence of the hard requirements to properties of the insurance product (the tariffs, obligatory insurance covering, accommodation of insurance reserves), that greatly reduces the marketing independence in the actions of the insurer (for instance, he can not essentially cut prices for the services, as it causes respond reaction of state bodies who is responsible for provision of solvency to the insurer.
Undesirable changes of a social-economic environment in insurance market. Absence of the patenting the insurance products that automatically entails quick
copying of the original developments and insurance programs by competitors.
Weak understanding the essences of the insurance by majority client,
particularly population, in result it becomes hard to contact the insurer with potential consumer.
Remarkably big importance of the segmenting market in activity of insurer.
1.3. Insurance market in Uzbekistan
24 insurance and 1 reinsurance companies function in Uzbekistan’s insurance market today. 10 of them have more than 1 million USD of authorized capital. Recently there was accepted by Uzbekistan’s Government a project of development of insurance sector until 2010. Insurance companies are increasing their authorized capital year by year, medical and mortgage insurance becomes more popular. Several Laws are planned to accept by Government in 2007-2010. Some of them are: Mandatory auto civil liability insurance, insurance of employer’s responsibility, obligatory medical insurance, insurance of business, export credit, export-import cargo transportations insurance.
Very small number of magazines about business is edited here in Uzbekistan. “Economic survey”, “Taxpayers”, “Market, Money, and Credit” (“MMC”), and “Business Messenger” are widespread ones.
Main information concerning to “The potential of insurance market in Jizzak” can be found in the journals of “Market, Money, and Credit”. The articles about banking, finance, insurance and tax are issued in these journals. There is not any special journal edited specifically for marketing and insurance.
We think that life insurance should be one of the main insurance products in any country. Historically formed that life insurance in country with developed market economy is one of the important instruments of social policy, that helps to satisfy such public needs, as financial protection of person when accident happens in his life, maintenance of stable living level after retiring, financial savings for children education, loan reception under guarantee of insurance policy and many others.
In Uzbekistan, like in many other former Soviet Union countries, life insurance is in behind of insurance of other risks. The starting point for development of life insurance in Uzbekistan was an acceptance of the Law "About insurance activity" at April 2002, in which it is provided that insurance companies, functioning in sphere of general risks insurance, are not allowed to function in life insurance. It means that for the first time life insurance is distinguished as a separate direction in insurance market. Not only insurance companies but also population and government should be interested in organizing good conditions for functioning in life insurance sphere. Population are potential consumers of the broad spectrum of insurance services on such type of the insurance, as insurance on event of the deaths, on living till determined by agreement age or period, insurance of expenses for education, insurance for pensions and life insurance of loan borrower.
Insurance companies accumulate financial resources and receive income investing them. On “The impacts of the insurance market on the economy” Kh. Shennaev
(MMC, №4, 1997) tries to analyze impacts of accumulation resources of insurance on
the economy in the experience of abroad are studied. The significance of free resources accumulated by insurance companies in the capital market is highlighted, but current condition of insurance market in Uzbekistan is not analyzed in details.
Government is interested in development of life insurance as well, because it is one of the forms of social protection of population, which leads to reduction of additional expenses in case accident happens.
In today’s insurance sector commercial banks are main group of clientele for insurance companies. M.Mirsodikov on “Banks’ risks insurance” by (MMC, №12, 1998) investigates banks’ risks insurance according to public deposits in banks. As the author states, this type of insurance is the effective way to protect the public deposits. The exact problems and their solutions are not stated precisely. On his “Collaborative work
of banks and insurance companies” (MMC, №12, 1999). M. Mirsodikov analyzed the
problems of collaborative work of banks and insurance companies, the resources accumulated by insurance premium are also noted. The article chiefly consists of praised words and nothing more, the real facts and analyzes, financial data are not stated.
We think that one of the problems is people are not sure in stability of national currency. According to the Law of the Republic of Uzbekistan “About exchange regulation” insurance companies have right to realize insurance payments and get insurance indemnity in hard or national currency at present. Undoubtedly, insurance of bank deposits will help to increase deposit inflow to banks.
Good example of state support of the development of the certain sector of the economy can serve the practice of assistance to development of house construction by bank
structure, under which money, directed by people on buying houses, were free from income tax. The Possibility of using that tool in practice for long-term saving insurance products would be powerful stimulus for population in choosing insurance companies and excellent source for insurance companies to invest free facilities.
“The development of insurance business in Uzbekistan” (MMC, №57, 2002)
H.Kodirov states that insurance sphere of Uzbekistan has following features: low share
of market coverage, imperfection of legislative basis, low income of population and low insurance culture. One of the main problems in insurance sector of Uzbekistan is lack of specialists, possessing sufficient level of knowledge and working experience. The deficit of skilled personnel concerns practically all level of the production process, commencing from development of modern insurance products to organization of sale and realization of the all-round analysis of activity on insurance.
All above mentioned articles are written imprecisely. Quantitative and qualitative analyzes with real data are not given. There is not any analysis of compared parameters. The real problems are not raised. In fact, the situation around Uzbekistan is critical let alone in the region. Maybe scientists find out some solutions to the problems mentioned above but in literature and journals we couldn’t find valuable information we needed. Perhaps, it’s because the result of the policy or economy of Uzbekistan. As a matter of fact, the information about insurance business and marketing researches is not investigated. This fact informs us of the importance of investigating an insurance business and marketing problems of insurance.
So many articles about marketing and marketing researches are published in the foreign countries. Here, in Uzbekistan it’s a dream which has not come true yet. The Study of insurance market is a central item of marketing. Without market information it is impossible to have a decision in improving company’s activity (insurance products, territorial sales and etc.). The Study of consumer’s needs is a basis to any marketing strategy. As soon as need and preferences are chosen, it is possible to start the
development of insurance products. The editorial office “MMC” on “Marketing of insurance market” (“MMC” (№2, 1999) tries to analyze the insurance sector of Uzbekistan, insurance companies and their clients, advertisements of insurance only theoretically. The special recommendations of how to organize insurance business and the special methods for analyzing them are not shown. Therefore, in order to study the problem of the potential of the insurance market in Jizzak region, we tried to do this thesis based on the theories, the practical instructions of scientists such as Kotler, Zubes and some others.
1.4. Hypothesis
We will analyze insurance market potential and consumer behavior on example of insurance agency “Ishonch”. What consumers think about the insurance, whether they are insured and which factors influence them to be insured? Which market segments must “Ishonch” choose to do insurance business? Who are competitors and what are their weaknesses and strength? According to our goals, we put following hypothesis:
1. H0=Number of people and average annual income of respondents do not
influence to annual insurance expenditure.
H1=Number of people and average annual income of respondents both influence
to annual insurance expenditure.
2. H0-The proportion in the respondents who thinks that the insurance is reasonable
independent of gender.
H1- The proportion in the respondents who thinks that the insurance is
reasonable dependent of gender.
3. H0- The proportion in the respondents who thinks that the insurance is
reasonable independent of age.
H1- The proportion in the respondents who thinks that the insurance is
reasonable dependent of age.
4. H0- The proportion in the respondents who thinks that the insurance is
reasonable independent of education.
H1- The proportion in the respondents who thinks that the insurance is reasonable dependent of education.
5. H0-The proportion in the respondents who is insured independent of respondent’s
H1- The proportion in the respondents who is insured dependent of respondent’s
sufficient income.
1.5. Marketing research tools
Kotler (1997) describes the major statistical tools which are used in marketing research: 1. Multiple regressions. A statistical tool for estimating a “best fitting” equation showing how the value of a dependent variable varies with changing values in a number of independent variables.
2. Discriminates analysis. A statistical technique for classifying an object or persons into two or more categories.
Techniques for displaying and examining distributions.
Donald R. Cooper and C. William Emory (1995) notes that marketing research should use scientific methods. For example statistical tools and models.
They state several useful techniques are essential to any preliminary examination of the data, for example, frequency table, and histograms.
As they note the histogram is a conventional solution for the display of internal-ratio data. Histograms are used when it is possible to group the variable’s values into intervals.
The authors find histograms useful for
• Displaying all intervals in a distribution, even those without observed values,
• Examining the shape of the distribution for skew ness (a measure of a
distribution deviation from symmetry), kurtosis (a measure of a distribution’s peaked ness) deviation from symmetry, and the model pattern.
The authors also note that Frequency table is a simple device for arraying data. Frequency tables are used for tabulating counts or percentages, and also exploratory data analysis techniques are recommended for graphical display and examination of distributions. Many studies would be content to conclude data analysis at this point. Other studies, particularly those with variables composed of category data (frequency counts of nominally scaled variables), may need to inspect the relationships between and among those variables. This analysis is commonly done with cross tabulation.
According to them cross tabulation is a technique for comparing two classification variables. The technique uses tables having rows and columns that correspond to the levels or values of each variable’s categories.
If the measurement scale is nominal (classification only), as they state it is possible to use χ2 test. Chi-Square (χ2) test probably the most widely used nonparametric test of
significance is the chi-Square test. It is particularly useful in test involving nominal data but can be used for higher scales. Typical are cases where persons, events, or objects are grouped in two or more nominal categories such as “yes-no,” or class “A,B,C, or D.” Using this technique the authors test for significant differences between the observed distribution of data among categories and the expected distribution based upon the null hypothesis. Chi-Square is useful in cases of one-sample analysis, two independent samples, or κ independent samples. It must be calculated with actual counts rather than percentages.
In the one-sample case, as they assert we should choose a null hypothesis based on the expected frequency of objects in each category. Then the deviations of the actual frequencies in each category are compared with the hypothesized frequencies. The greater the difference between them, the less the probability that these differences can be attributed to chance. The value of χ2 is the measure that expresses the extent of this
difference. The larger the divergence, the larger the χ2 value.
The formula given by authors to which the χ2 test is calculated is:
χ2 = i i i k i E E O 2 1 ) ( −
∑
=Oi= Observed number of cases categorized in the ith category. Ei= Expected number of cases in the ith category under Ho. κ=The number of categories.
There is a different distribution for χ2 for each number of degrees of freedom (d.f.),
defined as (κ-1) or the number of categories in the classification minus one. d.f. = κ - 1
With chi-square contingency tables of the two sample or κ-sample variety, we have both rows and columns in the cross-classification table. In that instance , d.f. is defined
as rows minus 1 (r - 1) times columns minus 1 (c - 1). d.f. = (r - 1) (c - 1)
One author defines Multivariate analysis as “those statistical techniques which focus upon, and bring out in bold relief, the structure of simultaneous relationships among three or more phenomena.”
According to authors, multiple linear regression describes the relationship between two or more (m) independent variables (X1, X2, … , Xm) and a single dependent variable
(Y), assuming a linear (straight line) relationship between the dependent variable and them independent variables. The relationship is described as
Y = α + β1X1 + β2X2 + …. βmXm ± ε, where α = a constant, the value of Y when all X values are zero
βm = the slope of the regression surface(regression coefficients associated with each Xm ε =an error term.
Based on author’s definition the F statistic for linear regression indicates the statistical probability that the regression coefficient for a simple linear regression is equal to zero, or that all of the partial regression coefficients for a multiple linear regression are equal to zero. For linear regression, F is calculated as the regression mean square divided by the residual mean square i.e. MSreg/MSres. An F statistic can also be calculated for the
significance of the additional sum of squares for any particular independent variable or combination of several independent variables in multiple linear regressions. The
degrees of freedom for the F statistic are df1 = m (the number of X variables) and df2 = n
- m - 1 (sample size - m - 1); the total degrees of freedom is dftot = n - 1.
B.E. Gmurman (1977) gave core rules to make the decision:
• If the calculated value is larger than the critical value, we reject the null hypothesis and conclude that the alternative hypothesis is supported.
hypothesis and conclude that the alternative hypothesis is not supported.
Chapter 2. Analyzes and Results
As we mentioned in the first chapter we divided our analysis into three parts:
1. In the first part, using the secondary data, we analyzed accidents that happened during the last two years, obligatory insurance, competitors of “Ishonch” in Jizzak. 2. In the second part we analyzed dependence of respondents’ annual insurance expenditure on their annual income using the mathematical statistics methods.
3. In the third part using the mathematical statistics methods we analyzed consumer behavior to insurance service interviewing people individually.
2.1. Factors that can affect to insurance services in Jizzak
According to information given by Statistic department, GDP of Jizzak in 2004 was equal to 370 247, 5 million uzbek sum, insurance premium share in GDP was equal to 267, 5 million sum or 0.07% of GDP. In 2005 GDP was equal to 453 054,1 million sum and insurance premium share in GDP was 380.6 million sum or 0.08% of GDP.
As M. Yuldoshev (2002) asserts, share of insurance premium in Uzbekistan is equal to 0.1% of annual GDP, but in well-developed countries it ranges from 8% to 12%. This fact shows that insurance services and market is not developed in Uzbekistan yet.
2.1.1 Natural disasters
We were not able to take any clear statistical information regarding natural disasters from Statistic Department because of confidentiality. When we interviewed local people we found out that there were a lot of damages and ruined fields where the cotton and grain were planted in 2004-2005. Natural disasters brought too many difficulties in the sphere of agriculture like traumas, damages and financial problems. We analyzed that it happens slightly very often in spring.
We got information from the Department of Emergency situations excluding agriculture for 2004-2005.
Table 2.1 Natural disasters in Jizzak region 2004 - 2005 years
№ Years Natural disasters Trauma Death
Number % Damage
(uzb..sum)
% Number % Number %
2004 26 600 500 51 40
2005 24 -7.7% - 54 5.9% 48 20%
Source: Department of Emergency situations of Jizzak region
In 2005 the emergency situation happened approximately -7.7% rather less than it was in 2004. But the trauma and death is increased into 5.9% and 20% a year.
The explosion of gas balloon in Gallaorol brought a lot of damages and financial losses in 600 500 sum. As the manager of Department told none of objects, buildings and man were insured from those accidents.
On interview with Department representatives it was discussed the insurance problems and come to decision of organization seminars and meetings.
Fires in Jizzak region
On the following table there is information on fire accidents in 2004-2005.
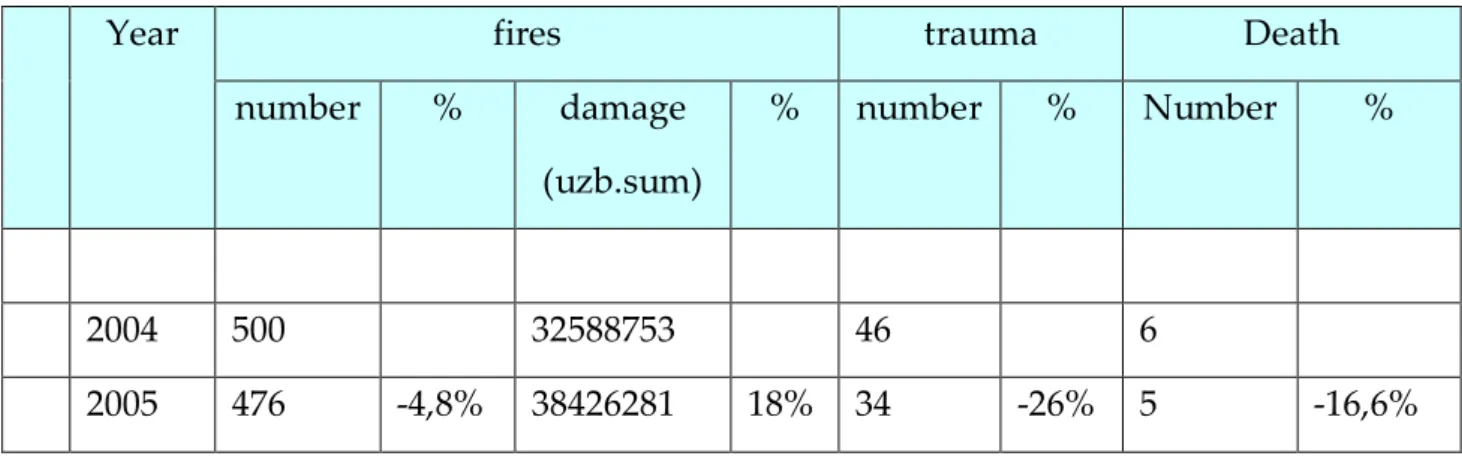
Table 2.2
Fires in 2004-2005 yearsYear fires trauma Death
number % damage
(uzb.sum)
% number % Number %
2004 500 32588753 46 6
2005 476 -4,8% 38426281 18% 34 -26% 5 -16,6%
According to the information above the number of fires became less -4.8%, injures -26% and death -16.6% in 2005 but damage increased to 18%.
As the chief of the department said none of the objects, buildings and people were insured against those accidents. As he noticed there is no belief on insurance service among the population.
On interview with Fire Department representatives it was discussed the insurance problems and come to decision of organization seminars and meetings.
From the tables it is seen that in 2005 the quantity of fires and natural disasters are increased. That’s why the insurance services must be developed in the region.
2.1.2 Obligatory insurance: Banks and Credit unions
Decree №632 “Obligatory Insurance of the means of transport and Obligatory Insurance of civil responsibility of motor transport owners” was issued by Cabinet of Ministry of Uzbekistan in 1994.
According to the decree rates of obligatory insurance are: Table 2.3 Rates of obligatory transport insurance
Type of transport Insurance rate for legal entity Insurance rate for people
Passenger car, bus and microbus
1.5% 1%
Truck (Lorry) 2% 1.5%
Tram and trolley bus 1% -
Motorcycles 0.5% 0.5%
In this part of analysis we interviewed representatives of banks and credit unions. It is very important to study what they think about the insurance and insurance agencies.
Table 2.4 Credit portfolio (Jizzak regional banks) for 2003-2004 In thousand uzb.sum 01.01.2004 01.01.2005 Difference Total Loans 42 618 375.9 32 417 882.4 -10 200 493.5 Total loan collateral 57 183 922.5 44 835 118.2 -12 348 804.3 Property as collateral 6 278 763.7 7 862 461.1 1 583 697.4
Source: Jizzak departmentof the Central bank of Uzbekistan Table 2.5 Credit portfolio (Jizzak regional banks) for 2004-2005
In thousand uzb.sum 01.01.2005 01.01.2006 Difference Total Loans 32 417 882.4 33 584 005.1 1 166 122.7 Total ensure 44 835 118.2 46 376 392.3 1 541 274.1 Property as collateral 7 862 461.1 13 390 609.3 5 528 148.2
Source: Jizzak departmentof the Central bank of Uzbekistan
A special personal interview was held among nine banks’ branches out of ten and two credit unions. They are “National bank”, “Pakhta bank”, “Ipoteka bank”, “Tadbirkor bank”, “Savdogar bank”, “Gallabank”, “Asaka bank”, “Turon bank”, “Halq bank”,
“Inom” and “Ishonch” credit unions. The private bank “Universal”, which was newly organized didn’t take part in this interview.
Having taken a special interview among the officials of the banks and credit unions we have found out followings:
The properties as collateral belong to obligatory insurance. They are mainly insured by “Uzbekinvest” or “Kafolat”. Branches of “Asaka bank” and “National bank” are ordered to deal with the “Uzbekinvest” by their head office. The reason is they are stockholders of the “Uzbekinvest”. The other seven banks deal with both of them simultaneously.
Only “Asaka bank” requires complex car insurance. Complex insurance includes insurance of motor transport owners’ civil responsibility, life insurance, and insurance from accidents, natural disasters insurance, and car insurance. The main reason for this is increasing rate of crimes connecting with cars and drivers. In spite of trying to get valuable information concerning to this issue from Regional internal affairs we couldn’t get necessary information.
The officials of banks inform that they have some kinds of emergent protests against insurance agencies. They can not get in touch with them immediately owing follow speed service of the insurance agencies.
They consider “Kafolat” has one advantage over the others because they always offer flexible percentage rate.
One of the drawbacks of the “Uzbekinvest” is using insurance contract forms in Russian though the Uzbek language is a state language officially. It creates some difficulties to clients. That creates some disagreements among agencies, banks and clients.
“Ishonch” credit union works with “Uzbekinvest”. As the chief manager of “Ishonch” says, “Uzbekinvest” has planned to open a branch of the agency in the building of the credit union. Both companies hope to mutually reliable service during some years of corporative work.
CU “Inom” usually works with “Kafolat”. “Ishonch” negotiate with that union to work with.
Banks and unions appreciate the reliability, high quality service and flexibility, low price and fast speed of the insurance service.
2.1.3 Obligatory insurance: Construction companies
We interviewed with representatives of fourteen construction companies. We tried to choose of winner companies of tender to build the schools, colleges, hospital and army buildings planned to be built in 2006 year by the budgetary found. The budget size for these objects for 2006 is 16500 million sum (date from Regional Governance Financial department).
According to the decree №532 by the Cabinet of Ministry of Uzbekistan issued in 1999 year these companies should use insurance service in the construction. Though during the interviews companies showed that they are not eager to work with insurance agencies and they have lack of substantial knowledge about insurance. They wanted to insure fewer than 30% of the risks in the construction works with a low price as little as possible. It is mentioned in the decree that fewer than 80% of the building construction must be insured obligatory. However, the minimum degree of percent of the obligatory insurance was not mentioned in the decree of the Cabinet of Ministry.
As the managers of the construction companies said that the loss comes from natural disasters and accidents are not perceptible. According to them insurance is nothing except bureaucracy.
In conclusion you can guess that they are not interested in insurance.
When we studied the volume of this type of insurance premium in the region we found out that it consists of 4990.8 thousand sum. We can simply calculate that if 50% of all building constructions will be insured averagely at 0.25% rate (in the decree it’s adopted as 0.4%) it becomes 20625.0 thousand sum. We think the reason for this is weakness of the decree and lack of exact requirements.
2.1.4 Competitors
Four insurance agencies function in Jizzak region except “Ishonch”. They are “Uzagrosugurta” (established in 1994), “Uzbekinvest” (established in 1997), “Kafolat” (established in 1997) and “Madad” (established in 1995). We didn’t work on analyzing the balance sheet of these agencies as we only intended to investigate the market of insurance, consumers and competitors of the agencies in our region. If we’d investigated them around Uzbekistan the thesis would have widened and extended. “Ishonch”, “Uzagrosugurta”, “Uzbekinvest” and “Kafolat” are in the top ten insurance companies in Uzbekistan. “Uzbekinvest” takes the top position among all insurance companies in Uzbekistan.
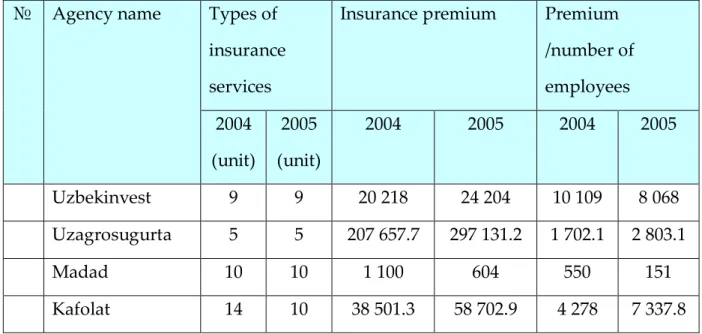
Table 2.6 Market share and types of insurance service
№ Agency name Types of
insurance services
Insurance premium Premium
/number of employees 2004 (unit) 2005 (unit) 2004 2005 2004 2005 Uzbekinvest 9 9 20 218 24 204 10 109 8 068 Uzagrosugurta 5 5 207 657.7 297 131.2 1 702.1 2 803.1 Madad 10 10 1 100 604 550 151 Kafolat 14 10 38 501.3 58 702.9 4 278 7 337.8
In this information you can learn:
• The premium of insurance company “Agrosugurta” has increased by 43%
comparing that of 2004 with 2005. The companies closed some sectors giving a low income and lessen the number of the officials. The premium per official has increased by 64% comparing with the result gained in 2004. The main premium was acquired through obligatory insuring agricultural sectors.
• The premium of “Uzbekinvest’ has increased by 19.7% comparing with the result gained in 2004. Unfortunately, the premium per official has decreased by 20.2%. The main premium was acquired through insuring the property of a legal entity and a population. While we were having a questionnaire with the leaders of both companies and banks, we noticed that they have much confidence for the future. In short, the main profit came from insuring the pledge and property which were taken as pledges for loans in banks.
• The premium of “Kafolat” has increased to 52.5% comparing with the result of 2004. The premium per official has increased to 71.5%. More than 80% of the premium was gained through insuring the pledge and civil responsibilities of transport owners. As the officials of the bank state the main reason for choosing “Kafolat” is a low tariff rate.
• The activity of “Madad” insurance company went down in 2004.
Analyzing the premium insurance, we found out that premium was mainly gained through insuring crops and harvests against natural disasters, insuring the pledge which deposited in the bank and insuring building constructions obligatorily.
Officials of “Ishonch” said: “Although there are four insurance companies in the region we regarded “Kafolat” and “Uzbekinvest” as our main competitors because these two agencies can be competitors to us with lots of parameters such as the number of officials, the premium, business area and types of insurance. The fact is that they work in the banking sector and insure the objects that we also focus on”.
For analyzing the competitiveness of “Ishonch”, we used the estimation list offered by N. Paley, 1989. As he notes each factor is estimated from “0” to “5” on which “0” means weaknesses and “5” means strength of the position. As he states if you have lack of information you can leave it out.
In practice, for that kind of analysis qualified specialists are hired. So, we analyzed it with the help of the specialists of the “Association of the Jizzak Banks”. We think that we were able to submit a conclusion close to a reality.
We marked the competitors as following: A: Uzagrosugurta
B: Uzbekinvest C: Kafolat D: Madad
Table 2.7 Our score for insurance companies
Factors of competitiveness «Ishonch» A B C D Service quality Price Promotion 3 2 2 2 2 3 4 3 4 3 4 3 1 2 2 Total score 7 7 11 10 5
We put to “Uzbekinvest” high rate, because only this agency has got license to insure import-export objects while others are not capable to carry out these types of insurances. The service quality is high. They use up to date technology. They have good trained employees. As the prices are high we marked averagely 3. Advertising service is
organized properly. For example, brochures and calendars are designed very contemporarily.
The main advantages of “Kafolat” are a low price, flexibility of rates and high payment for agencies.
2.2 Analysis of people’s annual expenditures
We analyzed influence of population’s average annual income to their annual insurance expenditure in Jizzak region.
H0=Regression coefficients are not statistically significant. (Number of people and average
annual income of respondents do not influence to annual insurance expenditure).
H1=Regression coefficients are statistically significant. (Number of people and average annual
income of respondents both influence to annual insurance expenditure).
Statistical program SPSS (14 v.- special program recognized worldwide for working with statistical numbers -) is used to compute the correlation values and the regression coefficients.
The sample data-set is part of a study on insurance consumption in the 12 districts and 1 town of Jizzak region. The independent variables are the number of population (Number of people = X1), average annual income in sums (Average annual income of people= X2); the dependent variable is annual insurance expenditures in sums per person (Annual insurance expenditures=Y).
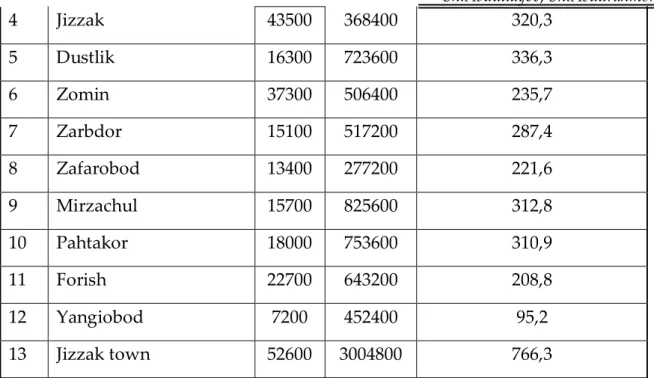
Table 2.8. Multiple regression analysis of Number of Population, and Average Annual Income, on Population Insurance Expenditures
№ Districts X1 X2 Y
1 Arnasoy 12400 501600 349,9
2 Bahmal 32600 433200 213,7
4 Jizzak 43500 368400 320,3 5 Dustlik 16300 723600 336,3 6 Zomin 37300 506400 235,7 7 Zarbdor 15100 517200 287,4 8 Zafarobod 13400 277200 221,6 9 Mirzachul 15700 825600 312,8 10 Pahtakor 18000 753600 310,9 11 Forish 22700 643200 208,8 12 Yangiobod 7200 452400 95,2 13 Jizzak town 52600 3004800 766,3
Source: Analytical department of Jizzak
We used the data from the program SPSS.
Table 2.9 Descriptive Statistics
Variable Mean Std Dev. N
Y 304.740 155.423 13
X1 24961.538 14139.103 13
X2 740123.077 698355.180 13
This is followed by the descriptive statistics (since we selected this option) for the dependent Y variable (listed first) then all independent X variables in order of columns of entry.
Table 2.10 Pearson Correlations
Pearson Correlations
Y X1 X2
Y 1,000 0,591 0,910
X1 0,591 1,000 0,540
Then, the matrix of correlation coefficients is given (since we selected this option) between the Y variable and all X variables.
Table 2.11 Significance for Pearson Correlations
Significance for Pearson Correlations
Y X1 X2
Y - 0,033 0,000
X1 0,033 - 0,057
X2 0,000 0,057 -
The probability levels for the correlations are given. We can see from this output that there is a significant correlation between the independent variable X2 and the dependent Y variable at P = 0.000, but not between the independent variable X1 and the dependent Y variable at P = 0.033, or the independent variable X1 and the independent X2 variable at P = 0.057.
Table 2.12 Summary
Summary
R2 R Adj. R2 S.E. of Estimate
0,842 0,918 0,811 67,620
The summary section first gives the r2 (0.842) which indicates that 84% of the variation
in Y is explained by variation in the independent X variables, and the r value (0.918) which is the square root of r2 and indicates a strong correlation between Y and the X
variables. The adjusted r2 value is r2 corrected for bias in sample size, and adjusts for
overestimation by r2 in the strength of the regression model, especially for complex
regressions with numerous independent variables; it adjusts the degrees of freedom for the r2 and is not necessarily increased by adding a further predictor (X), whereas r2 can
increase by adding another even poorly related predictor (X). The standard error of the estimate (67.620) is small compared to the mean Y value of 304,740, indicating that the
multiple regression model is explaining a large amount of the variance in the dependent Y variable.
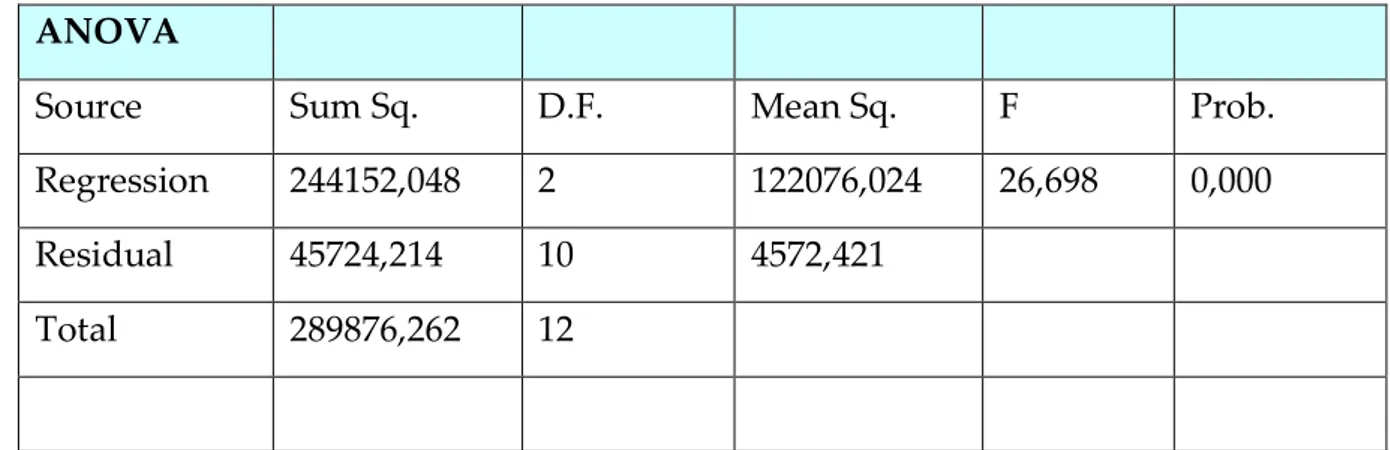
Table 2.13 ANOVA
ANOVA
Source Sum Sq. D.F. Mean Sq. F Prob.
Regression 244152,048 2 122076,024 26,698 0,000
Residual 45724,214 10 4572,421
Total 289876,262 12
The ANOVA section for the first step indicates the significance of the multiple regression models. The much larger mean square for the regression (122076.024) than the residual error (4572.421) indicates that the model is highly significant, as the F test from this ratio shows, with F(2,10)(Appendix 3) of 26.698 being significant at P = 0.000 (i.e. P is less than 0.001).
Table 2.14 Regression Coefficients Regression
Coefficients
Source Coefficient Std Error Std Beta -95% C.I. +95% C.I. t Prob.
Intercept 128,760 39,311 41,169 216,351 3,275 0,008
X1 0,002 0,002 0,141 -0,002 0,005 0,942 0,368
X2 0,000 0,000 0,834 0,000 0,000 5,589 0,000
The final part of this section gives the regression coefficients i.e. the equation is Y=128.760+0.002X1+0.000X2
This equation can be used to calculate the predicted Y value for each case. The standard errors of the regression coefficients are also given, from which the 95% confidence limits can be calculated, and the significance of the regression coefficient is determined by a
t-test. For example, for X1 the multiple regression coefficient is -0.002 ± 0.002 and ranges from its -95% confidence limit of -0.002 to its +95% confidence limit of +0.005; the t-value for this coefficient of 0.942 is significant, with P = 0.368. In contrast, the coefficient for X2 of 0.000 (0.000) ranges from -0.000 to + 0.000 and is significant since t = 5.589 with P = 0.000. Note also that the constant term 128.760 (± 39311) is only just significant (t = 3.275 with P=0.008).
This section also gives the standardized partial regression coefficients (beta's), which indicate the relative importance of each independent variable; variables with a high standardized partial regression coefficient are relatively more important than variables with a lower standardized partial regression coefficient. For example, the standardized partial regression coefficient for X2 is the highest (0.834) and that of X1 is the lowest (0.141) which, as we have just seen corresponds well with the probability levels for X1 (0.000) and X1 (0.368).
The inclusion of the two independent variables correlates well with population’s insurance expenditures(R=0,842). The R2 of 0.842 indicates that about 84 percent of the
variation in population annual insurance expenditures for this sample is explained by population’s annual income, and population size.
Decision: We reject the Ho hypothesis because we found out that independent
variables influence annual insurance expenditure. We conclude that annual insurance expenditures of people strongly depend on their annual income.
2.3 Analysis of consumer behavior to insurance service Data collection
There are 12 districts in Jizzak. We divided these 12 districts into two groups. The reason why we divided into two is because their geographical location, the number of population, telecommunication, production, local business and the average salary of population.
We put the regions with more population, higher average salary, more developed telecommunication system and business infrastructure into the first group. They are Jizzak town, Zomin and Gallaorol regions. According to statistic information, JIzzak region has 1047.3 million people and almost 70% of them live in rural areas and they heavily depend on Agriculture. About 550 thousand people live in Jizzak town, Gallaorol and Zomin regions. The centre of these districts is close to international M39 road and telecommunication and business infrastructure is well developed. According to information given by department of statistics the average monthly income is 77 917.7 sum per whole region and about 100 000 sum per group ones’ districts.
We put the rest of districts to group two (Yangiobod, Baxmal, Forish, Dustlik, Paxtakor, Arnasoy, Zarbdor, Zafarobod and Mirzachul) with population about 500 thousand whole together. The average monthly income in these regions is equal to 45 000 sum. Of course, there are exceptions in statistic information, because it’s hardly possible to live with this income.
We chose first group as good places to do insurance business.
According to the statistic information we preferred not to analyze the second segment of our thesis. In our opinion it won’t bring foundation to do insurance business in the near future.
Attendance in this research from Jizzak city consisted of 400 people, 378 of them gave complete answers to the question, and 22 of them didn’t want to answer. The
respondents’ ages were 18 and up. The number of questions was 8 and they were all open-end. The questions in the application were about applicants’ information as his age, gender, and education, the average of the income, their opinion about insurance services. With that information we would be able to find out what part of the population know about insurance companies and the factors why they are against about insurance services? These are the reasons why we have chosen this topic and our purpose is to learn the information from gathered documents. We analyzed the client’s relations to insurance services in our first group. We consider that the more participants in application procedure the closer the result to reality. But as Kotler (1997) described in his theory it is possible to get a good result even the number of participants is less than 1% of whole population.
We communicated with participants by talking on the phone in districts where telecommunication is developed. As Kotler (1997) said an advantage of telecommunication in that it is fast & cheap, but disadvantages are to have a short interview and it’s hard to get an answer for your complicated questions. For instance, it’s difficult to interview about income of the company, clients, and directors as well. As Kotler states survey research methods bets suited for descriptive research.
Companies undertake surveys to learn about people’s knowledge, preferences, and to measure these magnitudes in the general population.
We created application form (Appendix 1) to collect information.
Frequencies
A=Gender B= Age C=Education
D=Monthly income of respondent's E=Are you insured?
F=Do you have sufficient income to be insured? G=Is insurance reasonable
Table 2.15 Statistics A B C D E F G H N Vali d 378 378 378 378 378 378 378 378 Miss ing 0 0 0 0 0 0 0 0 Mean 1,34 1,86 1,40 1,16 1,94 1,85 1,82 1,99 Std. Error of Mean ,024 ,035 ,025 ,019 ,012 ,018 ,036 ,033 Median 1,00 2,00 1,00 1,00 2,00 2,00 2,00 2,00 Mode 1 2 1 1 2 2 2 2 Std. Deviation ,476 ,675 ,490 ,366 ,239 ,358 ,701 ,635 Variance ,226 ,455 ,240 ,134 ,057 ,128 ,491 ,403 Skewness ,660 ,176 ,423 1,875 -3,689 -1,959 ,260 ,009 Std. Error of Skewness ,125 ,125 ,125 ,125 ,125 ,125 ,125 ,125 Kurtosis -1,573 -,812 -1,830 1,525 11,669 1,849 -,951 -,504 Std. Error of Kurtosis ,250 ,250 ,250 ,250 ,250 ,250 ,250 ,250 Range 1 2 1 1 1 1 2 2 Minimum 1 1 1 1 1 1 1 1 Maximum 2 3 2 2 2 2 3 3 Sum 508 703 528 438 733 699 689 752 Percentil es 10 1,00 1,00 1,00 1,00 2,00 1,00 1,00 1,00 20 1,00 1,00 1,00 1,00 2,00 2,00 1,00 1,00 25 1,00 1,00 1,00 1,00 2,00 2,00 1,00 2,00 30 1,00 1,00 1,00 1,00 2,00 2,00 1,00 2,00 40 1,00 2,00 1,00 1,00 2,00 2,00 2,00 2,00 50 1,00 2,00 1,00 1,00 2,00 2,00 2,00 2,00 60 1,00 2,00 1,00 1,00 2,00 2,00 2,00 2,00 70 2,00 2,00 2,00 1,00 2,00 2,00 2,00 2,00 75 2,00 2,00 2,00 1,00 2,00 2,00 2,00 2,00 80 2,00 2,00 2,00 1,00 2,00 2,00 2,00 2,00 90 2,00 3,00 2,00 2,00 2,00 2,00 3,00 3,00
Table 2.16 Respondents’ gender Frequency Percent Valid Percent Cumulative Percent Valid male 248 65,6 65,6 65,6 female 130 34,4 34,4 100,0 Total 378 100,0 100,0
Frequency Table arrays data with columns for frequency, percent, valid percent, and cumulative percent. That describes of gender classification of respondents. As Table 2.16 shows, males participate in survey more than female. The male percentage is 65.6% and the female percentage is 34.4%.
Figure 1 Respondents’ gender
A histogram of respondents’ classification by gender is shown in Figure 1. The first column lists the number of males within interval. The second column lists the number of females within interval. A normal curve on the histogram provides an indication of respondents from normality.
2,4 2,1 1,8 1,5 1,2 0,9 0,6 respondent's 300 200 100 0 Frequency Mean =1,34 Std. Dev. =0,476 N =378
Table 2.17 Age of respondents Frequency Percent Valid Percent Cumulative Percent Valid under 25 116 30,7 30,7 30,7 26-45 199 52,6 52,6 83,3 46-over 63 16,7 16,7 100,0 Total 378 100,0 100,0
Frequency Table arrays data with columns for frequency, percent, valid percent, and cumulative percent. That describes of age classification of respondents. The respondent’s percentage, whose age is under 25, is 30.7%, whose age is between 26-45, is 52.6%, and whose age is over 46 is 16.7%. As Table 2.17 shows, whose age is between 26-45 participate in survey more than others.
Figure 2 Age of respondents
A histogram of respondents’ classification by age is shown in Figure 2. The first column lists the number of respondents whose age is under 25 within interval. The second column lists the number of respondents whose age is 26-45 within interval. The third column lists the number of respondents whose age is over 46 within interval. A normal
3,5 3 2,5 2 1,5 1 0,5 age of respondent's 250 200 150 100 50 0 Frequency Mean =1,86 Std. Dev. =0,675 N =378 age of respondent's
Table 2.18 Education Frequency Percent Valid Percent Cumulative Percent Valid graduated 228 60,3 60,3 60,3 high school 150 39,7 39,7 100,0 Total 378 100,0 100,0
Frequency Table arrays data with columns for frequency, percent, valid percent, and cumulative percent. That describes of age classification of respondents. The respondent’s percentage, who graduated is 60.3%, and who completed high school is 39.7%. As Table 2.18 shows, who graduated colleges in survey more than who completed high schools.
Figure 3 Education
A histogram of respondents’ classification is shown in Figure 3. The first column lists the number of respondents who graduated within interval. The second column lists the number of respondents who completed high school within interval. A normal curve on the histogram provides an indication of respondents from normality.
2,4 2,1 1,8 1,5 1,2 0,9 0,6 education 300 200 100 0 Frequency Mean =1,4 Std. Dev. =0,49 N =378 education
Table 2.19 Monthly incomes of respondents Frequency Percent Valid Percent Cumulative Percent Valid under 50000 sum 318 84,1 84,1 84,1 over 50000 sum 60 15,9 15,9 100,0 Total 378 100,0 100,0
Frequency Table arrays data with columns for frequency, percent, valid percent, and cumulative percent. That describes of income classification of respondents. The respondents’ percentage, who earned under 50000 sum is 84.1%, and who earned over 50000 sum is 15.9%. As Table 2.19 shows, who earned under 50000 sum in survey more than who earned over 50000 sum.
Figure 4. Monthly income of respondents
are you insured?
A histogram of respondents’ classification by its income is shown in Figure 4. The first column lists the number of respondents who earned under 50000 sum within interval. The second column lists the number of respondents who earned over 50000 sum within interval. A normal curve on the histogram provides an indication of respondents from
2,4 2,1 1,8 1,5 1,2 0,9 0,6
monthly income of respondent's
500 400 300 200 100 0 Frequency Mean =1,16 Std. Dev. =0,366 N =378 monthly income of respondent's
normality.
Table 2.20 “Are you insured?”
Frequency Percent Valid Percent Cumulative Percent Valid Yes 23 6,1 6,1 6,1 No 355 93,9 93,9 100,0 Total 378 100,0 100,0
Frequency Table arrays data with columns for frequency, percent, valid percent, and cumulative percent. That describes respondent’s classification who is insured or not. The respondent’s percentage, who is insured, is 6.1%, and who is not insured is 93.9%. As it is shown on the Table above, insured people in survey more than who is not insured.
Figure 5“Are you insured?”
A histogram of respondents’ classification is shown in Figure 5. The first column lists the number of insured respondents within interval. The second column lists the number of respondents who is not insured within interval. A normal curve on the histogram provides an indication of respondents from normality.
2,4 2,1 1,8 1,5 1,2 0,9 0,6
are you insured?
600 400 200 0 Frequency Mean =1,94 Std. Dev. =0,239 N =378