Project in Biology: 15p
Inhibition of SIRT1 Alters Apoptotic and Sex related genes in Zebrafish (Danio rerio)
Kim Aarseth Larsson 2014-01-26 Supervisor: Professor Per-Erik Olsson
1 CONTENTS ABSTRACT……….. .2 SAMMANFATTNING ……….3 1. INTRODUCTION ………4 1.1 SIRT1………. .4 1.2 SIRT1 in Zebrafish ………..………..…………6 1.3 EX-527………...………..6
1.4 Zebrafish sex differentiation ………..………...7
1.5 Aim of the study………...……...7
2. MATERIAL AND METHODS……… ……8
2.1 Zebrafish maintenance and breeding………..………….8
2.2 Molecular phylogenetic study ...………8
2.3 Computational modeling ………...9
2.4 Exposure of zebrafish ………9
2.5 RNA extraction and qRT-PCR ………9
2.6 Western Blot analysis………10
2.7 Statistical analysis……….10
3. RESULT AND DISCUSSION……… ……10
3.1 The catalytic domain of sirt1 is conserved ………10
3.2 Exposure to EX-527 down-regulates sex related genes in larval and juvenile zebrafish………..12
3.3 Exposure to EX-527 up-regulates apoptotic related genes in larval and juvenile zebrafish………..14
3.4 Exposure to EX-527 causes malformations and higher mortality………...16
3.5 EX-527 exposure does not affect sex ratio ……….17
4. CONCLUSION……… 18
AKNOWLEDGEMENTS……….. 19
REFERENCES……… 20
2 ABSTRACT
Sirtuin 1 (SIRT1) is a nicotinamide adenine dinucleotide - dependent deacetylase that belongsto the sirtuin protein family. The protein has been linked to both cancer through its effect onp53 and age related illnesses through its effect on peroxisome proliferator-activated receptorgamma (PPAR-γ). Recent data have shown a correlation between SIRT1, male fertility andspermatogenesis. Because the mechanism of sex differentiation in zebrafish is still not wellunderstood the sirt1 gene is an attractive target to study in order to improve our understandingof this topic. Zebrafish of different age were exposed to various concentrations of EX-527 toinhibit the SIRT1 protein. This was followed by qRT-PCR analysis of apoptotic and sex-related genes. Both apoptotic and sex-related gene expression levels were affected by theexposure. There were differences in genes that were affected, both between the concentrationsof EX-527, and between the ages of the exposed zebrafish. The male- specific gene sexdetermining region Y box 9A (sox9a) was down-regulated at both studied EX-527concentrations in both zebrafish larvae and juveniles. The exposure of the EX-527 resulted inno significant difference in sex-ratio. Further studies are required to describe the pathway forSIRT1 gene regulation in zebrafish
3 SAMMANFATTNING
Sirtuin 1 (SIRT1) är ett nicotinamide adenine dinucleotide-beroende deacetylas som till hör proteinfamiljen sirtuiner. Proteinet har kopplats till både cancer genom sin effekt på p53 och åldersrelaterade sjukdomar genom sin effekt på PPAR-γ (Peroxisome Proliferator-Activated Receptor gamma). Ny data har även visat ett samband mellan SIRT1, manlig fertilitet och spermatogenes. Då mekanismen för sexdifferentiering hos zebrafiskar fortfarande inte är väl förstådd är sirt1 genen ett intressant mål att studera för att öka förståelsen kring detta ämne. Zebrafiskar av olika ålder exponerades för olika koncentrationer av EX-527 för att inhibera SIRT1 proteinet. Därefter gjordes qRT-PCR analys av apoptotiska och sexrelaterade gener. Både apoptotiska och sexrelaterade geners utrycksnivåer påverkades av exponeringen. Vilka gener som påverkades och hur, skiljde sig i de flesta fall både mellan koncentrationerna av EX-527 som de utsatts för, och mellan åldern på zebrafiskarna. Den han-specifika genen
sox9a (sex determining region Y box 9A) var nedreglerad i båda undersökta EX-527
koncentrationerna hos både zebrafiskar i larvstadiet och hos juvenila. Exponeringen av EX-527 gav ingen signifikant skillnad av könskvoten. Vidare studier krävs för att kunna beskriva signalvägen för SIRT1 genreglering i zebrafiskar.
4 1. INTRODUCTION
1.1 Sirtuin1
Sirtuin 1 (SIRT1) is a deacetylating sirtuin protein that has been linked to tumor, metabolic and age related diseases. As a deacetylating protein it targets histones. The histone targets of SIRT1 are histones H1, H3 and H4 (Vaquero et al. 2004). Deacetylation of histones makes the proteins bind closer to the DNA, thus preventing transcriptions of genes under its control. SIRT1 also acts as a regulator of a wide variety of non-histone proteins. By binding to p53 and deacetylate the protein, SIRT1 reduces its potency to act in the p53-dependent apoptotic pathway (Luo et al. 2001; Vaziri et al. 2001). Peroxisome proliferator-activated receptor gamma (PPAR-γ) is down-regulated by SIRT1 which leads to fat mobilization in white adipose tissue suggesting an involvement in increase of life expectancy (Picard et al. 2004). Longlivety as an effect of up-regulated silence information regulator 2 (SIR2), an ortholog to SIRT1, has been reported in S. cerevisiae as well as Drosophilia (Hoffmann et al. 2013;
Kaeberlein et al. 1999). This makes it an attractive target for drug treatment of cancer and
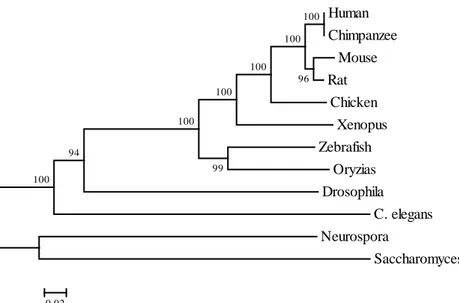
age-related diseases. Human Chimpanzee Mouse Rat Chicken Xenopus Zebrafish Oryzias Drosophila C. elegans Neurospora Saccharomyces 100 94 99 100 100 100 100 96 100 0,02
Figure 1. Evolutionary relationship of Sirt1 between species. The evolutionary history was inferred using the Neighbor-Joining method. The optimal tree with the sum of branch length = 1,77326389 is shown. The percentage of replicate trees in which the associated taxa clustered together in the bootstrap test (1000 replicates) are shown next to the branches. All positions containing gaps and missing data were eliminated. Evolutionary analyses were conducted in MEGA5 (version 5.2).
5
The sirtuin genes are a highly conserved family of genes which are unique in their mechanism of deacetylation. In mammal there are seven sirtuins, SIRT1-7, whereas yeast only have one, the SIR2, which was the first sirtuin to be described (Rine et al. 1979). The proteins binds NAD+ which cleaves the nicotinamide and transfers the acetyl group from the target protein to the cleaved NAD+, thus leading to a formation of O-acetyl-ADP-ribose (Landry et al. 2000). SIRT1 acts as a regulator of a wide variety of genes. The protein contains four major domains that span over 747 amino acids, an N-terminal domain, an allosteric site, a catalytic core, and a C-terminal domain (Autiero et al. 2009). The N- and C-terminal domains do not have any large alpha or beta structures giving them a flexible structure that is necessary for the protein to function (Autiero et al. 2009).
SIRT1 has been showed to interact with NFκB and that increased levels of SIRT1 in ovarian cells lead to down-regulation of NFκB (Pavlova et al. 2013). In zebrafish, activation of NFκB leads to female biased population (Pradhan et al. 2012). Recent data shows that SIRT1 is involved in spermatogenesis and male fertility, indicating that SIRT1 is a sex related gene. Knock-down of SIRT1 in mice results in abnormal spermatogenesis and reduced fertility of male mice (Coussens et al. 2008; Seifert et al. 2012). The mechanism of how SIRT1 affects this is unknown and further studies are needed to understand how SIRT1 affects fertility, and if it plays a role in sex differentiation.
Figure 2. Human SIRT1 domains. Schematic figure of the domains of human SIRT1. Numbers in each section indicates amino acids the domain extends over. The length of each section is proportional to the number of amino acids belonging to the domain it represents. N- and C-terminals are flexible regions which are essential for the protein to function (Autiero, 2009).
6 1.2 SIRT1 in Zebrafish
There is very little published research on the function of SIRT1 in zebrafish even though zebrafish have been shown to be a good model for studying SIRT1 (Pereira et al. 2011). It has been showed in zebrafish that SIRT1 acts as a regulator in endothelial angiogenesis and is essential for normal postnatal vascular growth (Guarani et al. 2011; Potente et al. 2007). Transcription levels of sirt1 mRNA have been showed to be reduced in the brain of zebrafish when the fish are exposed to hypoxia and it has thus been suggested that SIRT1 is involved in the brain response to oxygen scarcity (Zakhary et al. 2011). Hypoxia has also been shown to affect the sex ratio of zebrafish, increasing the percentage of males (Shang et al. 2006), showing a possible pathway for SIRT1 to affect sex ratio (Figure 3).
1.3 EX-527
Indole EX-527 (6-Chloro-2,3,4,9-tetrahydro-1H-carbazole-1-carboxamide9) is an inhibitor of SIRT1 that has a 100-fold higher affinity towards SIRT1 than any of the other sirtuins (Napper et al. 2005). The mechanism of inhibition is not fully understood. However, it has been suggested that it is achieved by EX-527 binding to NAD+ and two pockets in the catalytic domain of the SIRT1 protein, thereby preventing the release of the enzymatic coproduct 2’-O-acetyl-ADP ribose and thus inhibiting further enzymatic reactions (Gertz et al. 2013).
Figure 3. Possible link between SIRT1 and male sex ratio. Hypoxia has been shown to cause an increase of male sex ratio thru increased apoptosis (Shang et al. 2006). It has also been showed in zebrafish brain cells that hypoxia leads to a reduction of sirt1 mRNA levels (Zakhary et al. 2011). Down-regulation of SIRT1 has been showed to an increase in apoptosis.
7 1.4 Zebrafish sex differentiation
Sex differentiation in zebrafish remains elucive. Male zebrafish follow the same development path as females during the early stage of gonad differentiation, developing juvenile ovaries (Takahashi 1977; Wang et al. 2007). In males around 15–19 days post fertilisation (dpf) the juvenile ovaries start to undergo apoptosis and transform into testes whereas in females they continue to develop into mature ovaries (Pradhan et al. 2012; Uchida et al. 2002). Blocking apoptosis in the juvenile ovaries through activation of NFκB has been shown to yield female biased populations (Pradhan et al. 2012).
Mammals have sex chromosomes that determine the sex through the presence or absence of the sex determening box y (sry) gene. No such sex chromosomes or master regulator of the sex-genes have been reported in zebrafish (Sekido and Lovell-Badge 2008; Traut and Winking 2001; Wallace and Wallace 2003). The genes downstream of Sry in mammals are conserved in zebrafish and function in similar ways as in mammals (Orban et al. 2009; Rodriguez-Mari et al. 2005; Siegfried and Nusslein-Volhard 2008; Sreenivasan et al. 2013). Environmental factors such as hypoxia, thermal cycling and temperature have been showed to have an effect on the sex differentiation process (Ospina-Alvarez and Piferrer 2008; Shang et al. 2006; Villamizar et al. 2012). However, while these enviromental factors do effect the sex ratio they do not appear to determine the sex of the zebrafish since they do not show a total control of the sex ratio, complicating the system further.
1.5 Aim of the study
The role of SIRT1 in zebrafish (Danio rerio) is not well understood. Studying the role of SIRT1 in zebrafish may give a better understanding of the function of thee gene and reveal if it is involved in sex differentiation.
The purpose of this study was to examine if inhibition of SIRT1 would affect the sex differentiation process in zebrafish and if it would affect the expression of apoptotic and sex related genes.
8 2. MATERIAL AND METHODS
2.1 Zebrafish maintenance and breeding
For all the experiments transgenic vas::EGFP zebrafish were used (Krøvel, 2002). The transgenic zebrafish express EGFP in the female germline while in male the transcript is degraded. This makes it possible to determine sex of the zebrafish at 50 dpf.
Adult zebrafish were maintained in a recirculating system (Aquaneering, USA) with a 14-h light/10-h dark cycle. The fish were fed twice a day with newly hatched Artemia salina
nauplii and commercial flake food (Tetrarubin) (Larval AP 100). Juvenile fish were fed with
smaller commercial flake food (Larval AP 100). The male and female brooders were kept in separate aquaria at 25 ± 1° C and were allowed to breed once a week in mating containers (Aquaneering, USA). Collected eggs where kept at 28° C. At 4 dpf the juveniles were transferred to the circulating system. The water flow was adjusted to 20–30 drops/min, 14-h light/10-h dark cycle. The fish handling procedures were approved by the Swedish Ethical Committee in Linköping (Permit 32-10).
2.2 Molecular phylogenetic study
Protein sequences were used in the homology alignment and construction of the phylogenetic tree had the following accession numbers: NP_036370.2 for human, XP_003312628.1 for chimpanzee, NP_062786.1 for mouse, XP_003753523.1 for rat, NP_001004767.1 for chicken, NP_001091195.1 for xenopus, XP_001334440.4 for zebrafish, XP_004077552.1 for oryzias, NP_477351.1 for drosophila, NP_001255485.1 for C. elegans, XP_960372.1 for neurospora and NP_014573.1 for saccharomyces. Homology alignment of the sequences was achieved using the MEGA5 (version 5.2) software (Tamura et al. 2011).
The MEGA5 program was used to construct a phylogenetic tree using the Neighbor-Joining method to infer the phylogenetic relations between the sequences (Saitou, 1987). A bootstrap test (1000 replicates) was performed. Evolutionary distances were calculated using the p-distance method. Positions containing gaps and missing data was deleted.
9 2.3 Computational modeling
Molecular modeling was performed using the Molecular Operating Environment (MOE 2012.10) software. Crystal structure of human SIRT1 catalytic domain was obtained from the Protein Data Bank (PDB). PDB identification code of the crystal structure is 4I5I. Structure preparation of 4I5I was performed before it was used as template for homology modeling of zebrafish SIRT1 catalytic domain. The Amber99 force field was used during homology modeling of the zebrafish SIRT1 catalytic domain (Summa and Levitt 2007). NAD+, EX-527 and water molecules were included in the calculation of homology.
2.4 Exposure of zebrafish
Freshly fertilized eggs were collected in the morning and transferred into 6 well plates (BD Falcon, USA) with 40 eggs in each well. They were exposed to one of the following concentrations of EX-527 (Tocris Biosciences, UK); 0.1 µM, 1 µm or 10 µM. The exposure lasted for 144 hr. The number of hatched and dead fish was counted every day. The eggs were kept at 25 ± 1° C. At 72 h post fertilization 24 samples from each well was snap-frozen in liquid nitrogen. The samples were stored in -80° C until further use. At the end of the exposure the fish were studied for morphological changes.
Fifteen days old zebrafish were divided into groups of 25 and transferred into 115-mm crystallization beakers containing 100 ml of water in which they were exposed to either 0.1 µM or 1 µm of EX-527. They were kept at 25 ± 1° C. Fifty percent of the water was changed every other day. EX-527 was added to maintain the initial concentration. After two and six days of exposure fish were collected and snap-frozen in liquid nitrogen and stored in -80° C until further use.
2.5 RNA extraction and qRT-PCR
All samples were homogenized in 400 µl of TRI-Reagent (Sigma, USA) and RNA was isolated using the manufacturer’s instruction. Synthesis of cDNA was done using qScript cDNA synthesis kit (Quanta Bioscience, USA). cDNA was stored in -20° C until further use. Primers used in qRT-PCR were designed for listed genes (Table 1). SYBR Green (KapaBiosystems, USA) was used to determine the transcription levels of all genes. Thermocycling conditions for SYBR Green were 95° C for 2 s and 60° C for 30 s. elongation
10
using the standard curve method (Schmittgen and Livak 2008)). qRT-PCR analysis was done for the listed genes (supplementary Table S1).
2.6 Western Blot analysis
Samples of the juvenile zebrafish exposed for two days were homogenized in radioimmune precipitation assay buffer (150 mM NaCl, 1.0% Triton X-100, 0.5% sodium deoxycholate, 0.1% SDS, 50 mM Trizma base, pH 8.0). Protein concentration was estimated using Bradford reagent (Bio-Rad). 30 µg of each sample was loaded into a 10% SDS-PAGE. The protein was then transferred to a PVDF membrane (Amersham Bioscience) using a transfer cassette and transfer buffer (25mM Tris base, 192mM Glycine, 20% Methanol). The membrane was incubated for 1 h in Tris-buffered saline containing 0.1% Tween to prevent nonspecific binding. Thereafter the membrane was probed with anti-SOX9A antibodies (AnaSpec) at 1:500 dilution and incubated at 4° C overnight. The HRP-conjugate anti-rabbit IgG (Amersham Bioscience) was used at a 1:3000 dilution for 2 h, and the immunoreactive complex was detected using Super Signal West Pico chemiluminescent substrate (Thermo Scientific). The membrane was then stripped and probed with β-actin antibody (Sigma) at 1:5000 dilution for 2 h. The HRP-conjugate anti-mouse IgG (Amersham Bioscience) was used at a 1:3000 dilution for 2 h. The bands were quantified using the ImageJ software (National Institute of Health) and normalized after respective β-actin level.
2.7 Statistical analysis
Statistical significance was determined using one way ANOVA followed by Dunnett posttest. Differences in values were considered significant if the p values were less than 0.05 (*p < 0.05, ** p < 0.01, ** p < 0.001). Statistical analyses were performed using GraphPad Prism 5 software (GraphPad Software, USA).
3. RESULT AND DISCUSSION
3.1 The catalytic domain of SIRT1 is conserved
During the evolutionary history of SIRT1 (Figure 1) the human SIRT1 has evolved further than the zebrafish SIRT1. The zebrafish SIRT1 gene shows highest homology to other teleost
11
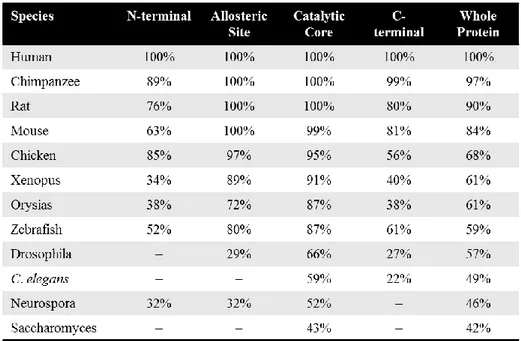
genes and is evolutionary separated both from the ancestral genes of the avian and mamalian counterparts (Table 1). The catalytic core of SIRT1 has been conserved to a much higher degree than the N- and C-terminal regionas (Figure 2). A computional homology model of the catalytic domain of zebrafish SIRT1 was constructed and showed high structural similarity to the catalytic domain of human SIRT1 (Figure 4).
Table 1. Homology of SIRT1 between species. Identies of amino acids between species shown in procentage, (-) indicates that there is no siqnificant identities. The Catalytic and allosteric domains are more conserved than the N- and C-terminal. The catalytic core of the zebrafish SIRT1 is similar in protein sequence to the catalytic core of human SIRT1 suggesting similarity in structure.
12
3.2 Exposure to EX-527 down-regulates sex related genes in larval and juvenile zebrafish
Zebrafish exposed to EX-527 from the embryonic stage until the larval stage were analyzed though qRT-PCR. The results showed a down-regulation of sex determining region Y box 9A
(sox9a) as a result of the exposure (Figure 5A). SIRT1 treatment on human nucleus pulpus
cells have interestingly been reported to cause a down regulation of sex determining region Y
box (sox9) mRNA levels (Zhang et al. 2011). It is however some difficulty to compare these
studies since one type of cell was analyzed, in comparison to whole zebrafish. The down regulation of sox9a did not affect the anti-müllerian hormone (amh) mRNA levels (supplementary Figure S1A) suggesting that SOX9A protein levels may not be significantly changed.
The mRNA levels of doublesex and mab-3 related transcription factor 1 A (dmrt1a) and
prostaglandin D2 synthase (ptgds) were down-regulated in the exposed larval zebrafish
(Figure 5B-C). If inhibition of SIRT1 leads to lower levels of doublesex and mab-3 related transcription factor 1 (DMRT1) in the testis it could explain SIRT1’s importance for normal spermatogenesis (Coussens et al. 2008; Seifert et al. 2012). DMRT1 has a negative control Figure 4. Zebrafish homology model. Homology model of SIRT1 catalytic domain in zebrafish (B) made with using human SIRT1 catalytic domain (A) as template. Alpha helices are shown in red color, beta sheets in yellow, blue segments indicate a turn and white are loops. The homology model suggests a very structural likeness between the human and zebrafish catalytic domains.
13
over retionic acid (RA) and stimulated by retinoic acid (STRA) proteins, hindering spermatogonia to prematurely enter the transition to spermatocyte (Matson et al. 2010). It is difficult to speculate if the down-regulation of ptgds mRNA levels had any effect on RA levels since there is no documented data on the role of PTGDS in the signaling pathway of RA, however PTGDS is a transporter for lipophilic molecules such as RA (Yeh and Wang 2006).
In exposed larval zebrafish dmrt1a was down-regulated (Figure 5B). However, there was no significant down-regulation of dmrt1a in the juvenile zebrafish (supplementary Figure 2F).
ptgds was also down-regulated in larval zebrafish but only at 0.1 µM concentration of EX-527
(Figure 5C). These genes were not regulated in exposed juvenile zebrafish but a down-regulation of amh was observed at 1 µM concentration of EX-527 (Figure 6B). Interestingly enough a down-regulation of estrogen receptor alpha (erα) and estrogen receptor beta B
(erβb) was also observed at the same concentration (Figure 6C-D). Inhibition of SIRT1 has
been reported to down-regulate transcription of erα and lead to phosphorylation of ERα which have been shown to lead to breast cancer cell proliferation even in the absent of estrogen (Moore and Faller 2013; Yao et al. 2010).
In exposed larval zebrafish and in juvenile zebrafish exposed for two days showed down-regulated levels of sox9a mRNA. Interestingly, Juvenile zebrafish that were exposed for seven days did not show any down-regulation of sox9a mRNA levels (supplementary Figure 3I). This could indicate that a compensatory mechanism is involved and return the mRNA levels back to normal.
sox9a C 0.1 µM 1 µM 0.0 0.5 1.0 1.5 2.0 2.5 * * R e la ti ve e x p re ss io n dmrt1a C 0.1 µM 1 µM 0.0 0.5 1.0 1.5 2.0 2.5 * * R e la ti ve e x p re ss io n ptgds C 0.1 µM 1 µM 0 1 2 3 * R e la ti ve e x p re ss io n A B C
Figure 5. Zebrafish larval 3 days exposure. Zebrafish embryos at 2 h post fertilisation were exposed to EX-527 (0.1 µM and 1 µM) for three days followed by qRT-PCR analysis of sox9a (A), dmrt1a (B), ptgds (C). One way analysis of variance was used to determine statistical significance (*p < 0.05, ** p < 0.01, ** p < 0.001). Error bars represent ± SD. n = 6.
14
3.3 Exposure to EX-527 up-regulates apoptotic related genes in larval and juvenile zebrafish
Analysis of zebrafish exposed to 0.1 µM EX-527 from 2 hours post fertilization (hpf) until 144 hpf showed an up-regulation of p53 and p21 (Figure 7A-B). Zebrafish larvae that were exposed to 1 µM EX-527 showed no up-regulation in apoptotic related genes (supplementary Figure 2). SIRT1 deacetylates p53 which hinders p53 nuclear translocation demoting p53 transcription and its target p21 (Yi and Luo 2010). This would explain the up-regulation of
p53 and p21 mRNA levels that were observed in the exposed larval zebrafish. It has been
reported that inhibition of SIRT1 leads to heightened levels of p53 mRNA and acytelated p53 (Nihal et al. 2013). Up-regulation of p53 and p21 indicates inhibition of cell proliferation and the down-regulation of mmp9 (target gene of β-catanin) further confirms that inhibition of SIRT1 in zebrafish modulates apoptotic-signaling pathways (Figure 7C). Up-regulation of apoptotic genes would suggest an increased male sex ratio. Even though apoptotic genes were up-regulated male sex specific genes were down-regulated. Several of the effects EX-527 had on gene regulation differed between larvae and juvenile stages
sox9a C 0.1 µM 1 µM 0 1 2 3 4 * * R e la ti ve e x p re ss io n amh C 0.1 µM 1 µM 0.0 0.5 1.0 1.5 2.0 * R e la ti ve e x p re ss io n er C 0.1 µM 1 µM 0.0 0.5 1.0 1.5 2.0 * R e la ti ve e x p re ss io n erb C 0.1 µM 1 µM 0.0 0.5 1.0 1.5 2.0 * R e la ti ve e x p re ss io n A B C D
Figure 6. Juvenile zebrafish 2 days exposure. In vivo analysis of gene transcription. Zebrafish at 15 dpf were exposed to 0.1 µM and 1 µM EX-527 for two days followed by qRT-PCR analysis of sox9a (A), amh (B), erα (C), erβb (D). One way analysis of variance was used to determine statistical significance (*p < 0.05, ** p < 0.01, ** p < 0.001). Error bars represent ± SD. n = 8.
15
In juvenile zebrafish exposed to 1 µM EX-527 p53 was up-regulated (Figure 8A) but p65 was also up-regulated (Figure 8B). It has been reported that introduction of SIRT1 cDNA in ovarian cells resulted in decreased levels of p65 (Pavlova et al. 2013). There were no changes in p21 and mmp9 mRNA levels (supplementary Figure S2L-M). It should be noted that it is not possible to say that the up-regulation of p53 and p65 mRNA levels takes place in the same tissue since whole organisms were used for qRT-PCR analysis.
p53 C 0.1 µM 1 µM 0.0 0.5 1.0 1.5 2.0 2.5 *** R e la ti ve e x p re ss io n p21 C 0.1 µM 1 µM 0.0 0.5 1.0 1.5 2.0 2.5 * R e la ti ve e x p re ss io n mmp9 C 0.1 µM 1 µM 0.0 0.5 1.0 1.5 2.0 2.5 * * R e la ti ve e x p re ss io n A B C p65 C 0.1 µM 1 µM 0.0 0.5 1.0 1.5 2.0 2.5 * R e la ti ve e x p re ss io n p53 C 0.1 µM 1 µM 0.0 0.5 1.0 1.5 2.0 2.5 * R e la ti ve e x p re ss io n A B
Figure 7. Zebrafish larval 3 days exposure. Zebrafish embryos at 2 h post fertilisation were exposed to EX-527 (0.1 µM and 1 µM) for three days followed by qRT-PCR analysis of p53 (A), p21 (B), mmp9 (C). One way analysis of variance was used to determine statistical significance (*p < 0.05, ** p < 0.01, ** p < 0.001). Error bars represent ± SD. n = 6.
Figure 8. Juvenile zebrafish 2 days exposure. In vivo analysis of gene transcription. Zebrafish at 15 dpf were exposed to 0.1 µM and 1 µM EX-527 for two days followed by qRT-PCR analysis of p53 (A), p65 (B). One way analysis of variance was used to determine statistical significance (*p < 0.05, ** p < 0.01, ** p < 0.001). Error bars represent ± SD. n = 8.
16
3.4 Exposure to EX-527 causes malformations and increased mortality
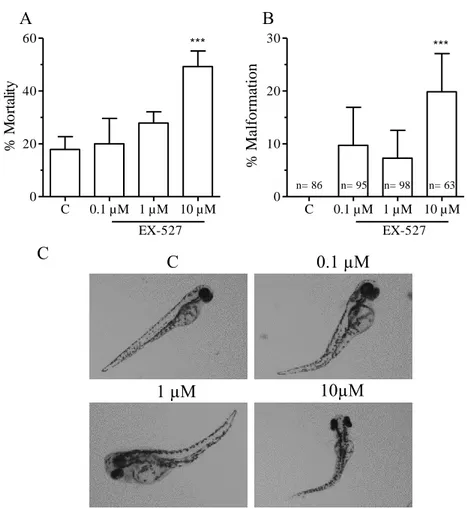
Zebrafish were exposed to EX-527 (0.1 µM, 1 µM and 10 µM) from 2 hpf until 144 hpf. Fish exposed to 10 µM EX-527 showed significant higher mortality than controls and those exposed to lower concentrations (Figure 9A). Most of the mortality occurred in the first 24 hpf. The surviving zebrafish were viewed for malformations. All exposure groups showed malformations with a sigificant increase in the group exposed to 10 µM EX-527 (Figure 9B). Both lateral spinal curvature (scoliosis) and upwards spinal curvature (lordosis) were observed in all exposed groups (Figure 9C).
C 10µM 1 µM 0.1 µM C B C 0.1 µM 1 µM 10 µM 0 10 20 30 EX-527 *** n= 86 n= 95 n= 98 n= 63 % A b n o rm al it y C 0.1 µM 1 µM 10 µM 0 20 40 60 EX-527 *** % M o rt al it y A % M al for m at ion
Figure 9. Morphological effects of exposure to 527. Zebrafish were exposed to EX-527 (0.1, 1 and 10 µM) from 2 – 144 hpf. Mortality was recorded until 144 hpf. Percentage of malformation was calculated (B). One way analysis of variance was used to determine statistical significance (*p < 0.05, ** p < 0.01, ** p < 0.001). Error bars represent ± SD. n = 140. Control and malformations were photographed at 96 hpf (C).
17 3.5 EX-527 exposure does not affect sex ratio
Zebrafish were exposed to EX-527 (0.5 µM) from 15 dpf until 40 dpf. Sex ratio was determined at 55 dpf by identifying the presence or absence of florescent germlines (Figure 10). The exposed population showed no significant difference of the sex ratio compared with the control group (Figure 10D).
In qRT-PCR analysis of larval zebrafish, most of the genes were up-regulated at 0.1 µM but down-regulation was observed at 1 µM (supplementary Figure S1). qRT-PCR analysis of juvenile zebrafish showed that several genes showed a correlation between concentration and up-regulation of mRNA and no significant changes were observed in the zebrafish exposed to Figure 10. No sex ratio effect of exposure to EX-527. Zebrafish were exposed to EX-527 (0.5 µM) from 15 dpf until 40dpf. In vas::EGFP zebrafish all embryos have maternal VAS::EGFP until at least 50 hpf (A). The zygotic transcription starts at gastrulation. At 50 dpf the sexes are fully developed and while all male zebrafish have stopped expressing
vas::EGFP in germcells (C) it continues to be transcribed and translated in female
germcells (B). Sex was determened at 55 dpf. There were no significant difference in the sex ratio between the exposed group and the controle (D).
18
0.1 µM EX-527 (supplementary Figure S2-3). This indicates that the concentration of 0.5 µM EX-527 was too low. Indicating that the concentrations of EX-527 exposed to zebrafish should be revisited to find concentrations that will yield more conclusive data.
4. CONCLUSION
Since protein levels have not been measured it is not possible to conclude that they have changed. A Western blot analysis was carried for SOX9A on juvenile zebrafish exposed for two days (supplementary Figure S4). It did show a lower level of SOX9A in the exposed zebrafish but the difference was not significant and the experiment should be repeated.
Regarding data that shows down-regulation of dmrt1a mRNA levels and that SIRT1 have been shown to be important for spermatogenesis in mice (Coussens et al. 2008) it would be interesting to examine the effect that exposure to EX-527 would have on spermatogenesis in zebrafish.
Up-regulation of apoptotic genes and down-regulation of estrogen receptor α and β as well as down-regulation of male specific genes were observed. Still there were no changes in the sex ratio. This could suggest that the effects that inhibition of SIRT1 counter-affect each other. Another explanation could be that since the qRT-PCR analyses were done on whole organisms it is not possible to say in which tissues the observed mRNA level changes took place. It is therefore possible that changes in ovarian and testis tissues are not well represented in the data.
Furthermor it is not possible to conclude if the differences in genes affected in the larval zebrafish compared to the juvenile zebrafish are the result of SIRT1 having different effects in the two life-stages. Further studies are needed to be able to conclude if SIRT1 may have different roles in different life-stages.
At the moment it is not possible to make conclusions what kind of role sirt1 plays in the sex development in zebrafish. In-depth knowledge is required to explain a comprehensive pathway of SIRT1.
19 AKNOWLEDGMENTS
I would like to take this opportunity to thank my advisor Per-Erik Olsson for all his help, advice and suggestions.
My sincere thanks to Ajay Pradhan, his guidance and help in the laboratory and with the zebrafish made this project possible.
Lastly I would like to thank Solomon Asnake for his help with the Molecular Operating Environment software.
20 REFERENCES
Autiero I, Costantini S, Colonna G. 2009. Human sirt-1: Molecular modeling and structure-function relationships of an unordered protein. PloS one 4:e7350.
Coussens M, Maresh JG, Yanagimachi R, Maeda G, Allsopp R. 2008. Sirt1 deficiency attenuates spermatogenesis and germ cell function. PloS one 3:e1571.
Gertz M, Fischer F, Nguyen GTT, Lakshminarasimhan M, Schutkowski M, Weyand M, et al. 2013. Ex-527 inhibits sirtuins by exploiting their unique nad(+)-dependent deacetylation mechanism. Proceedings of the National Academy of Sciences of the United States of America 110:E2772-E2781.
Guarani V, Deflorian G, Franco CA, Kruger M, Phng LK, Bentley K, et al. 2011.
Acetylation-dependent regulation of endothelial notch signalling by the sirt1 deacetylase. Nature 473:234-238.
Hoffmann J, Romey R, Fink C, Yong L, Roeder T. 2013. Overexpression of sir2 in the adult fat body is sufficient to extend lifespan of male and female drosophila. Aging-Us 5:315-327. Kaeberlein M, McVey M, Guarente L. 1999. The sir2/3/4 complex and sir2 alone promote longevity in saccharomyces cerevisiae by two different mechanisms. Genes & Development 13:2570-2580.
Landry J, Slama JT, Sternglanz R. 2000. Role of nad(+) in the deacetylase activity of the sir2-like proteins. Biochemical and biophysical research communications 278:685-690.
Luo J, Nikolaev AY, Imai S, Chen D, Su F, Shiloh A, et al. 2001. Negative control of p53 by sir2alpha promotes cell survival under stress. Cell 107:137-148.
Matson CK, Murphy MW, Griswold MD, Yoshida S, Bardwell VJ, Zarkower D. 2010. The mammalian doublesex homolog dmrt1 is a transcriptional gatekeeper that controls the mitosis versus meiosis decision in male germ cells. Developmental cell 19:612-624.
Moore RL, Faller DV. 2013. Sirt1 represses estrogen-signaling, ligand-independent eralpha-mediated transcription, and cell proliferation in estrogen-responsive breast cells. The Journal of endocrinology 216:273-285.
Napper AD, Hixon J, McDonagh T, Keavey K, Pons JF, Barker J, et al. 2005. Discovery of indoles as potent and selective inhibitors of the deacetylase sirt1. J Med Chem 48:8045-8054. Nihal M, Ahmad N, Wood G. 2013. Sirt1 is upregulated in cutaneous t-cell lymphoma and its inhibition induces growth arrest and apoptosis. Cell Cycle 13:1-9.
Orban L, Sreenivasan R, Olsson PE. 2009. Long and winding roads: Testis differentiation in zebrafish. Molecular and cellular endocrinology 312:35-41.
Ospina-Alvarez N, Piferrer F. 2008. Temperature-dependent sex determination in fish revisited: Prevalence, a single sex ratio response pattern, and possible effects of climate change. PloS one 3:e2837.
Pavlova S, Klucska K, Vasicek D, Ryban L, Harrath AH, Alwasel SH, et al. 2013. The involvement of sirt1 and transcription factor nf-kappab (p50/p65) in regulation of porcine ovarian cell function. Animal reproduction science 140:180-188.
21
Pereira TCB, Rico EP, Rosemberg DB, Schirmer H, Dias RD, Souto AA, et al. 2011. Zebrafish as a model organism to evaluate drugs potentially able to modulate sirtuin expression. Zebrafish 8:9-16.
Picard F, Kurtev M, Chung N, Topark-Ngarm A, Senawong T, Machado De Oliveira R, et al. 2004. Sirt1 promotes fat mobilization in white adipocytes by repressing ppar-gamma. Nature 429:771-776.
Potente M, Ghaeni L, Baldessari D, Mostoslavsky R, Rossig L, Dequiedt F, et al. 2007. Sirt1 controls endothelial angiogenic functions during vascular growth. Genes Dev 21:2644-2658. Pradhan A, Khalaf H, Ochsner SA, Sreenivasan R, Koskinen J, Karlsson M, et al. 2012. Activation of nf-kappab protein prevents the transition from juvenile ovary to testis and promotes ovarian development in zebrafish. The Journal of biological chemistry 287:37926-37938.
Rine J, Strathern JN, Hicks JB, Herskowitz I. 1979. A suppressor of mating-type locus mutations in saccharomyces-cerevisiae - evidence for and identification of cryptic mating-type loci. Genetics 93:877-901.
Rodriguez-Mari A, Yan YL, Bremiller RA, Wilson C, Canestro C, Postlethwait JH. 2005. Characterization and expression pattern of zebrafish anti-mullerian hormone (amh) relative to sox9a, sox9b, and cyp19a1a, during gonad development. Gene expression patterns : GEP 5:655-667.
Schmittgen TD, Livak KJ. 2008. Analyzing real-time pcr data by the comparative c(t) method. Nature protocols 3:1101-1108.
Seifert EL, Caron AZ, Morin K, Coulombe J, He XH, Jardine K, et al. 2012. Sirt1 catalytic activity is required for male fertility and metabolic homeostasis in mice. Faseb J 26:555-566. Sekido R, Lovell-Badge R. 2008. Sex determination involves synergistic action of sry and sf1 on a specific sox9 enhancer. Nature 453:930-934.
Shang EH, Yu RM, Wu RS. 2006. Hypoxia affects sex differentiation and development, leading to a male-dominated population in zebrafish (danio rerio). Environmental science & technology 40:3118-3122.
Siegfried KR, Nusslein-Volhard C. 2008. Germ line control of female sex determination in zebrafish. Developmental biology 324:277-287.
Sreenivasan R, Jiang J, Wang X, Bartfai R, Kwan HY, Christoffels A, et al. 2013. Gonad differentiation in zebrafish is regulated by the canonical wnt signaling pathway. Biology of reproduction.
Summa CM, Levitt M. 2007. Near-native structure refinement using in vacuo energy minimization. Proceedings of the National Academy of Sciences of the United States of America 104:3177-3182.
Takahashi H. 1977. Juvenile hermaphroditism in the zebrafish, brachydanio rerio. Bull Fac Fish Hokkaido Univ 28:57-65.
22
Tamura K, Peterson D, Peterson N, Stecher G, Nei M, and Kumar S (2011) MEGA5: Molecular Evolutionary Genetics Analysis using Maximum Likelihood, Evolutionary Distance, and Maximum Parsimony Methods.Molecular Biology and Evolution 28: 2731-2739.
Traut W, Winking H. 2001. Meiotic chromosomes and stages of sex chromosome evolution in fish: Zebrafish, platyfish and guppy. Chromosome research : an international journal on the molecular, supramolecular and evolutionary aspects of chromosome biology 9:659-672. Uchida D, Yamashita M, Kitano T, Iguchi T. 2002. Oocyte apoptosis during the transition from ovary-like tissue to testes during sex differentiation of juvenile zebrafish. The Journal of experimental biology 205:711-718.
Wallace BM, Wallace H. 2003. Synaptonemal complex karyotype of zebrafish. Heredity 90:136-140.
Wang XG, Bartfai R, Sleptsova-Freidrich I, Orban L. 2007. The timing and extent of 'juvenile ovary' phase are highly variable during zebrafish testis differentiation. Journal of Fish Biology 70:33-44.
Vaquero A, Scher M, Lee D, Erdjument-Bromage H, Tempst P, Reinberg D. 2004. Human sirt1 interacts with histone h1 and promotes formation of facultative heterochromatin. Molecular cell 16:93-105.
Vaziri H, Dessain SK, Eaton EN, Imai SI, Frye RA, K. PT, et al. 2001. Hsir2sirt1 functions as an nad-dependent p53 deacetylase. Cell 107:149-159.
Villamizar N, Ribas L, Piferrer F, Vera LM, Sanchez-Vazquez FJ. 2012. Impact of daily thermocycles on hatching rhythms, larval performance and sex differentiation of zebrafish. PloS one 7:e52153.
Yao Y, Li H, Gu Y, Davidson NE, Zhou Q. 2010. Inhibition of sirt1 deacetylase suppresses estrogen receptor signaling. Carcinogenesis 31:382-387.
Yeh HC, Wang LH. 2006. Profiling of prostanoids in zebrafish embryonic development. Prostaglandins, leukotrienes, and essential fatty acids 75:397-402.
Yi JJ, Luo JY. 2010. Sirt1 and p53, effect on cancer, senescence and beyond. Bba-Proteins Proteom 1804:1684-1689.
Zakhary SM, Ayubcha D, Ansari F, Kamran K, Karim M, Leheste JR, et al. 2011. A behavioral and molecular analysis of ketamine in zebrafish. Synapse 65:160-167.
Zhang ZY, Kakutani K, Maeno K, Takada T, Yurube T, Doita M, et al. 2011. Expression of silent mating type information regulator 2 homolog 1 and its role in human intervertebral disc cell homeostasis. Arthritis Res Ther 13.
23 SUPPLEMENTARY DATA ar C 0.1 µM 1 µM 0.0 0.5 1.0 1.5 R e la ti ve e x p re ss io n dmrt1a C 0.1 µM 1 µM 0.0 0.5 1.0 1.5 2.0 2.5 * * R e la ti ve e x p re ss io n ff1b C 0.1 µM 1 µM 0.0 0.5 1.0 1.5 2.0 2.5 R e la ti ve e x p re ss io n ff1d C 0.1 µM 1 µM 0.0 0.5 1.0 1.5 R e la ti ve e x p re ss io n mmp9 C 0.1 µM 1 µM 0.0 0.5 1.0 1.5 2.0 2.5 * * R e la ti ve e x p re ss io n p21 C 0.1 µM 1 µM 0.0 0.5 1.0 1.5 2.0 2.5 * R e la ti ve e x p re ss io n p53 C 0.1 µM 1 µM 0.0 0.5 1.0 1.5 2.0 2.5 *** R e la ti ve e x p re ss io n p65 C 0.1 µM 1 µM 0.0 0.5 1.0 1.5 R e la ti ve e x p re ss io n ptgds C 0.1 µM 1 µM 0 1 2 3 * R e la ti ve e x p re ss io n ptges C 0.1 µM 1 µM 0.0 0.5 1.0 1.5 R e la ti ve e x p re ss io n sirt1 C 0.1 µM 1 µM 0.0 0.5 1.0 1.5 2.0 2.5 * R e la ti ve e x p re ss io n sox9a C 0.1 µM 1 µM 0.0 0.5 1.0 1.5 2.0 2.5 * * R e la ti ve e x p re ss io n sox9b C 0.1 µM 1 µM 0.0 0.5 1.0 1.5 2.0 2.5 R e la ti ve e x p re ss io n wnt4a C 0.1 µM 1 µM 0 1 2 3 4 R e la ti ve e x p re ss io n amh C 0.1 µM 1 µM 0.0 0.5 1.0 1.5 R e la ti ve e x p re ss io n casp3a C 0.1 µM 1 µM 0.0 0.5 1.0 1.5 R e la ti ve e x p re ss io n A B C D E N M L K J G H F I P O
Figure S1. Zebrafish larval 3 days exposure. Zebrafish embryos at 2 h post fertilisation were exposed to EX-527 (0.1 µM and 1 µM) for three days followed by qRT-PCR analysis of amh (A), ar (B), casp3a (C), dmrt1a (D), ff1b (E), ff1d (F), mmp9 (G), p21 (H), p53 (I),
p65 (J), ptgds (K), ptges (L), sirt1 (M), sox9a (N), sox9b (O), wnt4a (P). One way analysis
of variance was used to determine statistical significance (*p < 0.05, ** p < 0.01, ** p < 0.001). Error bars represent ± SD. n = 6.
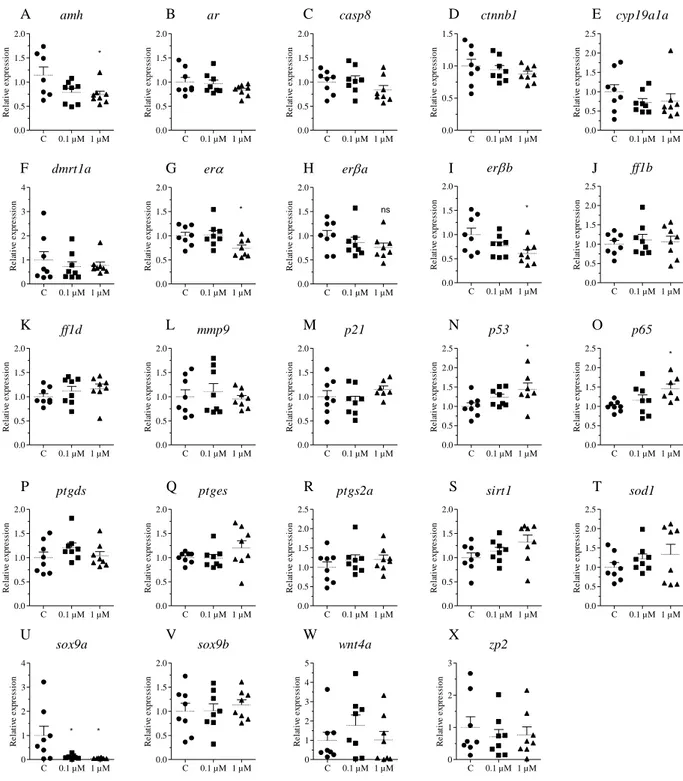
24 amh C 0.1 µM 1 µM 0.0 0.5 1.0 1.5 2.0 * R e la ti ve e x p re ss io n ar C 0.1 µM 1 µM 0.0 0.5 1.0 1.5 2.0 R e la ti ve e x p re ss io n casp8 C 0.1 µM 1 µM 0.0 0.5 1.0 1.5 2.0 R e la ti ve e x p re ss io n ctnnb1 C 0.1 µM 1 µM 0.0 0.5 1.0 1.5 R e la ti ve e x p re ss io n cyp19a1a C 0.1 µM 1 µM 0.0 0.5 1.0 1.5 2.0 2.5 R e la ti ve e x p re ss io n dmrt1a C 0.1 µM 1 µM 0 1 2 3 4 R e la ti ve e x p re ss io n er C 0.1 µM 1 µM 0.0 0.5 1.0 1.5 2.0 * R e la ti ve e x p re ss io n era C 0.1 µM 1 µM 0.0 0.5 1.0 1.5 2.0 ns R e la ti ve e x p re ss io n erb C 0.1 µM 1 µM 0.0 0.5 1.0 1.5 2.0 * R e la ti ve e x p re ss io n ff1b C 0.1 µM 1 µM 0.0 0.5 1.0 1.5 2.0 2.5 R e la ti ve e x p re ss io n ff1d C 0.1 µM 1 µM 0.0 0.5 1.0 1.5 2.0 R e la ti ve e x p re ss io n mmp9 C 0.1 µM 1 µM 0.0 0.5 1.0 1.5 2.0 R e la ti ve e x p re ss io n p21 C 0.1 µM 1 µM 0.0 0.5 1.0 1.5 2.0 R e la ti ve e x p re ss io n p53 C 0.1 µM 1 µM 0.0 0.5 1.0 1.5 2.0 2.5 * R e la ti ve e x p re ss io n p65 C 0.1 µM 1 µM 0.0 0.5 1.0 1.5 2.0 2.5 * R e la ti ve e x p re ss io n ptgds C 0.1 µM 1 µM 0.0 0.5 1.0 1.5 2.0 R e la ti ve e x p re ss io n ptges C 0.1 µM 1 µM 0.0 0.5 1.0 1.5 2.0 R e la ti ve e x p re ss io n ptgs2a C 0.1 µM 1 µM 0.0 0.5 1.0 1.5 2.0 2.5 R e la ti ve e x p re ss io n sirt1 C 0.1 µM 1 µM 0.0 0.5 1.0 1.5 2.0 R e la ti ve e x p re ss io n sod1 C 0.1 µM 1 µM 0.0 0.5 1.0 1.5 2.0 2.5 R e la ti ve e x p re ss io n sox9a C 0.1 µM 1 µM 0 1 2 3 4 * * R e la ti ve e x p re ss io n sox9b C 0.1 µM 1 µM 0.0 0.5 1.0 1.5 2.0 R e la ti ve e x p re ss io n wnt4a C 0.1 µM 1 µM 0 1 2 3 4 5 R e la ti ve e x p re ss io n zp2 C 0.1 µM 1 µM 0 1 2 3 R e la ti ve e x p re ss io n A J I H G F E D C B R Q P O N M L K W V U T X S
Figure S2. Juvenile zebrafish 2 days exposure. In vivo analysis of gene transcription. Zebrafish at 15 dpf were exposed to 0.1 µM and 1 µM EX-527 for two days followed by qRT-PCR analysis of amh (A), ar (B), casp8 (C), ctnnb1 (D), cyp19a1a (E), dmrt1a (F), erα (G),
erβa (H), erβb (I), ff1b (J), ff1d (K), mmp9 (L), p21 (M), p53 (N), p65 (O), ptgds (P), ptges
(Q), ptgs2a (R), sirt1 (S), sod1 (T), sox9a (U), sox9b (V), wnt4a (W), zp2 (X). One way analysis of variance was used to determine statistical significance (*p < 0.05, ** p < 0.01, ** p < 0.001). Error bars represent ± SD. n = 8.
25
Figure S3. Juvenile zebrafish 7 days exposure. In vivo analysis of gene transcription. Zebrafish at 15 dpf were exposed to 0.1 µM and 1 µM EX-527 for seven days followed by qRT-PCR analysis of amh (A), ar (B), casp3a (C), ctnb1 (D), p21 (E), p53 (F), p65 (G), rspo1 (H), sox9a (I), sox9b (J), vtg2 (K), zp2 (L) One way analysis of variance was used to determine statistical significance (*p < 0.05, ** p < 0.01, ** p < 0.001). Error bars represent ± SD. n = 8. amh C 0.1 µM 1 µM 0.0 0.5 1.0 1.5 R e la ti ve e x p re ss io n ar C 0.1 µM 1 µM 0.0 0.5 1.0 1.5 R e la ti ve e x p re ss io n casp3a C 0.1 µM 1 µM 0.0 0.5 1.0 1.5 2.0 ** R e la ti ve e x p re ss io n ctnnb1 C 0.1 µM 1 µM 0.0 0.5 1.0 1.5 R e la ti ve e x p re ss io n p21 C 0.1 µM 1 µM 0.0 0.5 1.0 1.5 2.0 2.5 * R e la ti ve e x p re ss io n p53 C 0.1 µM 1 µM 0.0 0.5 1.0 1.5 2.0 R e la ti ve e x p re ss io n p65 C 0.1 µM 1 µM 0.0 0.5 1.0 1.5 R e la ti ve e x p re ss io n rspo1 C 0.1 µM 1 µM 0.0 0.5 1.0 1.5 2.0 2.5 ** R e la ti ve e x p re ss io n sox9a C 0.1 µM 1 µM 0 5 10 15 R e la ti ve e x p re ss io n sox9b C 0.1 µM 1 µM 0.0 0.5 1.0 1.5 2.0 2.5 R e la ti ve e x p re ss io n vtg2 C 0.1 µM 1 µM 0.0 0.5 1.0 1.5 2.0 2.5 R e la ti ve e x p re ss io n zp2 C 0.1 µM 1 µM 0 1 2 3 4 R e la ti ve e x p re ss io n A J K L I H G F E D C B
26 Sox9a β-actin C 0.1 µM 1 µM C 0.1 µM 1 µM 0.0 0.5 1.0 1.5 2.0 EX-527 R e la ti ve e x p re ss io n
Figure S4. Protein levels of SOX9A. No significant change in SOX9A levels was visible. Error bars represent ± SD. n = 140
27 72 h 96 h 120 h 144 h 0 20 40 60 80 100 C 0.1 µM 1 µM 10 µM
H
at
c
h
in
g
S
u
c
c
es
s
(%
)
Figure S5. Exposure to EX-527 does not alter hatching time. Zebrafish were exposed to EX-527 (0.1, 1 and 10 µM) from 2 – 144 hpf. Number of newly hatched were counted every 24 h. No eggs hatched prior to day 3. No significant change in hatching time was found. Error bars represent ± SD. n = 140
28 Table S1. Primers used in qRT-PCR analysis
Gene symbol Acession No. 5' primer 3' primer
ef1a1/1 AY422992.1 GTACTACTCTTCTTGATGCCC GTACAGTTCCAATACCTCCA
ar ENSDART00000098022 ACAACACACCTGGATGGGAGTGAT TGACCTGTAGCAGCACAAACTCCT
baxa ENSDARG00000020623 CGCCTCAACCCAATGAAAGAGGA ACAAGAAAGGGCACAGACTCTGGA
bcl2 ENSDARG00000025613 TCTTCGAGTTTGGTGGGACCATGT CGTACATCTCCACGAAGGCATCC
casp3a ENSDART00000005593 ACTGGATCCTGGTGTGGAAACTGA CCTGGTCATGATCTGCAAGAGC
casp8 ENSDART00000104757 GCTGATTTCCTGATCGGAATGGC GTGTGTCCAGTCAATCCTTCAGC
cdkn1a (p21) ENSDART00000113620 AGCGCAAACAGACCAACATCACAG ATGCAGCTCCAGACAGATGAAGGT
ctnnb1 ENSDART00000038495 TTTATGAGTGGGAGCAGGGCTTCA TTGACCACGGCATGTTTGAGCATC
cyp19a1a ENSDART00000060605 GGAGACATTGTGCGTGTCTGGA AGAATGTCCAGCTGTCCTTGAGCA
cyp1a ENSDART00000038200 AGGCTGGTGATGGAGCATTACGAT ATCGGACACTTGCAGGTTGGAGTT
dmrt1a NC007116.5 ATGGCAGAGCAGAACGATTTACTG TAGTCCCACAACAGCATGGAGAT
esr1 ENSDART00000024518 AAGAACTCGTCCACATGATCGCCT AGACTCCGAAATCGAGCCACAGTT
esr2a ENSDART00000129589 TACGACTTCAGCACTCTGCCCTTT CCGCTTTACCAGTGGTTTGCTGTT
esr2b ENSDART00000041300 TGTTCGAGTTTGCCACAGACTCCT ACAGATGCTCGATGCCTTTGTTGC
mmp9 ENSDART00000062845 AGCGACTTGGACAAAGTGGAAGGA ACCTGCCGTTTGGCATTCATTCTC
p50 ENSDART00000125216 AGTCAGCCTCAGATCCGTGTGTTT TTGTAAGCAAGGCCCATCAACTGC
ptgds ENSDARG00000027088 CGGGTGGTTGACGCCAAGT CGGCAACTGAGCATTCTCCA
ptges ENSDARG00000020136 GAGCTGCTGCCATGTGGATC CATGTTGTGTGGCCTTCTGCA
ptgs2a ENSDARG00000004539 CACTGTTGCCGGACAACTTTCAGA TCCAGCAGTCTGTTTGGTGAAGGA
rel a (p65) ENSDART00000039068 AGCGCAGGATACACAGTTTCCAGA TCGACAGCTGCCGGAGTTTCTATT
rspo1 ENSDART00000058459 GGTTGCTCACTCACGGTAGGATCT CAGCAGTCCCAAATGCATAGTCCC
sirt1 NC007124.5 CAGCTCTGCTACAATTCATCGCGTC AATCTCTGTAGAGTCCAGCGCGTGTG
smac/diablo BC053156.1 CTGCCAAACGTTGCTCGATCCAAT TGAGTGTATGTAGTGCCTTGGCGT
smad7 ENSDART00000150975 AGTCAACTGGTGCAAATGGTTCGG TGTCCAGTGTGGCTGACTTGATGA
sod1 BC055516 TGAGACACGTCGGAGACC TGCCGATCACTCCACAGG
sox9a ENSDART00000005676 TCGGGTGCAGCACAAGAAAGATCA CTTTGCCTGGCTGTGTGTCAGTTT
sox9b ENSDART00000064500 GTGCAGTAAAGCGGATCTGAAGCG GAGGCAGGTACTGGTCGAACTCAT
tp53 ENSDART00000051549 AGTTAAGTGATGTGGTGCCTGCCT ATCAGCTTCTTTCCCTGTTTGGGC
wnt4a ENSDART00000105133 CAATTCAAGCCGCACACAGACGAA TTGCATTTGACGTAGCAGCACCAG
zp2 ENSDART00000047101 GAAATGCAGTCACTGTCCAG GAACCTCAAACTGGCTGTCT