DISSERTATION
AN
AGE
ESTIMATION TECHl\TIQUE AND SOME NORMAL BLOOD VALUES FOR MOUNTAIN LIONS (FELIS CONCOLOR)Submitted by
Mary Jean Pfile Currier
In partial fulfillment of the requirements for the Degree of Doctor of Philosophy
Colorado state University Fort Collins, Colorado
Summer, 1979
Copyright by
Mary Jean Pfile Currier 1979
QL737
.C23
C78
copy
2
COLORADO STATE UNIVERSITYJune, 1979
WE HEREBY RECOMMEND THAT THE THESIS PREPARED UNDER OUR SUPERVISION BY MARY JEAN PFILE CURRIER ENTITLED AN AGE ESTIMATION TECHNIQUE AND SOME NORMAL BLOOD VALUES FO~J10UNTAIN LIONS (FELIS CONCOLOR) BE ACCEPTED AS FULFILLING IN PART REQUIREMENTS FOR THE DEGREE OF DOCTOR OF
PHILOSOPHY. Committee on Graduate Head of Department
\
, . / / '-·---i '-·---iABSTRACT OF THESIS
.-\iJ AGE ESTI~:.A.':::'ION '::'ECH!'TIQUE A:\'D SO:"'!'.: \!Q~·L-\l. BLOOD V_U,UES FO~ :-:Ou1'"i~ . .\nl LIONS (FELIS CONCOLOR)
The objectives of this study were: (1) to devise 2 method for esti-mating the ages of individual, wild-caught mountain lions, (2) to iden
-tify che normal ranges of various physiological and morphological parameters in the mountain lions, and (3) to detennine whether differ -ences in the physiological and morphological parameters measured exist between wild-caught mountain lions captured in south-central Colorado and captive lions in other areas.
The age-estimation fonnula developed for females included the fol-lowing blood oarameters: globulins, blood urea nitrogen, total proteins, percentage oonocytes, and zinc; 2nd morphological measurements:
reces~ion trc~ the pre~olars and rear :arsal length.
The age-estimation for.nula de1.1eloped for sales included the :::ol~o,,; -ing blood parameters: globulins, alkaline phosphatases, and percentage neutrophils; and morphological measurements: gumline recession from the upper canine and total body length.
2
Both formulas had an r of about 0.80.
Blood, hair, and vibrissae samples; and tooth and body measure~ents were taken from 46 captive and 31 free-ranging ffiOuntain lions. Eight animals were sampled each year for three years, 22 for two years, and 50 only once, for a total of 52 female and 34 male captive lion sam-plings, and 21 female and 11 male wild lion samplings.
The blood sampies ~ere evaluated for hematocrit, amount of zinc in the plasma, 18 seru..~ parameters, and ~.hite blood cell differentials. The hair and vibrissae samples were stretched t~til they broke to measure
iii
elasticity. Two upper and two lower teeth were measured for gumline re -cession and measurements of six body characteristics were made. :for:-:-121
(mean) values and 95 percent confidence intervals for all 38 nara~eters were determined.
The entire 118 samplings were divided into several sets of su b-groups and selectively tested for significant differences (P < 0.10) in each of the 38 parameters.
Three male mountain lions were raised from age 3 weeks. Eighteen summer and 17 winter blood sa~ples were taken and tested for sur.u~er-winter differences.
Ten blood and two morphological parameters were significantly dif -ferent between the wild, and captive, non-kitten mountain lions. Two blood and five morphological parameters were significantly different je -tween female, and male, non-kitten mouncain lions. Eight blood anci all morphological paramecers ~ere significa~tly different bec~een wild kic
-tens and wild non-kittens. Six blood parameters were significantly dif -ferent between sum,.-ner and winter blood collections.
Twenty-six parameters (the 12 determined to be significantly dif-ferent between wild and captive lions were omitted) were initially eval -uaced for the development of the age-estimation formulas with multiple regression analysis. Of ehe eight blood parameters found to be signi-ficantly different between wild kittens and wild non-kittens, two were included in the female age-estimation formula and three in the male age-estimation formula.
Winter-summer significant differences were probably not seasonal differences, tut for the most part due only to restraint or method of immobilization.
V
Mary Jean Pfile Currier Department of Fisherv and
Wildlife Biology
Colorado State Universicv Fort Collins, Colorado 80523 Slli'lUTier, 1979
ACIOTOWLEDGDfENTS
I would like to thank my husband, E. Gray Currier, for his support and helpful COTIDents on ~y thesis, and my adviser, Dr. Kenneth~. Russell, for his help and guidance throughout this study. I would also like to acknowledge the guidance and comments of the other members of my grad -uate coITLmittee: Dr. Rodney A. Bowling, Dr. Julius G. Nagy, and Gene D. Schooenveld. I am grateful to Dr. David A. Cramer, who attended my final exam in Dr. Bowling's stead, for his support and helpful comments during the exam, and Dr. Douglas L. Gilbert for his helpful corrur.ents on the thesis.
This study would not have been possible without the aid o the following zoos and individuals: Arizona-Sonora Desert Museum, Inc.
(Charles L. Hanson); Brit Spaugh Park and Zoo (Jerry Tillery, Jan Krouse, Dawn Pro tho, Danni Hopsne::-, and Don l-iuslig); Cheyenne :·:ountain Zoolcgical Park (Don Davis, Bill Aragon, Dr. Rodney lvalke::-, Dave Allen, and Cli:: Myers); Clovis Zoo (Ralph Duty, George Newman, and ~1ickey Aguilar); Dal -las Zoo (Larry 0. Calvin, Dr . J.M. Brundrett, and Bucky Holt) : Denver Zoological Gardens (Clayton Freiheit and Dr. Lyvere) ; Dickerson Park Zoo (Dale Tuttle, Judy Tuttle (who brought the three mountain lion kit -tens for this study to Colorado ~nd showed me how to care for them), Paul Price, and Ken Edwards); Glen Oak Zoo (Chuck Wikenhauser and Jim Ellis); Great Plains Zoo (Keith Halverson and Mel Elsing) ; Hogle Zoo -logical Garden (Lamar Farnsworth, Gene R. Schreiber, and Dr. Tugaw): Jamestown Feline Breeding and Research Station (Vic Huddleston) : Hiller Park Zoo (Randall E. Carney, Bill Katthoefer, Val Anderson, and Barbra Diedrich); Rio Grande Zoological Park (Dr. Bruce Stringer, John Roth, Dr. Bowman, Sherry Springer, Pauline Touchon, and Ingrid Sc~~idt );
St. Louis Zoological Park (Charles H. Hoessle, Dr. Kent Kane, Dr. Bill Boever, Dr. Knox, and Roger Birkel); St. Paul's Como Zoo (John Fletcher, Dr. U. S. Seal, and John McKenna) : and Topeka Zoological Park (Gary Clarke, Dr. Joe Bielitzki, John Wortman, and Hike Larue) .
I appreciate the helpful suggestions of Dr. Joseph Tomlinson, the
..
late Dave Griffith, and Dr. Maryanna Thrall. I would like to thank Dennis Giddings for the artwork in my thesis, Ray Moore for analyzing
the serum samples, and Dr. Don Moser for his help with the Instron.
Finally, I would like to thank the agencies which funded mv project: Colorado Division of \Jildlife, Colorado State University, U.S. Fish and Wildlife Service, and The iJildlife ~anagement Institute.
TABLE OF CONTENTS ABSTR.~CT OF T~SS~S ACK..NOWLEDGEMENTS LIST OF TABLES . LIST 0? FIGURi::S INTRODUCTION METHODS Subjects Irr.mobilization
Blood and urine collection and preparation Plasma analysis . . . .
Serum analysis . . . . Triiodothyronine uptake Urine analysis
Hair and vibrissae Gumiine recession . Body measurements . Statistical analvses
analysis
Mul:i?le regression anal~sis Analysis of variance RESULTS Immobilization Blood parameters Urine analysis Morphology Age-estimation formula. Female . . . . Male . . . .
Kittens: growth and tooth development DISCUSSION . .
Immobilization
Blood and urine parameters Significance . . . . Differences . . . . 1. Wild-captive
2. Winter-summer blood collection 3. Wild kitten - Wild non-kitten 4. Female-male
Morphological parameters Age Estimation models . .
viii iii vi X xii 1 3 3 6 6 7 8 8 9 12 13 13 13 13 14 16 16 17 19 21 24 24 24 ?~ -J 33 33 34 34 43 43 44 46 48 49 50
Table of Contents (continuec)
~ethods of age esti~ation Physiological changes vith age
Theories . . . . Physiological changes Morphological changes . . Age estimation technique
Needs . . . . Techniques develoaed Hand-raised kittens
Weight . . . .
Tooth eruption and replacement Eye color and pelage changes .
Estimated ages of unk~own-age mountain lions CONCLUSIONS LITERATURE CITED APPENDICES A. B. C.
Instructions for collectio~ of the data Data Sheet
Alphabetical lis:ing of ti1e
ix symbols used 51 53 53 54 55 56 56 56 58 58 59 59 60 66 67 72 72 80 81
Table 1 2 3 4 5 6 7 8 9 10 11 12 13 LIST OF V .. BL:S
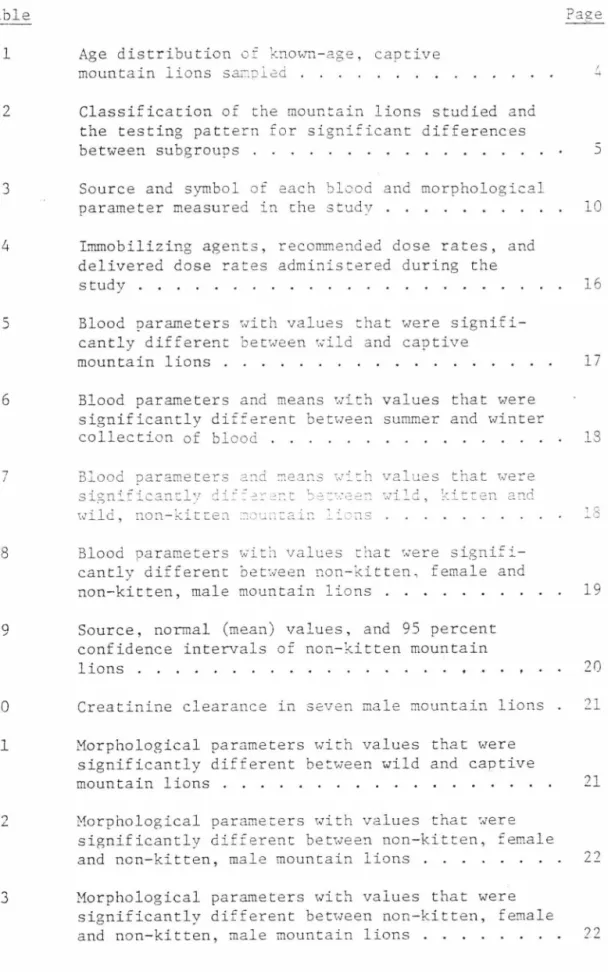
Age distribution cf kno,m-age, captive mountain lions s&~~l2d .
Classification of the mountain lions studied and the testing pattern for significant differences between subgroups
Source and symbol of each blood and morphological parameter measured in the study
Irrunobilizing agents, recowmended dose rates, and delivered dose rates administered during the study
Blood parameters with values that were signifi -cantly different between wild and captive mountain lions .
Blood parameters and means , .. ,ith values that were significantly different betwee:1 summer and winter collection of blood .
Blood parameters a:1d ~eans with values that were significanclv ~i~~~~~~t ~2:~22~ wild, ki t ten and
5
10
16
17
13
wild, non-kitten =oun:ain l ions 18 Blood parameters with values chat were signifi
-cantly different between non-kitten, female and non-kitten, male mountain lions .
Source, normal (mean) values, and 95 percent confidence intervals of non-kitten mountain lions .
Creatinine clearance in seven male mountain lions Morphological parameters with values that were significantly different between wild and captive mountain lions .
Morphological parameters with values that were significantly different between non-kitten, female and non-kitten, male mountain lions .
Morphological parameters with values that were significantly different between non-kitten, female and non-kitten, male mountain lions .
X 19 20 21 21 72
List of Tables (continued) • I .l.4 ,
-l . ) 16 17 18 19 20Normal (mean) values and 95 percent confidence intervals of morpnoiogical parameters measured
for non-kitten mountain lions . . . 23 Weights of the three hand-raised, male mountain
lions during the first 84 days of life
Weights of the three hand-raised, male mountain lions from age 4 weeks through age 62 weeks . Tooth eruption and replacement schedule of the three hand-raised, males mountain lions
Eye color changes in the three hand-raised, male mountain lions
Pelage changes in t~e three hand-raised, male mountain lions . . . .
Estimated ages in years of unknown-age, non -kitten mountain lions . . . .
xi 25 28 28 31 31 32
Figure
1
LIST OF FIGURES
Weight,s of the three hand-raised, male mountain lions during the first 84 days of life . . . .
2 Weights of the three hand-raised, male
mountain lions from age 4 weeks through
27
age 62 weeks . . . . . 30
3 Estimated age structure of the wild mountain
l ions captured near Canon City, Colorado . . . 64
INTRODUCTION
Felis concolor, under the name mountain lion, cougar, puma, el Leon, and many others, has roamed throughout most of the Western Hemisphere since about the time of the Pleistocene extinctions 10,000
years ago (Young and Goldman 1946, Robinson 1976). The subspecies once present throughout much of southeastern U.S. (Felis concolor co~yi) and northeastern U.S. (Felis concolor couguar) are both listed as endangered by the United States Department of the Interior (Anony -mous 1974). In the 11 western states, all eight subspecies present are listed by the states as game animals (Robinson 1976) . The status of the mountain lion in Canada is much the same as in the U.S.: game animals in western Canada, endangered or rare in eastern Canada (the range of Felis concolor cou2uar probablv originally extended into parts or Ontario, Quebec, and ~eK 3~unsKick (Young and Goldman 1946)). Little is known about the status of this big cat in South America. It has probably been extirpated from heavily populated areas and offered little protection elsewhere.
Confusion and misinformation about this elusive creature abound. Nevertheless, management of the mountain lion is desirable if an opti -mum level of this species is to be maintained. The principle methods employed to directly manage mountain lions are harvest regulations in the west and full protection in the east . One type of information that is important in order to understand the dynamics of a wildlife population (and therefore to know which management actions would be beneficial) is the sex and age structure of a population in any given geographic area. This, combined with reproductive and mortal i ty data, and population size, can give the manager a clear picture of the vigor
2
and stability of the population (Eberhardt 1971). This information can be used to calculate the turnover rate of that population, which should form the basis for management through harvest regulation.
Various types of data may be collected for utilization in an age-estimation technique. Body parts are often collected from dead animals, however both physiological and morphological data are available from live specimens. No method has been reported that is adequately objec-tive for estimating the ages of individual mountain lions .
Physiological and morphological data are also important for the
analysis of the state of health of an individual animal. Baseline
information of normal (mean) blood and blood serum values would provide
standards that would aid veterinarians and biologists in the diagnoses of ailments in individual mountain lions. ~!orphological data can reveal cart of the nutritional history of the animal.
The objectives of the study were :hree£old:
1. To devise a method for estimating the ages of individual,
wild-caught mountain lions;
2. To identify the normal ranges of various physiological
and morphological parameters in the mountain lion;
3. To determine whether differences in the physiological
and morphological parameters measured exist between
wild-caught mountain lions captured in south-central
~-:::'I'HODS Subjects
Samples and measurements ,,,ere taken between 1975 ar:d· 1977 from 40 different,known-age, captive :'lountain lions, and six unknown-age, captive mountain lions. Six ::emales and two males were sampled and
measured three consecutive ye2rs; 11 females a;d 10 males, two consec
-utive years; and 12 females and eight males one year only; for a
total of 52 female,and 34 male,captive samplings. The age distribution
of the captive, knoi;m-age 2.ni:'lals was representative (Table 1) .
Samples and measurements were taken between 1975 and 1977 from 20 different, free-ranging, females mountain lions, and 11 different, free -ranging, male lions. One fem2.le w2.s caught, sampled, and measured in
two consecutive yea:cs. The total nurnber of wild samplings was, ther-efore,
21 female anJ 11 male.
TJ:,e entire 113 sacpli:1gs ;-:e~c divided i;1to several sets oi sub
-groups, then tested for di f~erences between them in all of the para -meters measured (Table 2) . Appropriate subgroups were then subjected
to age regression analysis (see Statistical Analyses for specific testing methods) .
Blood samples were taken from three captive, hand-raised, male mountain lions born in the Dickerson Park Zoo, Springfield, Missouri, on 12 June 1977, at ages 6, 8, 12, 16, and 20 weeks; and 6, 7, 8, 9, 10, 12, and 14 months. They were weighed at ages 10, 19, 29, 36, 40, 45, 51, 53, 56, 60, 76, and 83-84 days; and 14, 16, 20, 26, 31, 36, 40, 44, 53, and 62 weeks. Tooth eruption pat tern ,vas checked weekly until age 1.5 months, then monthly.
T/\13LE 1. Age distribution of known-age, c;.1pl::ivc' 111otrnl:nin lions sampled. i\ge(yrs) No. 1-1. 9 2-2.9 3- 3. 9 Li-4. 9 'Fc1nale Li 2 1 7 Nale 3 4 3 3 - -- ---· 5-5 .9 6-6.9
--
--- -- - --7 6 l-1 t, -- --- - -· -- - -7- 7. 9 5 5 8-8.9 4 l 9-9.9 0 0 ---> 10 3 2.r:--Ti\BLE 2. Classification of the 111ount<.1in J.jons sLudLecl and the test:i.11g patten1 for significant differences between subgroups.
No. srnnr1ed once No. samrlcd twice No. sampled thrice Total samples A's VS f3 I S C's vs D's E's vs F's C vs. H I vs. J Wild Non -Kitten kitten 3 16 0 l 0 0 3 18 /\ C E F G --- - - - - -- --- - - --- - ---- -Female ~l_~lVl~ -
No11-Kit l:en kitten
0 12 0 l L 0 6 0 52 II C ll · -WUd Kitten (J 0 0 6 E Non-kitten 5 0 0 5 /\ D F I M;:ile -- - ---~~p tl ve Non--Kit ten kitten
0 g 0 l.O 0 2 0 J/1 I', J) .J -- - - -\J1
6
Immobilization
Three immobilizing agents ,.,ere used at various times: phencyclidine
hydrochloride, ketamine hydrochloride, and tiletamine hydrochloride.
The latter two substances are derivatives of the former. Phencyclidine and ketamine were supplied in liquid form, and tiletamine was supplied as a powder. Sterile saline or distilled water was used to hydrate the powder and fill the dart. The tiletamine had been previously mixed with zolazepam, a muscle relaxant, and occasionally a muscl e relaxant, either
acepromazine or diazepam, was used in conjunction with the other two
immobilizing agents.
Drug delivery was by one of four methods. They were: darted with
l
the dart shot from a Cap-Chur oistol or rifle, darted with the dart propelled from a blow gun, hand-syr::.::ged ~,,ith the animal in 2 squeeze
cage, or jabbed wit~ a syri::ie c:: the end o: a pole (jab stic~) . Blood and urine collection anc ~~epa~ation
A 10-15 cc blood sample w2.s dra,m from the dorsal branch of the medial saphenous vein in the hind leg at about the level of the knee (Fig. 1 in Appendix A) . About 7 cc were put in a plastic tube and al -lowed to clot. The remainder ~as put in a plastic tube with two drops
of zinc-free heparin. At least two good blood smears were made from
either the blood remaining in the syringe immediately after the two tubes had been filled , or from the heparinized sample.
The bladder of seven o!: the captive males was catheterized with a
sterile French size 10 urethral catheter and the bladder emptied. A timed, 1-2 minute sample of urine was collected.
1
7
Both the clotted sample and all but 3 cc of the heparinized samp~e were centrifuged at about 7000 rpm for five r:iinutes. The serum was removed from the top of the clotted blood, labelled, and frozen. The
plasma was removed from the top of the h~parinized blood, labelled, and
frozen. The hematocrit was measured by the standard method using hep -arinized blood.
Blood smears were stained by the standard method using Wright's stain (Seiverd 1972:233- 240) . Two hundred leucocyted were differen-tiated into neutrophilic segmented cells, eosinophilic segmented cells,
basophilic segmented cells, lymphocytes, and ~onocytes. Percentages of each were recorded.
Plasma analvsis
Plasma was prepared for zinc analysis accordi~g to the method ror non-lyophilized olasma of ?rasad sc al. (~963) wicn two exceotions:
(l) to fully utilize the plas~a, the er.tire amount of plasma, not just 1 ml, was used (this also led to use of varying amounts of tri -chloroacet ic acid to maintain the proper ratio) , and (2) the samples
were centrifuged 40 minutes at a time instead of 20 minutes because the rpm of the centrifuge used was lower than the suggested rpm.
Concentration of zinc in the plasma was determined by use of an atomic
absorption spectrophotometer. Dilute solutions of heparin and tri
8
Serum analyses
Seventeen parameters of the blood serum (Table 3 and Appendix C)
were determined by personnel at the C.S.U. Veterinary Hospital with the automated Hycel Hark-17 Discretionary Multi-Channel Analyzer. Albumins were calculated by subtracting globulin values from total protein values.
Triiodothyronine uptake analysis
In 11 instances (seven females and four males), 3 cc of heparin -1?5
ized whole blood were incubated at room temperature with I - -labelled triiodothyronine (T3) , using the methods of Saltz et al. (1963) . The hematocrit was measured by the standard method, and radioactivity of
the washed red blood cells was measured with a solid scintillation counter. The efficiencey of the counting system and the effect of volrnne on the count were measured using standard, knm,,,c1-activity
solutio.:1s of var:-ious volu:ues. ?adioactivity attac~ed to che red blood cells (percentage T3* uptake) was calculated as percentage of that added from the following formulas.
Expected activity: A= A e -At , where: 0
A
=
activity/mlA = initial activity/ml 0
e
=
2.718 (the base of natural (Napierian) logarithms) A decay constant ln 2 Ti, /l T=
half-life½
t = time elapsed since initial activity measured
9
Volume red blood cells: V hr b' where: \,.'
,.
\ volume red blood cells
h he~atocric (fraction red blood cells)
System efficiency: Percentage T3*~ptake: Urine analysis V volurne whole blood wb EV =
-
\
,
, where: AE\, = efficiency of system
\,
= activity at V ml A = known activity n Am A=
measured activity m at EV efficiency at volume V V volume red blood cellsA = ex?ecte~ activity/ml
V ml
The following standard formula for renal clearance of creatinine was used (modified from Ganong 1973:514 by using seru~ concentrations instead of plasma concentrations).
clearance of creatinine
UCREA = concentration of creatinine in urine
3
CREA concentration of creatinine in serum
10
TABLE 3. Source and symbol o: each blood and morphological parameter measured in this study.
Source Plasma R.ed blood cel ls \vhite blood cells Seru~ Parau1eter Sex Age
Zinc concentration Hematocrit
Triiodothyronine uptake
Percentage neutrophilic segmented cells Percentage eosinophlic segmented cells Percentage lymphocytes
Percentage monocytes
Lactic dehydrogenase
Creatine phosphokinase
Serum glutamic-pyruvic transaminase Serum glutamic-oxalacetic transaminase Alkaline phosphatase
Sodium concentration Potassium concentration Chloride concentration Calcium concentration Phosphorous concentration Glucose concentration Cholesterol concentration Bilirubin concentration Creatinine concentration
Svmbol ZN HKT T3 NEU EO LYM MONO LDH CPK SGPT SGOT ALK NA K CL CA p GLU CHOL BIL CREA
TABLE 3. Source Serum Hair Vibr-issae Teeth Body 11 (continued) Parameter
Blood urea nitrogen concentration
Total protein concentration
Globulin concentration
Albumin concentration
Young's Modulus
Young's Modulus
Gumline recession from upper canine
Gumline recession from lower canine
Gumline recession from upper premolar
Gumline recession from lower premolar
Total gumline recession from both canines To:al gu~uine recession :ron bo:h premolars
Body weight
Total body length
Girth Skull arch length Right rear tarsal length Symbol PRO GLOB ALB HA WR UC LC UP LP C PR PT LG GI SK TL
12
Hair and vibrissae
Hair cut from the hind leg prior to blood collection was saved in
an envelope. Six vibrissae were snicaed off close to the skin and
saved in a straw taped on both ends.
Three hairs and three vibrissae from each animal were prepared in the following way. A loose knot was tied at each end, then the hair or
vibrissa was glued at the knots to a piece of paper with one or two drops of epoxy glue. After the glue had thoroughly dried, the sample diameters were measured with a micrometer and tested for tensile
strength and stretch properties on an Instron Universal Testing Instru -ment. Load Cell A, capable of measuring up to 500 g tension, was used to test the hairs, and Load Cell B, capable of measuring up to 2000 g tension, was used to test c:he vibissae. Ihe hair of vibrissa was
mounted in the holder, then stretched ac: a rac:e of 0.2 i~/min u2cil a brea~ occurred. Young's Modulus, a meascre or elasticity, was cal
-culated from the following formula (Hodgman et al ., ed. 1960:3087) . Young's Modulus of Elasticity: M
3"
m01,
wheYe:TIT S M = Young's Modulus N/m 2 m = mass, kg 0 = gravitational acceleration, 0 9.8 m/sec 2
1 = length of hair or vibrissa before stretching, m
r = radius of hair or vibrissa before stretching, m
13
Gumline recession
Measurements were taken from four teeth on one side of each ~oun -tain lion's r.iouth: upper canine, lower canine, second uppe:- premolar
(the first upper premo~ar is vestigial), and first lower premolar (Fig.
4 in Appendix A) . A stainless steel periodontal probe graduated in mil -limeters was used to take measurements. All measurements were from the
cemento-enamel junction midline, represented by a lateral ridge on the
tooth (Fig. 5 in Appendix A), to the gingiva (gumline). If the gingiva
extended over the cementa-enamel junction, che measurement was recorded
as positive. I£ the gingiva had receded beyond the cemento-enamel
junction, it was recorded as negative.
Body measurements
Six body measurements were made: ~eigjt, total body length, tail length, girth, :-ear tarsal ~22gth, and sk~~~ arch. Details on how each was measured are included in Appendix A.
Statistical analyses
Multiple regression analvsis
Two computer programs were used. One was entitled "STAT 40R: Regression Sc:::-een" from the Colorado State l'niversity Statistical
Laboratory. The other one was entitled "STAT 38R: Stepwise Reg
ression-Version of Nov. , 1972, originally BMD02R" also from the Colorado State
University Statistical Laboratory. Output of STAT 40R is an ordered
list of then best k-variable regressions ror k = 1, 2, ... . , n, where
n is the number of independent variables. It helps determine the least
-biased model. The output of STAT 38R is a stepwise series of regres
14
then STAT 40R was run with the 19 variables that were most highly correlated with age (Stat 40R will not accept more chat 19 independ-ent variables). STAT 38R was run again with those variables forced
into the stepwise equations that STAT 40R had indicaterl would lead to the least biased model. Thirty-eight variables were initially evaluated (Table 3 and Appendix C) . The dependent variable was
age. The maximu.111 number of steps for STAT 38R was 76. F-v2lue
for both inclusion and deletion was 3.84. Three regressions were
run: females, males, and females and males together. STAT 40R
was also used to determine if any ond source of data (blood or mo r-phological measurements) could be used to predict age.
Analysis of variance
The Statistical Package for the Social Sciences (SPSS), Version
7.0 - March 15, 1973, comuucer program from the Colorado State iicive
r-sity Statistical Library was used for the analvses of variance. In
addition to the 40 variables listed previously, two more variables
were added: status (wild or captive), and kitten or non-kitten (non-kitten mountain lions are those without obvious spots and with an adult set of teeth; probably all animals greater than one year of age) .
Six differences were tested (Table 1) :
Wild, non-kitten mountain lions vs. captive, non-kitten mountain lions;
All non-kitten females (wild and captive) vs. all non-kitten
males (wild and captive)
1
-_:;
Wild females vs. captive females if both wild-captive and fe~ale-male significant differences existed in the mo
rpho-~ogical measurement;
Wild male vs. captive male if both wild-captive and female -male significant differences existed in the morphological measu.:-ement;
Summer (16 April through 14 October) blood collection vs. winter (15 October through 15 April) blood collection from the three captive, hand-raised mountain lions.
The hypothesis that the two sub-groups in each case were drawn from the same population (null hypothesis) was tested, and the probability that the difference was due to chance was calculated with the computer
RESULTS
Immobilization
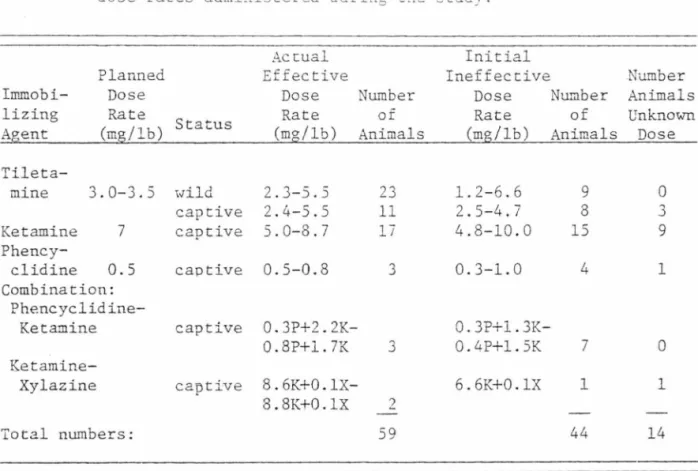
The 77 animals were immobiliz2d llS times. Thir:y-cwo wild and 22 captive lions were immobilized with tiletamine hydrochloride, 41 captive lions with ketamine hydrochloride, eight captive lions with phencyclidine hydrochloride, and 14 captive lions with various drug combinations (Table 4) . Fifty-nine were immobilized with one dose, 44 with more than one, and 14 with an unknown dose (part of the dose was sprayed into the air, or otherwise not delivered).
Tiletamine usually acted within 3-5 minutes, ketamine within 5-10 minutes, and phencyclidine within 15-20 minutes. No drug-attributed mortalities occurred.
TABLE 4. L:nmobilizing agents, recor..mended dose rates, aQd delivered
dose rates adninistered during :he stud;.
Actual Planned Effective
Immobi- Dose Dose
lizing Rate Status Rate Agent (mg/lb) (mg/lb) Tile ta-mine 3.0-3.5 wild 2.3-5.5 captive 2.4-5.5 Ketamine 7 captive 5.0-8.7 Phency-clidine 0.5 captive 0.5-0.8 Combination: Phencyclidine-Ketamine captive 0.3P+2. 2K-0.8P+l. 7K I(et amine-Xylazine captive 8. 6K+0.1X -8.8K+0.1X Total numbers: Initial Ineffective Number Dose of Rate Animals (mg/lb) 23 1.2-6.6 11 2.5-4.7 17 4.8-10.0 3 0.3-1.0 0. 3P+l. 3K -3 0. 4P+l. SK 6.6K+0.1X 2 59 Number of Animals 9 8 15 4 7 1 44 Number Animals Unknown Dose 0 3 9 1 0 l 14
17
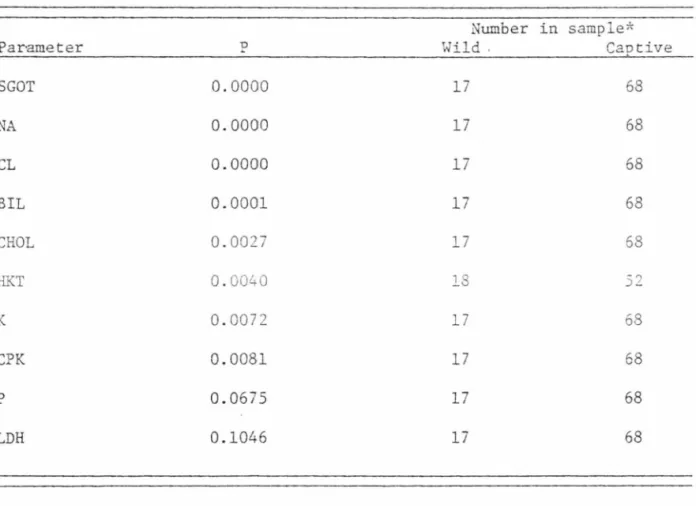
Blood Parameters
A significant difference (probability that the differen~e is due
to chance is less than or equal to 0.10) existed between the non-kitten,
wild and non-kitten, captive mountain lions sampled for 10 blood pa
ra-meters (Table 5) .
TABLE 5. Blood parameters with values that were significantly dif
-ferent between wild and captive mountain lions.
Number in sample*
Parameter D
..
Wild . CaotiveSGOT 0.0000 17 68 NA 0.0000 17 68 CL 0.0000 17 68 BIL 0.0001 17 68 CHOL 0.0027 17 68 HKT 0.0040 18 -? :J -K 0.0072 17 68 CPK 0.0081 17 68 p 0.0675 17 68 LDH 0.1046 17 68
*The number of samples might vary in each case due to some
incomplete sampling.
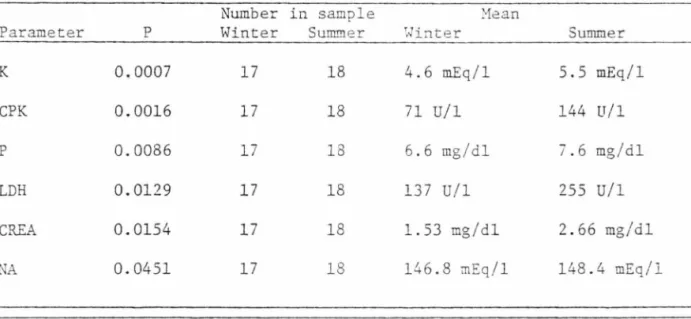
A significant difference (P ~ 0.10) existed between summer (16 May
through 14 October) and winter (15 October through 15 April) collection
of blood from the three male, captive, hand-raised mountain lions for
18
TABLE 6. Blood parameters and means with values that were significantly different between sUI!Uller and winter collection of blood.
Number in sample ~1ean
Parameter p Winter Su!Il!!ler ~.Jinter Summer
K 0.0007 17 18 4.6 mEq/1 5.5 mEq/1 CPK 0.0016 17 18 71 U/1 144 U/1 p 0.0086 17 18 6.6 mg/dl 7.6 mg/dl LDH 0.0129 17 18 137 U/1 255 U/1 CREA 0.0154 17 18 1. 53 mg/dl 2.66 mg/dl NA 0.0451 17 18 146.8 ;nEq/1 148.4 mEq/1
A significant difference (P
2
0.10) existed between wild kittens and wild non-kittens for eight blood parameters (Table 7).TABLE 7. Blood parameters 2nd means wi ch ,,alues that were significantly different between wild, kitten 2nd wild, non-kitten mount2in
lions.
Number in sample Mean
Parameter p Kitten Non-kitten Kitten Non-kitten
ALK 0.0000 8 11 25.48 U/1 7.58 U/1 GLOB 0.0090 8 11 3 .13 g/dl 3.65 g/dl MONO 0.0205 8 11 0.7 % 1.5 % LYM 0.0339 8 11 50.7 % 35.4 % NEU 0.0388 8 11 46.4 % 61.3 % LDH 0.0354 8 11 241.63 U/1 166.09 U/1 CREA 0.0782 8 11 1. 59 mg/dl 2.51 mg/dl CA 0.1019 8 11 11.81 mg/dl 10. 96 mg/dl
19
A significant difference (P ~ 0.10) ~~isted between non-kitten females and non-kitten males for two blood ?arameters (Table 8) .
TABLE 8. Blood parameters with values that were significantly dif -ferent between non- kitten, femlale and non-kitten, male mountain lions.
Parameter K GLOB p 0.0074 0.0679 Number in sample Female Male
so
29so
29The correlation coefficient between triiodothyronine uptake and
age in the 11 mountain lions tested was 0.105.
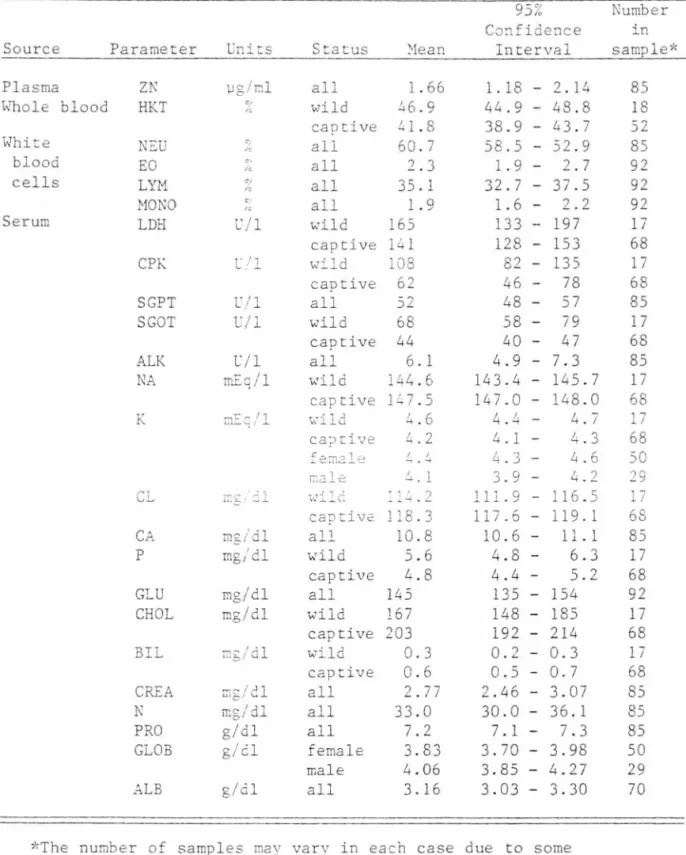
The normal (mean) value a~d the 95 percent confidence interval
of each blood parameter evaluated are listed in Table 9. In the cases
where a significant difference ~ isted between wild and captive, or
female and male, the normal value and confidence interval for each
are given.
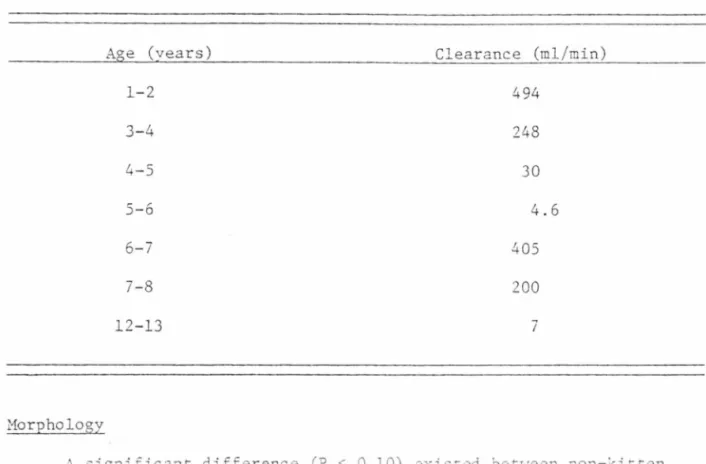
Urine Analysis
Catheterization of the bladder was not possible in the females,
and quite difficult in the males. The results in Table 10 were obtained from the seven males in which it was accomplished.
20
TABLE 9. Source, normal (.Jean) values, a:1d 95 percent confidence in -tervals of blooc pa:ra..11eters o;: rion-kitten mountain lions.
Source Parameter Plasma ZN Whole blood HKT White NsU blood EO cells LYM MONO Serum LDH CPK SGPT SGOT ALK NA K CL CA p GLU CHOL BIL CREA N PRO GLOB _.;LB uriics \Jg/cl <1 " <1 le % e· " l'./1 C/2. C' I... , l;/1 l'./1 mr:q/1 mg/dl mg/dl mg/dl mg/dl r..,;/dl rr:g/dl mg/dl g/dl g/d g/cil Status '.'1ean all 1. 66 wild 46.9 captive 41.8 ali 60.7 all 2. 3 all 35. 1 all 1. 9 wild 165 captive 141 w:::..ld 108 captive 62 all 52 wild 68 captive all '\,.'ild 44 6. 1 144.6 captive l:'.;7.5 v:ild .!+.6 ca::itive :e:nale male captive all 'ls'ild captive all wild captive wild captive all all all female male all 4.2 .:,. . 1 ~ l:'.i . 2 118.3 10.8 5.6 4.8 145 167 203 0.3 0.6 2. 77 33.0 7.2 3.83 4.06 3.16 95% Confidence Interval 1. 18 - 2. 14 44.9 - 48.8 38.9 43.7 58.5 - 52.9 1.9 - 2.7 32. 7 - 37.5 1.6 2.2 133 - 197 128 153 82 - 135 46 78 48 - 5 7 58 - 79 40 47 4.9 - 7.3 143.4 - 145.7 147.0 - 148.0 4.4 - 4.7 4.1 4.3 4.3 - 4.6 3.9 - 4.2 111.9 - 116.5 117.6 10.6 -4.8 -4.4 -135 -148 -192 -0.2 -0.5 2.46 -30.0 -7.1 -3. 70 -119. 1 11. 1 6.3 5.2 154 185 214 0.3 0.7 3.07 36.l 7.3 3.98 3.85 - 4.27 3.03 - 3.30
*The number of samples mav vary in each case due to some incomplete sampling.
Number in sample* 85 18 52 85 92 92 92 17 68 17 68 85 17 68 85 17 68 17 68 50 29 17 68 85 17 68 92 17 68 17 68 85 85 85 50 29 70
21
TABLE 10. Creatinine clearance in seven male mountain lions.
Aoe (vears) Clearance (ml/min)
1-2 494 3-4 248 4-5 30 5-6 4.6 6-7 405 7-8 200 12-13 7 Morphology
A significant difference (? ..:_ 0.10) exisced between non-!.<itten,
wild and non<·ic::en, captive ocu::.cc.i:1 lions :oc n,-o cnorphological para
-meters measured (Table 11).
TABLE 11. Morphological parameters with values that were significancly different between wild and captive mountain lions.
Parameter GI WT p 0.0000 0.0218 Number in sample Wild Caotive 21 21 68 68
A significant difference (P .::_ 0 .10) e...'{isted between wild kittens and wild non-kittens for five morphological parameters measured
22
TABLE 12. Morphological parameters with values that were significantly
dif ferent between wild, kitten and wild, non-kitten mountain lions.
Number in sample
Parameter p Kittens Non-kittens
WT 0.0000 8 11
LG 0.0001 8 11
GI 0.0015 8 11
SK 0.0042 8 11
TL · 0. 0114 8 11
A significant difference (P ~ 0.10) existed between non-kitten
females and non-kitten males for five morphological parameters
(Table 13).
T..\BLE 13. f'forphological parameters i,ith values that ';Jere significa~tly
different between non-ki:ten, female and non-kitten, male
mountain lions.
Number in sample
Parameter p Females Males
WT 0.0000 50 29 LG 0.0000 50 29 GI 0.0000 50 29 SK 0.0000 50 ')Q L . , TL 0.0000 50 29
23
The normal (mean) value and the 95 percent confidence interval of
each morphological parameter evalua ced a:-e listed in Table 14. In the
cases where a significant difference exisced between wild and captive,
or female and male lions, the normal value and confidence interval for each is given.
TABLE 14. Nonnal (mean) values and 95 ~ercent confidence intervals of
morphological parameters measured for non-kitten mountain lions.
Parameter Units Status Hean
9 5}~ Confidence Interval :-Iumber in 1 Sample WH HA UC LC UP LP C p~ \v'T LG GI SK TL 2 N/m? N/m-mm mm rr.m mm cm cm cm cm captive captive all all all all all 211 wild i:enale male captive female male female male wild female male captive female male female male female male 6 2.0xl06 2.7xl0 (-0. 7) (-0.6) (-0.!i) (-0.5) (-1.3) (-1. O) 40.5 61. 6 45.5 61. 6 199 222 69.9 76.0 78.3 85. 7 17.4 20.7 17.7 19.4 6 6 l.5xl0 6- 2.5xl06 2.lxlO -3.4xl0 {-1.1)- (-0.3) (-0.9)-(-0.3) (-0.7)-(-0.2) ( -0. 7) - ( -0. 3) (-1.9)-(-0.6) (-1.5)-(-0.5) 36.4 44.5 57.7 - 65.4 42.1 - 48.9 57.7 - 65.4 195 - 203 218 - 226 66.7 - 73.l 73.7 - 78.3 7 5. 3 - 81. 2 83.7 - 87.8 17.1 - 17.7 20.1 - 21.2 17.3 - 18.0 19.0 - 19.8 68 68 91 91 91 91 91 91 392 31
so
29 16 4 39 27so
29so
291The number of samples may vary in each case due to some incomplete
sampling.
2Wild male values were not significantly different (P
< 0.10) from captive male values.
24
Age-Estimation Formula
Female
Values of 25 parameters fr-om 39 kno·A-n-2.ge, captive, non-kitten,
female mountain lions were used to construct a model from which the
ages of individual, female mountain lions Lould be estimated. None of
the parameters that were significantly differenc between the wild and
captive mountain lions were used. The following is the least-biased
model that resulted.
Y =
(- 7.39)+3.63GLOB+O.l2~-l.S6PRo+0.37~0~0+0.31ZN-0. 71PR+0.27TLblood teeth body
Y
=
age estD~ate in yearsThe coefficient of multiole detennination (r2) , or the percent of
variability in age due to the inde?e:.1de:.1t variables in the model (PR,
GLOB, ecc.) is 81 ~ercent. :he stanjard error o;: the estimate is 1.55.
The least-biased I:OITJula • , • . . 4 - 1
usi:.1g on.L:: J.!.OOc ?2.ra.n:ec:e:-s Oi: cne female
2
mountain lions resulted in an r of only Sl percent. Using only morpho
-logical parameters (teeth, body, vibrissae, and hair measurements), the 2
r was only 56 percent.
Hale
Values of 25 parameters from 29 know~-age, captive, non-kitten,
male mountain lions ~ere used to construct a illOdel from which the ages
of individual, male mountain lions could be estimated. None of the
parameters that were significantly different between wild and captive
lions were used. The following is the least-biased model that resulted.
Y = 3.43+0.12NEU-0.28AL~+2.07GLOB-0.85UC-0.06LG
blood teeth body
25 ,.,
The coefficient of determination (r-) is 80 percent. The standard
error of the estimate is 1.45.
The least-biased formula using only blood parameters of the male
?
mountain lions resulted in an r- of only 39 percent. Using only morpho
-2
logical parameters, the r was only 49 percent.
Kittens: Growth and Tooth Development
The following tables and figures (Tables 15, 16, 17, 18, and 19;
Figures 1 and 2) can be used to illustrate the weight increases, tooth
development, and eye color and pelage changes in the three hand-raised,
male mountain lions from ages 10 days to 14 months. Mitzli, Schunta,
and Radar are their names.
TABLE 15. Weights of the three hand-raised, male mountain lions during
the first 84 days of life.
',iei0hc C,\;)
A0e (davs) :1i.tzli Schunca Radar
10 l. 48 l. 31 l. 36 19 l. 65 l. 65 1. 65 29 2.00 2.10 2.05 33 2.55 36 2.45 2.72 2.45 40 2.98 3.15 2.83 45 3.22 3.20 3.20 51 3.80 3.80 3.70 53 4. 05 4.00 4.00 56 4.40 4.30 4.25 60 4.95 4.80 4.80 64 5.20 5.00 5.10 76 6.35 6.30 6.25 83 7. 40 84 7.60
Figure 1. \,]eights of the tl1rcc !1ancl-raised, male mountain lions
_...,, (9
7
6
5
~
4
~I
~
3
I2~
0 A/
0
I
. . . / k ~•=MEAN
o
= MITZLI
~
6=
SCHUNTA
D=
RADAR
0 - - - - ~ - ~ -
~ -
~
-0
10
20
30
40
50
60
70
80
90
AGE
(DAYS)
N "-l28
TABLE 16. Weights of t.he three hand-raised, male mountain lions from age 4 weeks through age 62 weeks.
Weight (ko)
A0e (weeks) Mitzli Schunta Radar
4 2.0 2.1 2.1 8 4.4 4.3 4.3 14 10.0 9.5 9.5 16 11.8 11.8 12.7 20 16.4 16.4 15.9 ?" - 0 25.5 25.0 25.0 31 30.9 30.9 30. 9 36 35.5 33.6 36.4 40 39.5 38.2 41.8 44 42.7 40.9 43.6 -,., J.) 50.9 50.5 48.2 62 54.5 56.3 52.7
TABLE 17. Tooth eruption and replacement schedule of the three hand -raised, male mountain lions.
A_o::> ' . j -17 days 23 days 30 days 33 days
S½
:nonths 8 months8½
months Erupted teet'.1 upper and lower incisors upper and lower canines lower premolarsupper premolars
upper and lower (just erupting) incisors
lower canines
upper canines (for a short time,
Tyoe oE tooth primary
permaner-t
Figure 2. Weights of the three hand-raised, male mountain l ions
60
6.50
3
40
~I
D-
A
~~
30
I
/
I
l,.) 0•=MEAN
20
~
I
0=MITZLI
6= SCHUNTA
10
L
()/ 0=RADAR
0
0
10
20
30
40
50
60
70
80
90
AGE
(WEEKS)
31
TABLE 18. Eye color ch2.nges iIL the three har;d-raised, male mountain
lions.
A e Color
Birth Entire iris blue
3 months Approximately 3mm next to contracted pupil bro~u
4 months Approximately 5 rmn next to concracted pupil brovm
? months Entire iris brown
9 months Approximately 3 mm gold ring around brown
T_<\BLE 19. Pelage changes in the three hand-raised, male mountain lions.
Age Color
Birth
12-14 weeks
l year
Dark gold wich vivid black spots
3pots zaded , still visible
Spots on body barely visible, but leg stripes still obvious
32
TABLE 20. Estimated ages in years of unknown,.--age, non-kitten mountain
lions.
1975 1976 1977
Age est. Age est. Age esc.
Number Status formula Appearance formula Appearance formula Aopearance Females 107 captive 108 captive 109 captive 112 captive l* wild 2* wild 4* wild 5* wild 8 wild 9 wild 10 wild 11 wild 12 wild l r _.J wild 17 wild 20 wild 21 wild 23 wild 29 wild 32 wild Males llO captive 6 wild 7 wild 16 wild 18 wild 19 wild 4.7 9.1 3.9 6.4 3.3 2-3 9.5 9-10 4.2 9.6 8.9 5.3 7.5 3.7 8.0 0.5 6.5 3.0 8.0 2.1 10.l 13.4 4.9 13.8 9.7 6.9 6.6 8.4 6.8 2.6 5-6 2-3 6-7 2-3 9-10 3-4 3-4 9-10 2-3 8-9 6- 7 9-10 8-9 2-3 2-3
*incomplete data, some variables estimated
8.3 3. 9 5.8 4.5 5-6 2-3 4-5 3-4
DISCUSSIO~l
Irrnnobilization
Unlike many anesthetic drugs, phencyclidine hydrochloride, keta
-mine hydrochloride, and tiletamine hydrochloride do not depress res
-piratory or cardiac functions . They may cause hallucinations.
Phencyclidine, the parent compound, is the most potent anesthetic
of the group. We used a dose rate of 1.1 mg/kg of phencyclidine, 4.4
-5.1 mg/kg of tiletamine (it was combined with a muscle relaxant in a
ratio of 2:1, for a total dose rate of 6.6 - 7.1 mg/kg), and 15.4 mg/kg
of ketamine. The volumes of drugs in solution necessary to immobilize
a 45 kg mountain lion were 0.5cc phencyclidine, 2cc or less tiletamine
(the tiletamine-muscle relaxant was supplied as a powder, so we mixed
it with enough distilled water or saline to fill a 2cc dart) , and 7cc
ketamine.
The drugs of the phencyclidine family are central nervous system
exciting agents. They cause the animal to go through an excitation
phase, then into a hallucinatory and catatonic phase, Central nervous
system depressants cause the animal to go through the excitatory and hal
-lucinatory (catatonic) phases, then into one or two depressant phases
(these are the phases in which respiratory and cardiac functions are af
-fected) . Increased doses of phencyclidine family drugs result in further
excitation rather than depression, so convulsions can result.
Phencyclidine and its derivatives cause excess salivation, but
they do not affect the pharyngeal or laryngeal reflexes (Corssen et
34
Sometimes a tranauilizin~ (~uscle relaxant) agent, acepromazine.
was used in conjunction with ohencyclidine or ketamine. The purpose was to forestall possible c~n~~!sions.
Tiletamine combines the favorable qualities of the other two drugs:
a low volume is required like phencvclidine, thus allowing better accu
-racy and more distance wich the dart, but it is fast acting like keta
-mine, so the animal is not able to travel very far after administration
of the drug (not as important in a captive situation, but possibly the
difference between success or failure in finding the animal in the wild) .
Blood and Urine Parameters Significance
Each of the 23 blood or urine parameters evaluated reflected some
condition of the incernal enviro~~enc of che mountain l ion's body. Be
-fore ~h2 differences ~etween ~ii~ and ca~ci~e, fe~ale and ~ale, kitten
and non-kitten, can be interpreted, the role or each oara~eter must be
understood.
Zinc, a mineral essential to ma:llillals in trace amounts, is
incor-porated in several metaloenzymes, such as carb,)nic anhydrase (imporcant in the blood buffer system) . Although trace amounts are necessary in
the diet, excessive ingestion of zinc does not seem to result in exces
-sive uptake of zinc from the gut. Low levels of zinc in the olasma
in-dicate either a zinc-deficient diet or a problem with zinc absorption
from the digestive tract. (Bos et al. 1977, Bro1m et al. 1978, Kang et
al. 1977, Deeming and Weber 1977).
The thyroid gland secretes two main hormones: thyroxin and
triiodo-thvronine (T3) . Most of the secreted TJ is bound to plasma protein, but red blood cells also have T3-specific binding sites. Both hormones have
35
very widespread, general effects on the body: thev stimulate oxygen con
-sumption in almost all metabolically active tissues and affect growth and maturation. Soltz et al. (1963) have shown that ~3,·, untake by the
red blooJ cells increases during the growth phase of rats. then decreas-es steadilv thereafter; in humans, the red blood cell uptake of T3* was higher in young adults than old ones. In both cases a negative correla -tion existed between age and T3* uotake in adults. In the 11 mountain lions tested in this study, almost no correlation between age and T3* uptake was observed (the small positive correlation was orobablv a sam
-pling artifact) . U.S.Seal (Veterans Administration Hospital, Minneapo
-lis, Personal communication) found that thyroid activity varies more with coat molt changes in the carnivores he has studied, than with age.
The circulating white blood cell population is composed of five cypes of cells: neutrophilic ~ranulocvtes (also called neucro?hilic segmented cells) , eosinophilic granulocytes (sei;TI:enced cells) . baso -philic granulocytes (segmented cells), lymphocytes, and monocytes.
Neutrophils quickly phagocytize bacteria in the blood stream. An
in-creased percentage of neutrophils is seen during acute infections, such as pneumonia or abcesses, and granulocytic leukemia. Nonocytes also phagocytize bacteria and debris, but are usually slower in acting than neutrophils. An increase in the percentage of monocytes is seen in
tuberculosis, monocytic leukemia, and subacute endocarditis. Eosino
-phils apparently phagocytize antigen-antibody complexes, so increased levels of eosinophils are often seen when an animal has either an
allergic reaction or a parasitic infection. Daily and seasonal fluc
-t~ations in eosinophils have been noted in humans (Diem, ed. 1962) . Basophils contain heparin, but their function is not well understood.
36
An increase of circulating basophils is seen in chronic granulocytic leukemia, polycythemia vera (a disease which causes an increase in red cell mass and total blood volume), irradiation, hemolytic anemia, and after removal of the spleen. Lymphocytes contain antibodies, and are increased in lymphocytic leukemia and in acute infectious lympho
-cytosis. (Diem, ed. 1962).
The hematocrit is the volume percentage of red blood cells in the whole blood. It is increased in acclimitization to high altitudes.
Polycythemia (an increase in the total number of circulating red blood cells) can cause an increase in the hematocrit, and anemia can cause a reduction in the herr~tocrit. The hematocrit is affected by the size and shape of the red blood cells, so any disease which alters the size or shape of the red blood cells, genetic or otherwise (such as sickle cell anemia) . will affect the hematocr~t . Dehvdration (often the result of excessive vomitting or diarrhea, or diseases causing a high bod: temperature) causes an elevated hematocrit. In humans, women generally have a lower hematocrit than men possibly due to menstrual bleeding, which doesn't occur in other animals. At birth, the hernatocrit in humans is quite high, then it drops until about age 1 year, at which time it begins a steady rise until maturity. (Diem, ed. 1962).
Lactic dehydrogenase (LDH) is an enzyme found in most animal tis-sues, but the highest concentration is in the heart, liver, kidney,
and skeletal muscle. If any of these tissues are damaged, LDH is released into the blood stream. The serum LDH level will begin to rise two to three days after a heart attack, and will remain elevated for about two weeks. Liver and kidney diseases also cause an elevation
37
of serum LDH levels, as does cancer. Strenuous exercise increases LDH release from skeletal muscle. (Anonymous 1976d, Diem, ed. 1962).
Creatine phosphokinase (CPK) is involved with ATP formation. It catalyzes formation of creatine and ATP from creatine phosphate and ADP. CPK is found mainly in skeleta,l muscles, and is released into the
blood-stream following injury or disease of the muscles and during exercise. Muscular dystrophy is such a disease that causes an increase in CPK levels
in the serum. CPK also increases after a heart attack, beginning~ to 6 hours later, and peaking 24 to 36 hours after the attack. It returns to
normal in about three days. (Anonymous 1976a) .
Glutamic-pvruvic transaminase (SGPT) is present in the liver and, to
a lesser extent, the kidney, heart, and skeletal muscle. Elevated SGPT levels indicate liver damage. (Anonymous 1974b, Diem, ed. 1962).
Glutanic-oxalacetic tr2.nsa:!in2.se (SGOT) is a widelv-distributed e:1
-zyme, out c~e greatest concen~rations of it are :ound in ~he heart anc liver, with slightly lower concentrations i~ skeletal Duscle, kidney, 9an -creas, spleen, and lung. Greatly elevated SCOT levels indicate liver or Duscle damage (if SCPT is also elevated, it is liver damage, otherwise probably muscle). Moderately elevated SCOT levels result from muscle in -juries, muscular dystrophy, pulmonary emboli (obstruction of the pulmon2.ry artery), or pancreatitis. (Anonymous 1976e, Diem, ed. 1962) .
Several enzymes are grouped under the term alkaline phosphatases (ALK), but they all catalyze the conversion of organic phosphate esters to alcohol at an alkaline pH. ALK levels are normally highest in grow -ing animals with a lot of bone development and during pregnancy. Patho -logically high levels of ALK are found in obstructive jaundice (blockage
of bile flow), bone cancer, osteomalacia (softening of fully-formed
38
Diem, ed. 1962). Serum levels rise in cases of vitamin D deficiencv (Searcy 1969), and fall with zinc deficiency (Bos et al. 1977) in humans.
The major cation of the extracellular fluid is sodium. Lowered se
-rum levels of sodium result from diabetes insipidus, metabolic acidosis
(in some cases, in other cases metabolic alkalosis causes it) , Addison's
disease (hypofunction of the adrenal cortex), diarrhea, and renal tubu
-lar disease. Elevated serum sodium levels are found in hyperadrenalism,
severe dehydration, and certain types of brain injury. (Anonymous 1974a) .
Potassium is the major intracellular cation. Prolonged diarrhea or
vomi tting, hyperadrenalism, and some types of alkalosis result in lower
-ed serum levels of potassium. Addison's disease, oliguria (reduced urine
secretion), anuria (no urine secretion), and urinary obstruction cause
elevated serum potassium levels. Any change in the serum level of potas -sium causes a disturbance in myocardial function. C...\nonvmous 197 4d,
Diem, ed. 1962) . Potassium le,:les a:-e low in the serum of malnourisoc:d
infants (Searcy 1969) .
Chloride is the major extracellular anion. High serum levels are
seen in dehydration and conditions causing decreased renal flow (such as
congestive heart failure or renal tubular disease) . Low chloride levels
are found in cases of salt-losing nephritis, metabolic acidosis (and in
some cases metabolic alkalosis), and prolonged vomitting. (Anonymou3
1975c, Diem, ed. 1962).
Calcium exists in the serum in three forms: a protein-bound frac
-tion, a fraction complexed with ions such as citrate or phosphate, and
( ++.
an ionized fraction Ca ) . Calcium levels are high in growing mammals,
t~en level off as growth stops. Hyperparathyroidisrn (overproduction of
the parathyroid glands) causes an initially elevated level of calcium in
39
level may fall below nonial. Too much vi tam in D, mul tiple myeloma
(cancer of the bone marrow) . and some other cancers of the bone also can cause high levels of serum calcium. Low levels are obser1ed in h\·oo
-parathyroidism, steatorhea (excess fat in the feces), nephrosis, nephri
-tis (both diseases of the kidney), and pancreatitis (inflammation of the
pancreas) . (Anonymous 1975b, Diem, ed. 1962) . Calcium levels in the
serum decreased in nutritionally deficient wolves (Seal et al. 1975) .
Most of the body's phosphorous is present as calcium phosphate in
the bones. The remaining phosphorous is involved in carbohydrate meta -bolism, phospholipid and nucleic acid fonnation, ATP production, and other important processes. Phospholipids and inorganic phosphorous are present in the serum. A decrease in the calcium in the serum is accOQ-panied by an increase in se:-um inorganic phosphorous. Therefore, coo cuch vitc1illin D, hypoparath•:roidism. and renal ::'ailure :-esult in an in
-crease in inorganic phosphorous in che serum as well as a decrease in
serum calcium; and rickets and hyperparatl1yroidism initiallv result in
lowered inorganic phosphorous levels. Later, as calcium supplies are
exhausted and the calcium level drops, the phosphorous levels rise.
(Anonymous 1976c, Diem, ed. 1962) . fullOunt of phosphorous in the diet
has a slight effect on serum levels (Searcy 1969) .
The serum glucose le~el is regulated by insulin and various other
hormones. The liver is the major site of serum glucose regulation. The
serum glucose level is elevated during diabetes, and lowered during Ad
-di.son' s disease. It is also slightly higher after eating. (Anonymous
1976b, Diem, ed. 1962).
Cholesterol is the principle animal sterol,
c
27H46
o
.
Many thingsaffect the cholesterol level in the serum, including age, sex, diet,
~o
by thyroid hormones and estrogens. It is elevaced by obstructed biliary
flow, by untreated diabetes ~ellitus, and by hypothyroidism. (Anonvmous 1977b, Diem, ed. 1962). Seru~ levels of cholesterol increased in swine fed diets high in fat and vitamin
o
3 (Huang et al , 1977). Caloric re -striction reduced serlll11 cholesterol in children (1:·hdhalm et al. 1978) .
Bilirubin is a pigment ~roduced by the degradation of hemoglobin in
the reticuloendothelial cells (highly phagocytic cel ls found in the liver,
pituitary and suprarenal glands, and elsewhere) . Serum bilirubin levels
are usually elevated after birth, but rapidly drop. Obstructive jaundice,
hemolytic jaundice, neonatal ~~undice, and hepatitis cause elevated serum
levels of bil irubin. (Anonymous 1975a, Diem, ed. 1962).
Creat inine is formed from creatine phosphate during muscle contrac
-tion. It is passively removed from the blood plasma by glomerular fil
-tration and excreted in t~e 2o~ntain lion (in humans, it is also actively
removed fro~ the blood) . 2i?j ?rotein i~take increased creatinine in
hlll1lans (Searcy 1969) . Ser~~ levels of creatinine do not increase until
kidney function is greatly impaired. Creatinine level measurement is
the most unreliable measurement of the Hycel machine, so not to be
depended upon unless it is found to be very elevated in several trials.
(Anonymous 1975d, Diem, ed . 1962) .
Amino acids are deaminated by the liver to form urea, which is then
~arried by the blood to the kidney. There it is filtered through the
glomerulus, then partially reabsorbed. Serum urea nitrogen levels are
directly related to protein intake. The serlll11 level tripled within 12
hours after ingestion of 230 g of readily digested protein in humans
(Searcy 1969) . Increased serum urea nitrogen levels are seen in cases of
Two types of serum proteins exist: albumif'.s and globulins. The\· ser01e as part of the 1:Jody' s 2::1:.:10 s.cid oool and can be broken dmm and
used to build new proteins, or broken dotm for energv. or transfor~ed into carbohydrates or l ipids. Some serum proteins carry vital ions,
hormones, or lipids from one part of the body to another. Thev are also important in maintaining osmotic pressure and pH of the blood. De
-hydration causes an increase in the concentration of serum proteins (A
r-harmner et al. 1972, Seal et al. 1975). Various diseases and injuries cause a decrease in serum protein levels: kidney disease causes albumin
loss through the kidneys, and severe burns or bleeding also cause a droo
in serum proteins. Inadequate intake of protein is also reflected in
the serum protein level. (Anonymous 1976f, Dien, ed. 1962) .
Globulins are one of :::ie t'.·-'O fractions of serum proteins. T':'ley a:-e
further subdivided into~, 2nd', g~obuli;:is. :ranv of the glc1:,u
-
"'-lins are sythesized in the ii·.·1c::-. Serum glooulin Levels are moder2.:elv increased in many infections , mainly due to increased antibody for.nation (antibodies are y-globulins) . Large elevations of serum globulins are
caused by multiple myeloma (a type of bone cancer). Globulins increase during pregnancy and stress. (c\nonynous 197t+c, Diem, ed. 1962) .
Albumins, the second fr2ction of serum protein, are reduced in the
serum in animals with cancer, but collect abundantly in the cancer cells
themselves (Diem, ed. 1962).
Healthy kidneys are important in maintaining a proper balance in
the internal environment 0£ an animal. Several methods have been deve
-loped to ascertain the state of health of the kidney without actually examining it, but in order to understand those methods, one must first understand how the kidney functions. Blood comes into intimate contact
42
with the kidneys at the glornerulus. There, it is passively filtered ,
and a fluid resembling plasQa is carried on down t~e renal tubules.
Some substances, such as glucose, are then removed from the filtrate
and returned to the blood in capillaries surrounding the tubules while
other substances, such as hvdroxyindoacetic acid (the prinicple meta
-bolite of the vasoconstrictor, serotonin) , are actively removed from
the blood and secreted into the filtrate. (Ganong 1971).
To measure the efficiency of glomerular filtration, a major
detenninant of kidnev healt~. one can measure the concentration in
the plasma or serum of a substance that is neither activelv reabsorbed
nor secreted in the kidney, and compare it with the concentration in
the urine. Such a substance in many animals, including the mountain
lion, is creatinine. Unfortunately, there are ~hree difficulties in using creatinine clearance. 4e could not :at~eterize the females (t~e opening co the ureter was :oo recesse~ i~ the vagina) . As state~ ~r2
-viously, the Hycel machine is fairly unreliable as rar as creatinine
measurements are involved. It is also very difficult to completely
empty the bladder, so faulty measurements are often made. Therefore,
the test was discontinued after seven tr~als. Macy (1978) used a more
reliable method to test renal function. It involved intravenous admin -istration of sodium sulfanilate, then collection of blood samples 30,
60, and 90 minutes after injection. The sulfanilate clearance half