1
Introduction
Infrastructure networks are important for providing accessibility to household and firms. Households need access to jobs, public services and leisure activities. Firms need access to labor, suppliers and cus-tomers. The benefits of being close to other actors, often referred to as agglomeration economies, have been extensively studied in the field of urban and regional economics (Melo, Graham, & Noland, 2009). Investing in infrastructure such as roads and railways has therefore been a common way to increase accessibility and enhance economic activity. Railways offer high-capacity transportation but incur high fixed costs, and there is mixed evidence of the effects of such investments (Debrezion, Pels, & Rietveld, 2007; Higgins & Kanaroglou, 2016; Mohammad, Graham, Melo, & Anderson, 2013). Several explanations to these differences have been mentioned, such as different types of communica-tions and different local context (Lieske, van den Nouwelant, Han, & Pettit, 2019). One reason for the differences is the extent to which investments contribute to achieving agglomeration economies
(Chat-Article history:
Received: September 6, 2019 Received in revised form: April 7, 2020
Accepted: September 28, 2020 Available online: January 15, 2021
Copyright 2021 Helena Bohman & Désirée Nilsson http://dx.doi.org/10.5198/jtlu.2021.1664
ISSN: 1938-7849 |Licensed under the Creative Commons Attribution – Noncommercial License 4.0
The Journal of Transport and Land Use is the official journal of the World Society for Transport and Land Use (WSTLUR) and is published and sponsored by the University of Minnesota Center for Transportation Studies.
Helena Bohman
Malmö University and K2–The Swedish Knowledge Centre for Public Transport helena.bohman@mau.se
Désirée Nilsson
Malmö University and K2–The Swedish Knowledge Centre for Public Transport desiree.nilsson@mau.se
Borrowed sizes: A hedonic price approach to the value of network
structure in public transport systems
Abstract: Property prices are known to be higher in places with high accessibility, such as in proximity to train stations and especially to commuter rail, than in places without this access. This study provides a better understanding of how regional accessibility, through the structure of railway networks, can influence local agglomeration economies by providing accessibility to large labor markets. Previous literature has shown a positive impact of proximity to railway stations on housing prices, and our study adds to the literature by analyzing the impact of network structure. We argue that public transport systems can support the benefits of city networks in line with Alonso’s concept of borrowed sizes (1973). Using network theory to measure accessibility provided by the network, we show that stations that provide accessibility to large labor markets across the region are perceived as more attractive by households. Cities in proximity to other cities are strengthened through their public transport links, which allow agglomeration benefits to be exploited by residents.
Keywords:Hedonic price model, network theory, centrality measures, labor market accessibility, commuter rail
man & Noland, 2011). Effects tend to be larger when investments involve the integration of large labor markets and when marginal accessibility is significantly improved (see e.g., Knudsen & Rich, 2013).
Infrastructure can contribute to agglomeration economies through providing faster access to mar-kets. It is however not only the size of a particular city that matters for agglomerations; the overall structure of city networks may also contribute (Blumenfeld-Lieberthal, 2009; Capello, 2000). Alonso (1973) introduced the concept of “borrowed size,” implying that a town or city benefits from being close to large markets. Previous research (Gonçalves, Portugal, & Nassi, 2009) stresses the importance of network structure in overall planning systems and suggests that analysis of the network and the posi-tion of its nodes is useful in planning that contribute to sustainable mobility and overall urban develop-ment. Straatemeier (2008) argues that urban transport planning should focus on developing places in the urban network, providing households and firms the ability to reach more opportunities without necessarily increasing mobility. In this study, we use the concept of borrowed sizes to develop a model in which the value of being close to a station is a function of where in the railway network the station is located. The quality of a station is thus a function of the qualities of nearby stations. Accessibility to labor markets is often modelled in hedonic price models (HPM), but most studies model local accessibility rather than through transport systems. We argue that the relevant characteristics of a station is what type of accessibility it offers through the rail network, and therefore accessibility should take the network into account. In developed economies, where specialization is fundamental, labor markets are regional rather than local. Introducing network theory into HPM can contribute to filling this gap. In line with Alonso’s findings, Johansson and Quigley (2004) argue that networks of people dispersed over space can substitute for agglomerations at a single point. Introducing network analysis into transportation research also contributes to a better understanding of land use. Curtis and Sheurer (2017, p.2) claim that: "If
public transport is to offer a real alternative transport mode choice to the car, there is a need for a new approach to planning and evaluating public transport accessibility, which takes into account the transport network and also assesses the integration of this network with land use and the consequent activity opportunities."
The aim of this paper is to contribute to a better understanding of the impacts of infrastructure networks on regional development. More specifically, the purpose is to evaluate the impact of network structure, and the characteristics of railway stations derived from network analysis, on property prices. We argue that introducing network theories as a complement to more traditional measures of agglom-eration improves our understanding of not just local development, but also of how regional accessibility may influence local agglomeration economies. In doing so, we rely on previous research on networks. Freeman (1977, 1978) developed measures of network characteristics that have since been applied in many different types of literature. In this paper we apply these measures to control for accessibility quali-ties of nodes in a network of regional commuter trains and integrate them into an overall framework of HPM. These measures capture both physical aspects of the infrastructure and planning-related charac-teristics. Thus, this article join three strands of research fields, network theory, regional economics and transport planning. Network measures are applied and analyzed in the context of regional economics, and transport planning brings a dimension to how the physical network is used in order to create ac-cessibility.
The structure of this article is as follows. The next section reviews previous literature on accessibil-ity and networks. It also includes some previous literature on HPM, which is primarily of interest in this study for its ability to provide information on the value of non-market goods. This is followed by a presentation of network measures and their application in this study. Data and the HPM specification are then presented, followed by the findings. The final two sections contain discussion and conclusions, as well as possible applications of the results.
2
Accessibility and networks – previous research
Cities are essential for regional economic growth. It is in densely populated areas that the benefits of matching, learning and sharing can be developed and can contribute to agglomeration economies (Laird & Venables, 2017). These benefits are largely local to their nature and attenuate with distance (van Meeteren, Neal, & Berudder, 2015). The notion that land value increases when accessibility increases stems from the early geographical theories of Alonso (1964), who identified that land rent – defined as the capitalized value of land – is a function of accessibility to goods and services. This suggests that in-vestments in infrastructure that increase accessibility should translate into increasing property prices for areas that benefit from the increased accessibility. In the Alonso monocentric model, accessibility is often measured as distance to the central business district (CBD). However, critics have pointed out that jobs are not necessarily concentrated in the CBD. Osland and Thorsen (2008) developed measures related to accessibility to the labor market, but still found distance to the CBD significant. This is interpreted as an urban attraction effect of the center, capturing types of services and attractions other than labor market related services.
The size and density of a city may, however, not be the only contributors to agglomeration econo-mies. The performance of places also depends on the surrounding agglomerations and on the interaction of cities in networks. The network structure of cities can affect their productivity, and previous studies suggest that connectivity between cities is important in explaining their productivity levels (Blumenfeld-Lieberthal, 2009). This seems especially important for European cities compared to cities in other parts of the world where often the largest city in a country demonstrates the highest level of productivity (McCann, 2012). Johansson and Quigley (2004) argued that agglomerations and networks are comple-mentarities when it comes to creating benefits for market participants. The connectivity of urban spaces has also been discussed under the idea of urban network externalities (Capello, 2000), referring to the interrelationship of cities. Network theories can therefore provide a complement to the more traditional measures of agglomeration. In research on urban development network theories have gained recent in-terest since they are considered important for facilitating exchange between and within agglomerations. It also seems that these network externalities are becoming more and more important, since larger cities are not growing faster than smaller cities (Meijers, Burger, & Hoogerbrugge, 2015). In a network of cities it is possible for smaller cities to benefit from agglomeration economies if they are located close to a larger city. Alonso (1973) referred to this phenomenon as “borrowed size,” stating that smaller places can exhibit the effects of agglomeration economies by being located close to a larger city. Infrastructure investments can thus be seen as a tool to achieve these “borrowed sizes.”
The use of network theory to analyze relations between people started in the field of social net-works in the 1950s (Derrible, 2012). An important difference between social and transport netnet-works is that transport networks are geographically positioned with exact locations in a three-dimensional space. Centrality measures have been developed to describe the nature of physical positions in the network. Freeman (1978) developed three measures of centrality in a network, which have since gained large ac-ceptance in the network literature. Closeness centrality measures the sum of inverse distance to other stations in the network, sometimes weighted by the relative importance of each station. The second measure, degree centrality, measures the number of direct connections in the network. From previous literature we know that connections are perceived as negative for travelers, not least commuters. The third measure, betweenness measures transit characteristics (Derrible, 2012) and measures how often a station is passed, given the structure of the traffic of the network. These measures will be presented in more detail in the following section.
In transportation studies, network analysis has been applied to measure and classify different cities and countries according to their topological characteristics (e.g., Curtis & Scheurer, 2017). The notion
that better connected cities are correlated with economic development is stressed by Blumenfeld-Lieber-tahal (2009) who typologize countries according to the topology offered by transportation networks, and find that countries with highly connected and clustered networks have higher productivity levels. Like Derrible (2012), Curtis and Sheurer (2017) use network measure to describe and compare pub-lic transport systems internationally at city level. Crucitti, Latora, and Porta (2006) also use network measures for comparing cities, providing a comparative analysis of how cities differ in terms of different network characteristics. Gonçalves et al. (2009) suggest using centrality measures as a means to provide a more balanced development of places when planning and developing public transport. In a case study of the development of bus transportation in Rio de Janeiro they highlight how centrality measures can be used to show how investments affect both the characteristics of stations as well as the accessibility of other types of services such as hospitals, day care centers and schools.
In a study of 28 metro systems from different parts of the world, Derrible (2012) set out to provide a global approach to the development of centrality. She stresses the role of the betweenness indicator, which captures the transit characteristics of the metro systems. This conclusion is also shared by To (2015) who uses the measure to identify characteristics of the Hong Kong urban rail system. Li, Xu and Shi (2015) applied network theory to studies of the dynamic evolution of world shipping, showing the central but declining position of Europe in the world shipping network.
Several of the mentioned articles aim at characterizing cities, countries, or transport systems ac-cording to topological properties. It seems to be clear from previous literature that although network characteristics potentially are good measures of connectivity, the topological measures capture different properties and it is not possible to a priori say that one measure is better than the others (Curtis & Scheurer, 2017). In this study we aim to add a second step to the discussion, namely to introduce the revealed preferences of households for network characteristics. This study adds to the above literature by introducing consumers’ willingness to pay for centrality, through the use of housing prices.
3
Estimating willingness to pay: Hedonic price models
The method of using house prices as a means to estimate attribute values was developed by Rosen (1974), and have since become standard tools for estimating the values of a vast array of non-market goods such as noise (Nelson, 2004), green areas (Czembrowski & Kronenberg, 2016) and proximity to good schools (Nguyen-Hoang & Yinger, 2011). Although accessibility is considered central to explain households willingness to pay for housing, there are no previous studies introducing the role of networks in an HPM setting. Xiao, Orford, and Webster (2016), using Cardiff as a case study, modelled street network accessibility to explain housing prices. The results suggest that accessibility measures can replace some traditional measures such as distance to CBD and can be used to model both positive and negative externalities.
3.1 Measures of network and node characteristics
Transportation networks typically differ from social networks in some respects. Their position is set since they are fixed in geographical space. However, for railways there is also a difference between the physical network and the planned use of the network, in terms of train lines for example. Therefore, the network structure may change as a result of traffic planning even if the physical network remains unchanged.
A network can be defined as a number of nodes that are connected by links. Freeman (1977) presents three measures of centrality that have become common in social network analysis and that are also applied to urban structures and transportation networks. These three measures, closeness, degree and
betweenness centrality, have commonly been used to indicate the role and strength of different nodes in
a network. Definitions of the different measures vary across studies.
Closeness centrality has to do with the how many points of interest can be reached through the network, adjusted for distance. That means that a node with higher closeness centrality communicates more quickly with other elements in the network. In the setting of this study the measure will capture how many potential jobs can be reached from a certain station, given the characteristics of the network. It considers accessibility as “ease of movement and can be described as an average score for travel impedi-ment” (Curtis & Scheurer, 2017). In its simplest form, closeness centrality corresponds to the inverse of the sum of the distances, as shown in equation (i).
(i)
CC ( vi ) is the closeness centrality for node i in which dist ( vi ,vj ) denotes the distance between node i and j, which both are parts of network V, which constitutes of n nodes. This measure is sometimes
de-veloped to express distance in an exponential form as a way to capture a distance decay effect. Typically, this implies that the effect of node j on node i diminishes as the distance between the nodes increases. Another extension of the model is to weigh the expression by the strength of the respective node. These two adjustments provide a gravity element to the expression, in which larger and closer nodes have a stronger force of attraction than smaller, more distant ones (equation ii).
(ii)
The choice of weights may differ depending on the theoretical perspective. One option would be to use the number of departures as a proxy for the strength of the links. We will rely on previous literature using proximity to workplaces and weigh the expression by the number of people employed within a radius of three kilometers from each destination station (vj ). α is set at a value of 2.5. Wj is a measure of the number of jobs within the buffer area of station j. Note that in this interpretation of the measure, we separate the labor market around the station from those achieved through the network. This is because the study aims at providing separate measures for accessibility provided by the network from the local accessibility.
The second measure is degree centrality, CD , as shown in equation (iii). It specifies the number of direct relations with other nodes in the network. This can be explained as the capacity to receive, for example, information in an information network. In this case, it provides a measure of how many stations can be reached without changes, which is an important feature for many travelers. Not least is the possibility of interrupted trips of importance for commuters, since the travel time can provide op-portunities for work or some leisure time activities such as reading or listening to music. Any changes imposed during the trip implies less possibilities to use the travel time for other activities than just travel.
(iii)
This measure has been modelled as the number of direct relations with other nodes in a network, and d (vi ) is the count data of the number of direct relations along planned train lines – that is, the
number of stations that can be reached without changing trains. Stations trafficked by several lines thus receive higher values. The scheme for the regional rail system in Scania is used to construct the adjacency matrix. The number of stations that can be reached without changing trains can be determined by counting the number of observations in columns or rows. The adjacency matrix also reveals the number of lines that stop at each station since the different lines are included separately. Only stops within the region are taken into account. Consequently, stops on the interregional lines outside the administrative borders of Scania are not included in the adjacency matrix.
The third measure, betweenness, captures the transfer characteristics of a station. Derrible (2012) uses a betweenness indicator only for transfer and end points in the metro network, in order to high-light the transfer characteristics of a node, based on the idea that the relative dependence of a node is an important aspect of its structural position.
(iv) This is reflected in the number of times that a node partakes in an interaction over the shortest path in a network. The betweenness centrality corresponds to the number of trains gkj (vi ) that pass through the node vi in relation to the total number of paths, denoted by gkj . As a result, each node is given a probability, where high levels indicate that the node is more central in the network. Normalized mea-sures are necessary when comparing different systems (Derrible, 2012). In this study we will compare two regional public transport network systems. Normalization is applied by summing values of all the nodes and using it as a denominator. Thus, the measure ranges from zero to one, indicating the likeli-hood that a train station is part of a journey between two nodes in the network system. The adjacency matrix is used for the calculation of the betweenness measure.
The three measures thus provide different topological characteristics of the train network. In the next section, the measures will be applied on the empirical data.
3.2 Node characteristics: Stations in the Scania railway network
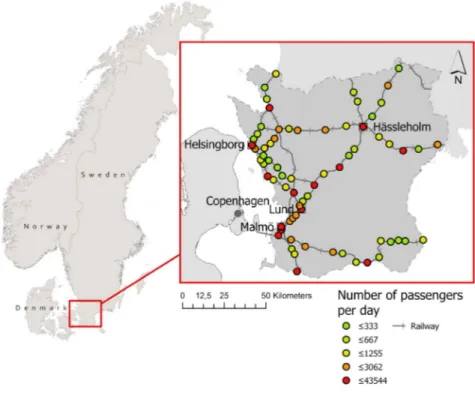
The analysis is applied to the Scania region, which is the most southern region of Sweden with 1.3 mil-lion inhabitants (Figure 1). Early industrialization resulted in nationwide investments in railways, which have had long-lasting effects on the development of the built environment (Berger & Enflo, 2015). As cars became available on a large scale to households, investment in railways decreased drastically. In the region, the old railway infrastructure has over the years been kept relatively intact, thereby offering an opportunity in recent years to upgrade communications in a relatively affordable manner by opening up new stations along existing lines. The main economic center in the Scania region is the Malmö–Lund area in the southwest, accounting for a population of slightly less than half a million people. The re-gion also has close access to Denmark, as it is connected in the south to the capital Copenhagen by the Öresund Bridge. The region is however often described as polycentric. In the north-western corner, the second economic center in the region is Helsingborg, with about 100,000 people and ferry connections to Helsingør on the Danish side. The region is defined as having two labor markets; the one containing the western part of Malmö–Lund and Helsingborg, and the eastern part which is less densely populated and the smaller labor markets centers of Hässleholm and Kristianstad. Recent investments in commuter rail, together with the polycentric structure of the region, make it an interesting area for analyzing the effects of railway networks.
Figure 1. Map of the Scania region and rail network together with number of passengers per day per station in 2017 As presented in Figure 1, the railway network is focused on the west side of the region. In the north-east, Hässleholm is a central node for the trains running south–north as well as west–east. There is also one railway running north–west, connecting to the west coast and the city of Halmstad. In the south, there is a single railway connecting the cities of Simrishamn and Ystad with the Malmö–Lund area. The railway network consists of national routes connecting Malmö and Lund to the capital, Stockholm, as well as to the second largest city in Sweden; Gothenburg. The connection to Gothenburg goes along the west coast through Helsingborg. The network also consists of regional train lines that serve as com-muter lines to the different parts of the region. These regional train lines are made up of two types. The Öresundståg, connecting the region to other regions in Sweden as well as to Denmark, stops at fewer stations in the network. The Pågatåg is more local and slower due to more frequent stops. The average number of passengers from each station in the region is shown in figure 1, indicating the sizes of the stations in the network. The number of passengers from stations is strongly correlated with the numbers of departures.
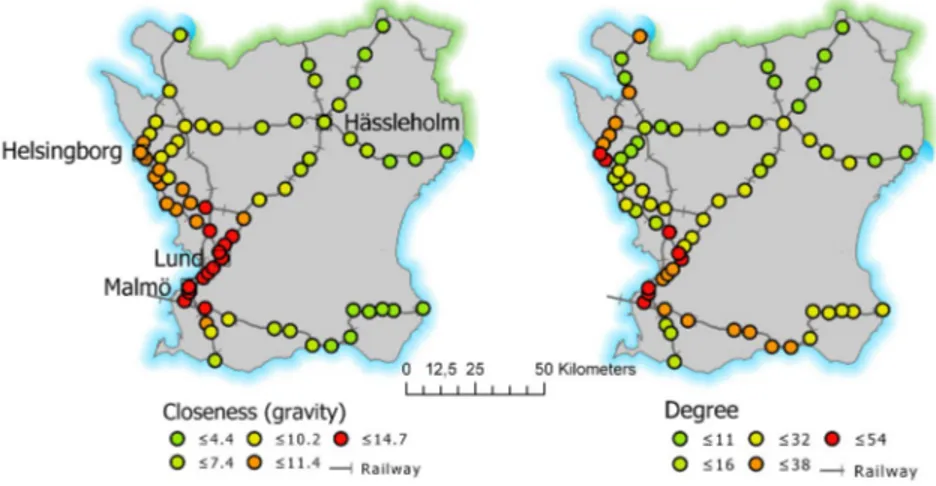
Figure 2 presents both the closeness centrality (to the left) and the degree centrality (to the right). The measure of closeness centrality illustrates the accessibility of each station to other stations in the network, taking into account the size of the stations. Size is here measured by the number of jobs within a radius of three kilometers. To calculate the values for Copenhagen, the number of commuters across the bridge has been used as a proxy for the number of employments. In 2016, this number was 13,800, but since then numbers have decreased (Öresundsinstitutet). Accessibility to other sizeable stations is desirable, but attractiveness decays with distance. The measure therefore builds on the traditional gravity assumption that larger nodes are more attractive than smaller nodes, and that the attractiveness of nodes lessens as the distance between nodes increases. In economic terms, this is in line with agglomeration theories, in which larger markets are more attractive. Through the network of commuter railway people benefit from access to labor markets in the region. Thus, local places get accessibility to regional
agglom-eration economies by the networks. The figure shows that the stations with the highest accessibility are located in and between Malmö and Lund, followed by stations just outside the area, most of which are on the route to Helsingborg. Stations in smaller places in proximity to larger cities exhibit high scores with this measure, in the same way as their larger neighbors.
Figure 2. Centrality measures: closeness (to the left, based on eq. ii) and degree (to the right based on eq. iii)
The degree centrality measure shows the number of stations with direct connections, that is, reach-able without changing lines. From a commuter perspective this implies the opportunity for uninter-rupted travels, thereby increasing the quality of the trips. The figure reveals how this type of accessibility differs from some more commonly used measures, since some quite peripheral stations still score fairly well given that they are along traffic lines with stops at many stations. For commuters this should be an attractive characteristic of a location. Thus, this measure partly captures the effect of traffic planning, since changing the planning will also affect the number of stations that can be reached directly. The highest scoring stations are, however, still the stations in the largest urban areas.
The final centrality measure used in this article is betweenness. This measure is also calculated based on how the regional train lines are planned. As mentioned before, there are two types of commuter train lines, the Öresund trains and the Pågatåg trains. The betweenness measure is calculated for each of the two types, using the planned line routes. In Figure 3, the measure for Öresund trains is displayed on the left and the calculations for Pågatåg trains are presented on the right.
Figure 3. Betweenness centrality based on eq. iv. The map on the left is based on stations in the Öresund train network, and the map to the right is based on the Pågatåg train network.
The Öresund trains stop at fewer stations, covering the central nodes in the region and allowing for direct and faster transport between these nodes. These trains also continue on to other regions. Along the west coast, the trains serve stations all the way to Gothenburg. In the east, trains continue from Hässle-holm either out to the east coast of Sweden or further northeast into the bordering region of Småland. The Öresund trains also connect across the bridge to Copenhagen. The Pågatåg train network covers more of the Scania region and gives smaller places access to commuter trains. The scale of the between-ness measure of the two networks reflects the large differences in the numbers of nodes in their networks. Using this measure the core of the Öresund train network is in Lund. For the Pågatåg trains, stations in and between Malmö and Lund as well as in Helsingborg and Hässleholm receive high scores with this measure. Higher scores are also shown for the stations between Lund and Hässleholm and Hässleholm and Helsingborg. These higher scores reflect how the lines have been planned. It is possible to enter a train east of Helsingborg and first travel to Hässleholm before going south to Lund. Thus, the stations in the smaller towns between Helsingborg and Hässleholm have access to Lund and Malmö, even though the train will stop at many stations on the way.
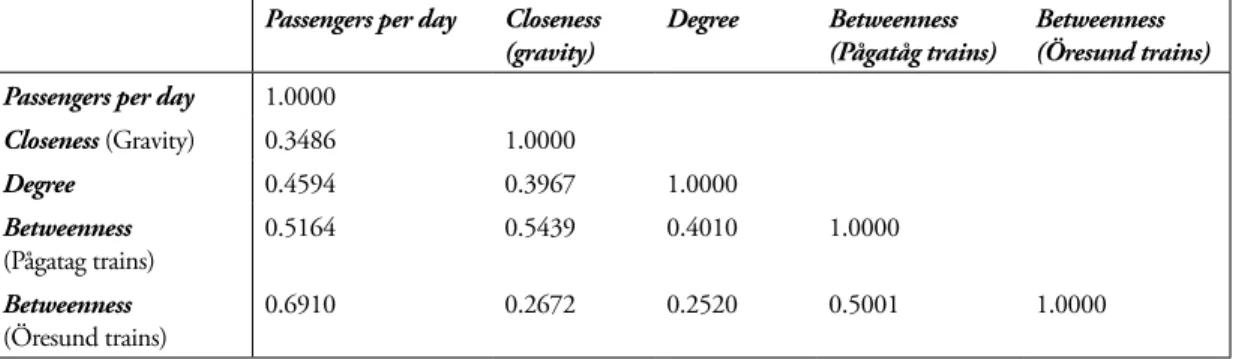
These three centrality measures, closeness, degree and betweenness, jointly with the number of pas-sengers travelling from the station present properties of the stations and of the railway networks they are nodes in. Pairwise correlations of the four measures are presented in Table 1
Table 1. Pairwise correlation of node characteristics, including centrality measures Passengers per day Closeness
(gravity)
Degree Betweenness (Pågatåg trains)
Betweenness (Öresund trains) Passengers per day 1.0000
Closeness (Gravity) 0.3486 1.0000 Degree 0.4594 0.3967 1.0000 Betweenness (Pågatag trains) 0.5164 0.5439 0.4010 1.0000 Betweenness (Öresund trains) 0.6910 0.2672 0.2520 0.5001 1.0000
There is a strong correlation between the measure Betweenness (Öresund trains) and the variable Passengers per day. The Öresund network cover the central nodes in the region, which also has more travelers. The other measures present only moderate correlations which means that they capture differ-ent qualities of the stations. The betweenness measure for the Pågatåg trains network are moderately correlated with Passengers and Closeness, indicating that higher likelihood for being part of a journey is related to accessibility to regional agglomeration and number of passengers per day.
4
The value of network characteristics
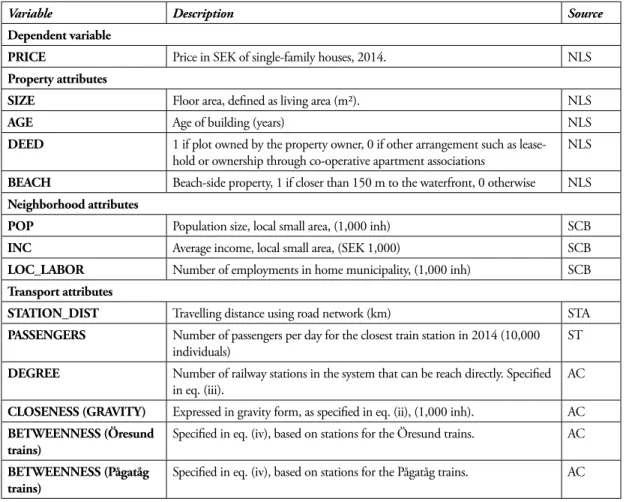
The formulation of HPM typically differs across studies, partly as a result of differences in data col-lection (Debrezion et al., 2007; Mohammad et al., 2013). The variables, presented in Table 2, can be divided into three major groups: property attributes, neighborhood attributes and transport attributes. The housing data, obtained from the Swedish cadastre, consist of all transactions involving single-family housing in the Scania region in 2016. Many studies rely on data from property brokers, which account for only part of the market, whereas the cadastre data contains all transactions. Non-market transactions have been removed. Socio-economic variables on income and population were collected from different sources all originating from Statistics Sweden. The Swedish Transport Administration provides data on the physical infrastructure in terms of railway and road data. The set-up of lines in regional commuter systems is planned by the regional public transport authorities, and so data on train lines were collected from the regional administration Skånetrafiken.
Table 2. Variable definitions
Variable Description Source
Dependent variable
PRICE Price in SEK of single-family houses, 2014. NLS
Property attributes
SIZE Floor area, defined as living area (m2). NLS
AGE Age of building (years) NLS
DEED 1 if plot owned by the property owner, 0 if other arrangement such as lease-hold or ownership through co-operative apartment associations NLS BEACH Beach-side property, 1 if closer than 150 m to the waterfront, 0 otherwise NLS Neighborhood attributes
POP Population size, local small area, (1,000 inh) SCB
INC Average income, local small area, (SEK 1,000) SCB
LOC_LABOR Number of employments in home municipality, (1,000 inh) SCB Transport attributes
STATION_DIST Travelling distance using road network (km) STA
PASSENGERS Number of passengers per day for the closest train station in 2014 (10,000
individuals) ST
DEGREE Number of railway stations in the system that can be reach directly. Specified
in eq. (iii). AC
CLOSENESS (GRAVITY) Expressed in gravity form, as specified in eq. (ii), (1,000 inh). AC BETWEENNESS (Öresund
trains) Specified in eq. (iv), based on stations for the Öresund trains. AC BETWEENNESS (Pågatåg
trains) Specified in eq. (iv), based on stations for the Pågatåg trains. AC Note: NLS: National Land Survey (Lantmäteriet), SCB: Statistics Sweden, STA: The Swedish Transport Agency, ST: Skåne-trafiken, AC: authors’ calculations based on data above.
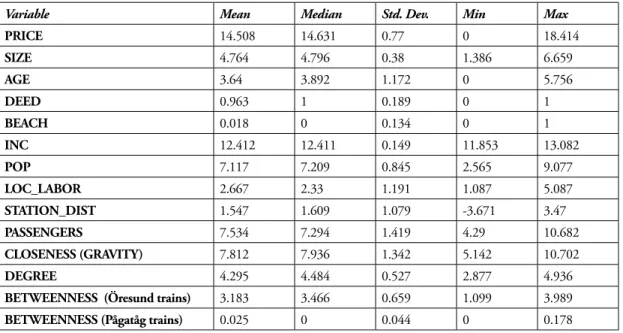
The descriptive statistics of the data in Table 3 provide some key insights into the region of Scania. About two percent of the single-family houses sold in 2016 had direct access to a beach, and the average house had a size of 117 square meters and was about 25 years old. As mentioned before, there are large differences in the geography of the region. There are also large differences in the average number of pas-sengers per day travelling from the different stations in the railway network.
Table 3. Descriptive statistics (variables in natural logs)
Variable Mean Median Std. Dev. Min Max
PRICE 14.508 14.631 0.77 0 18.414 SIZE 4.764 4.796 0.38 1.386 6.659 AGE 3.64 3.892 1.172 0 5.756 DEED 0.963 1 0.189 0 1 BEACH 0.018 0 0.134 0 1 INC 12.412 12.411 0.149 11.853 13.082 POP 7.117 7.209 0.845 2.565 9.077 LOC_LABOR 2.667 2.33 1.191 1.087 5.087 STATION_DIST 1.547 1.609 1.079 -3.671 3.47 PASSENGERS 7.534 7.294 1.419 4.29 10.682 CLOSENESS (GRAVITY) 7.812 7.936 1.342 5.142 10.702 DEGREE 4.295 4.484 0.527 2.877 4.936
BETWEENNESS (Öresund trains) 3.183 3.466 0.659 1.099 3.989
BETWEENNESS (Pågatåg trains) 0.025 0 0.044 0 0.178
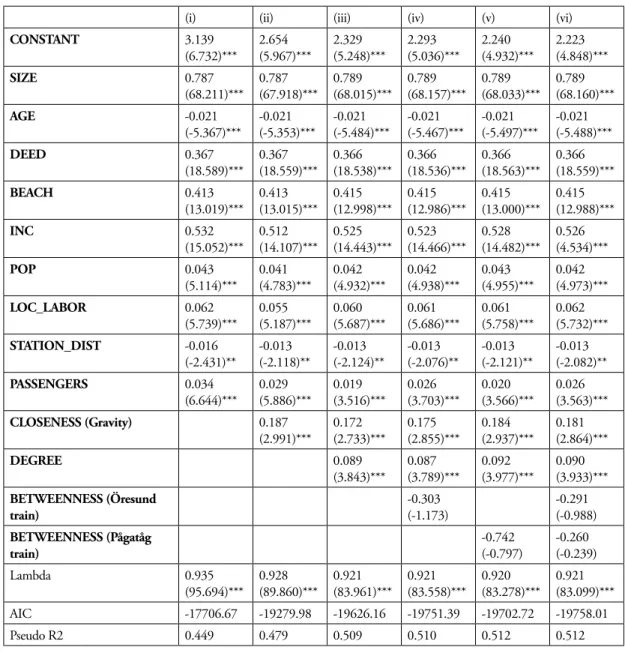
Table 4 shows the results from the HPM. Columns (i) to (vi) show the results as station character-istics are successively supplemented. Estimates using the base ordinary least squares model provided sig-nificant results for robust Lagrange multiplier testing for both error and lag. However, the test statistics provided higher value for a spatial error model to be performed (Osland, 2010). A spatial error model (SEM) was applied to all regression models using generalized method of moments (GMM) estimations. The weight matrix was calculated using Euclidian distances, with a default bandwidth estimated using GeoDa Space software (Anselin, Syabri, & Kho, 2006). Standard errors were estimated based on Kele-jian and Prucha (2010). Using SEM means that the estimated parameters will be efficient since lambda accounts for any misspecification as well as spatial autocorrelation in the models.
The ordinary variables used in HPM turn out as expected and are stable across the different model specifications used. Income and population in the local small area have a positive effect on price, as well as the number of employments in the municipality where people live. The number of jobs measure local agglomeration effects and show an elasticity of 0.05-0.06. The variable distance to station are as expected negative, with an elasticity of around -0.01.
Station and network characteristics present interesting results. PASSENGERS show positive pa-rameters over all specifications, although the papa-rameters fall somewhat as more variables are added to the model. Adding CLOSENESS to the specification (column (ii)) improves the PseudoR2 to 0.479. The estimated coefficient represents a positive impact on sales prices of single-family houses. Thus, the significant result of this variable reflects that it measures the importance of accessibility to workplaces in other nodes of the network. In accordance with Osland and Thorsen (2008) our results show that
accessibility to workplaces has a positive impact on housing prices. As the variable is a weighted mea-sure of employments in the vicinity of destination stations, and distance is meamea-sured using the rail infrastructure, it also indicates the perceived utility of using public transport for work. This suggests that household value both the local agglomeration as well as the agglomerations provided through the network. Adding the variable DEGREE, which measures direct access to other stations, the estimated parameter also turns out significant and positive with an elasticity of around 0.09. Thus, the number of stations that you can reach without changing trains has a significant impact on the price of single-family houses. The relevance of not having to change trains in order to get to destinations in the network seem to enhance the importance of closeness to labor market in other nodes of the network.
Table 4. Results from HPM regressions using spatial error model. Z values in parentheses, *** p<0.01, ** p<0.05, * p<0.1. N=18,273, all continuous variables in log form
(i) (ii) (iii) (iv) (v) (vi)
CONSTANT 3.139 (6.732)*** 2.654 (5.967)*** 2.329 (5.248)*** 2.293 (5.036)*** 2.240 (4.932)*** 2.223 (4.848)*** SIZE 0.787 (68.211)*** 0.787 (67.918)*** 0.789 (68.015)*** 0.789 (68.157)*** 0.789 (68.033)*** 0.789 (68.160)*** AGE -0.021 (-5.367)*** -0.021 (-5.353)*** -0.021 (-5.484)*** -0.021 (-5.467)*** -0.021(-5.497)*** -0.021 (-5.488)*** DEED 0.367 (18.589)*** 0.367 (18.559)*** 0.366 (18.538)*** 0.366 (18.536)*** 0.366 (18.563)*** 0.366 (18.559)*** BEACH 0.413 (13.019)*** 0.413 (13.015)*** 0.415 (12.998)*** 0.415 (12.986)*** 0.415 (13.000)*** 0.415 (12.988)*** INC 0.532 (15.052)*** 0.512 (14.107)*** 0.525 (14.443)*** 0.523 (14.466)*** 0.528 (14.482)*** 0.526 (4.534)*** POP 0.043 (5.114)*** 0.041 (4.783)*** 0.042 (4.932)*** 0.042 (4.938)*** 0.043 (4.955)*** 0.042 (4.973)*** LOC_LABOR 0.062 (5.739)*** 0.055 (5.187)*** 0.060 (5.687)*** 0.061 (5.686)*** 0.061 (5.758)*** 0.062 (5.732)*** STATION_DIST -0.016 (-2.431)** -0.013 (-2.118)** -0.013 (-2.124)** -0.013 (-2.076)** -0.013 (-2.121)** -0.013 (-2.082)** PASSENGERS 0.034 (6.644)*** 0.029 (5.886)*** 0.019 (3.516)*** 0.026 (3.703)*** 0.020 (3.566)*** 0.026 (3.563)*** CLOSENESS (Gravity) 0.187 (2.991)*** 0.172 (2.733)*** 0.175 (2.855)*** 0.184 (2.937)*** 0.181 (2.864)*** DEGREE 0.089 (3.843)*** 0.087 (3.789)*** 0.092 (3.977)*** 0.090 (3.933)*** BETWEENNESS (Öresund train) -0.303 (-1.173) -0.291 (-0.988) BETWEENNESS (Pågatåg train) -0.742 (-0.797) -0.260 (-0.239) Lambda 0.935 (95.694)*** 0.928 (89.860)*** 0.921 (83.961)*** 0.921 (83.558)*** 0.920 (83.278)*** 0.921 (83.099)*** AIC -17706.67 -19279.98 -19626.16 -19751.39 -19702.72 -19758.01 Pseudo R2 0.449 0.479 0.509 0.510 0.512 0.512
The two variables representing BETWEENNESS capture transfer possibilities in two types of re-gional public transport networks. The Öresund train network stops at fewer stations allowing for direct and faster mobility between nodes, while the Pågatåg network covers more stations in the region provid-ing commuter trains to also smaller places. Both betweenness measures turn out insignificant. In the context of regional train networks, transfer possibilities in nodes does not seem to impact the perceived value of single-family houses.
This article addresses the importance of regional public transport system and access to agglomera-tion economies in regional economic development. Most previous studies that consider the importance of accessibility using hedonic price model performs it in a more local context. The regional setting in this study incorporate more heterogeneity compared to local settings, which explain the lower fit of the model. AIC statistics are provided as a complement to the pseudo r2, and indicate that the variables added contribute to the model specification, and improve as the network variables are added.
5
Discussion
This study aims to provide a better understanding of regional development by focusing on how network structure and node characteristics of public transport network influence willingness to pay for housing. By introducing measures based on network theory, we can analyze not only local agglomerations, but also how the network can help exploit agglomerations accessible through the network. Thus, by using measures that capture network characteristics we can better understand how regional accessibility can influence local agglomeration economies.
Four characteristics have been explored by using three centrality measures and the size of stations in terms of passengers travelling. These variables are not highly correlated among themselves, which in-dicates that they capture different aspects of the network. Among the control variables in the base speci-fication, number of employments in home municipality is included. Including network characteristics provide measures of access to regional agglomerations in local markets. Although the explanatory power of the models are lower than most HPM estimates, the findings are robust across the specifications. Results show that the network variables improve the fit of the model and thus contribute to the variables used in the base model. In the words of Alonso (1973), local markets can benefit from borrowed ag-glomerations accessible through the public transport network.
The first network variable introduced was the closeness measure, applied as a gravity specification, and it captures accessibility to labor markets, as measured through the indirect effects offered by the re-gional rail system. The estimate of this variable implies an elasticity of 0.18 - 0.20, all else equal. Using our definition of this measure, the stations with the lowest gravity measures provide a labor market of slightly less than 20,000 employed people. The station with the highest corresponding number provides accessibility to approximately 214,000 employments. As an example of how important this aspect is in economic terms, one can compare a house close to the station providing the least accessibility (low close-ness score) to one demonstrating the highest accessibility (high closeclose-ness score). A house by the station providing the largest accessibility would then sell for nearly three times the price of an identical house by the station of the lowest accessibility. This effect is in addition to the effect of the local labor market which is already controlled for. In other words, although the exact figures should be interpreted with caution, the findings do suggest an important contribution of the network.
The second centrality measure (Degree) captures the possibility of reaching stations without chang-ing trains. We interpret this as a trip quality indicator; measurchang-ing to what extent a station offers uninter-rupted trips across the network. As expected, this feature has a significant impact on property values with an elasticity of around 0.09. The positive impact of direct connections is not surprising. Given that
the network in question is to a large extent used for commuting, time saving and uninterrupted travel should be considered particularly important since commuters travel almost daily. The possibility of using any time saved for work or leisure is probably an important consideration for many commuters.
Some previous studies (Derrible, 2012; To, 2015) stress the importance of the betweenness mea-sure since it captures the transfer characteristics of the network. In the present study, these meamea-sures are not significant in any specification. We suggest this is due to the focus on a regional context rather than an urban context. In a regional context it is important to note that the geographic center differs from the economic center, and locations scoring high on the betweenness measure could be positioned in quite remote locations that may lie between economic centers. In a metropolitan setting, the position of one metro station between other stations may be of more importance, since the stations tend to be positioned within the larger agglomeration. The present study measures centrality in a regional train system, which differs from metropolitan metro systems. Betweenness in our case, includes transfer in more remote areas that offer relatively poor access to larger labor markets. In our case, since we control for agglomeration and quality (in terms of uninterrupted travels), the impact of transfer possibilities in nodes does not add to the understanding of public transport network contribution to regional economic development.
6
Conclusion
The purpose of this paper has been to investigate the impact of railway network structure on property prices. As often noted in the existing literature, results from hedonic price models differ depending on context, data and modelling. This study adds to the present literature in several ways. First, it aims at in-troducing a regional perspective to how households value accessibility. Labor markets tend to be regional to their character, but most hedonic models are applied to more local contexts. The results suggest that access to regional agglomeration, in terms of labor markets, matter for the local context.
Second, we add to the literature on the effects of accessibility by introducing the impact of the net-work structure of the railway system. Accessibility is measured both directly, through the size of the local labor market, and indirectly, through accessibility provided by the network. Network theories are not new to regional science literature, but they are not often combined with transportation applications, and we are not aware of any previous studies that use network measures as explanatory variables of household willingness to pay for housing. This study adds value by exploring how the commuter train network, and not just the access to a train station, add to the perceived value of housing. Station properties and network characteristics matter for understanding of how effects are distributed across space. Overall, our findings are in line with previous research that suggest that effects should be higher for denser areas, and that transportation networks can extend the benefits of agglomeration to other areas.
The findings furthermore contribute to a better understanding of land use values and accessibility, using house prices as estimates for households’ willingness to pay. Providing housing outside of large city centers, can alleviate some of the negative effects inside cities where high prices, congestions and lack of buildable land are common problems. It can also provide desired injections into other cities or towns within the labor market region.
The study applied three measures of centrality and found that each contributes to the HPM. Among the measures presented here, we interpret closeness as measuring accessibility to labor markets in the region by the use of public transport networks. The results show that train stations that provide accessibility to workplaces across the region are perceived as more attractive by households. In line with Alonso’s concept of borrowed size, proximity to surrounding labor markets via the rail network is reflect-ed in higher housing prices. Although we suggest figures must be interpretreflect-ed with care, the results still
indicate that the effects are considerable. The second measure, Degree, captures one important quality aspect of the rail traffic, namely the possibility to uninterrupted travels. The possibility of reaching sta-tions without having to change trains is important, not least for commuters who may spend substantial time travelling by train. Public transport systems can thus support the benefits of city networks. The third measure, betweenness, measures transfer possibilities and the value of being located in between other stations. In our study, this measure turns out insignificant throughout different specifications. We interpret this as a result of the regional context of the study. Stations located relatively far away from the large labor market seem not to benefit from being located along the train lines, since the accessibility they offer may not be important enough.
Cities in proximity to other cities are strengthened through their public transport links, which en-able residents to exploit agglomeration benefits. The goal of regional transport policies is also to provide accessibility by public transport for all parts of the region irrespective of the location of places in rela-tion to economic centers. Starela-tions may score high on some centrality measures simply because they are centrally located in the geography of the transport system. However, such stations do not contribute to improved valuation of housing if they do not also have good accessibility to agglomerations benefits.
Acknowledgments
The authors gratefully acknowledges financial support from K2 –The Swedish Knowledge Centre for Public Transport and the map works provided by Leif Holmquist.
References
Alonso, W. (1964). Location and land use: Toward a general theory of land rent. Cambridge, MA: Harvard University Press. https://doi.org/10.4159/harvard.9780674730854
Alonso, W. (1973). Urban zero population growth. Daedalus, 102(4), 191–206. Retrieved from https:// www.jstor.org/stable/20024174
Anselin, L., Syabri, I., & Kho, Y. (2006). GeoDa: An introduction to spatial data analysis. Geographical
Analysis, 38(1), 5–22.
Berger, R. T., & Enflo, K. (2015). Locomotives of local growth: The short- and long-term impact of railroads in Sweden. Journal of Urban Economics, 98, 124–138. https://doi.org/10.1016/j. jue.2015.09.001
Blumenfeld-Lieberthal, E. (2009). The topology of transportation networks: A comparison between different economies. Networks and Spatial Economics, 9, 427–458. https://doi.org/10.1007/s11067-008-9067-6
Capello, R. (2000). The city network paradigm: Measuring urban network externalities. Urban Studies,
37(11), 1925–1945. https://doi.org/10.1080/713707232
Chatman, D. G., & Noland, R. B. (2011). Do public transport improvements increase agglomeration economies? A review of literature and an agenda for research. Transport Reviews, 31(6), 725–742. https://doi.org/10.1080/01441647.2011.587908
Crucitti, P., Latora, V., & Porta, S. (2006). Centrality measures in spatial networks of urban streets.
Phys-ical Review E - StatistPhys-ical, Nonlinear, and Soft Matter Physics, 73, 036125. https://doi.org/10.1103/
PhysRevE.73.036125
Curtis, C., & Scheurer, J. (2017). Performance measures for public transport accessibility: Learning from international practice. The Journal of Transport and Land Use, 10(1), 1–26. http://dx.doi. org/10.5198/jtlu.2016.683
Czembrowski, P., & Kronenberg, J. (2016). Hedonic pricing and different urban green space types and sizes: Insights into the discussion on valuing ecosystem services. Landscape and Urban Planning, 146, 11–19. https://doi.org/10.1016/j.landurbplan.2015.10.005
Debrezion, G., Pels, E., & Rietveld, P. (2007). The impact of railway stations on residential and com-mercial property value: A meta-analysis. Journal of Real Estate Finance and Economics, 35(2), 161– 180. https://doi.org/10.1007/s11146-007-9032-z
Derrible, S. (2012). Network centrality of metro systems. PLoS ONE, 7(7) e40575. https://doi. org/10.1371/journal.pone.0040575
Freeman, L. C. (1977). A set of measures of centrality based on betweenness. Sociometry, 40(1), 35–41. Retrieved from http://www.jstor.org/stable/3033543
Freeman, L. C. (1978). Centrality in social networks conceptual clarification. Social Networks, 179, 215–239. Retrieved from http://ac.els-cdn.com.proxy.mah.se/0378873378900217/1-s2.0-0378873378900217-main.pdf?_tid=db734c84-3724-11e7-80e8-00000aacb35f&acdnat=149460 1890_0c78f99120345215804378c6436470f2
Gonçalves, J. A. M., Portugal, L. da S., & Nassi, C. D. (2009). Centrality indicators as an instrument to evaluate the integration of urban equipment in the area of influence of a rail corridor. Transportation
Research Part A: Policy and Practice, 43, 13–25. https://doi.org/10.1016/j.tra.2008.06.010
Higgins, C. D., & Kanaroglou, P. S. (2016). Forty years of modelling rapid transit’s land value uplift in North America: Moving beyond the tip of the iceberg. Transport Reviews, 36(5), 610–634. https:// doi.org/10.1080/01441647.2016.1174748
Johansson, B., & Quigley, J. M. (2004). Agglomeration and networks in spatial economies. Papers in
Kelejian, H. H., & Prucha, I. R. (2010). Specification and estimation of spatial autoregressive mod-els with autoregressive and heteroskedastic disturbances. Journal of Econometrics, 157(1), 53–67. https://doi.org/10.1016/j.jeconom.2009.10.025
Knudsen, M. A., & Rich, J. (2013). Ex post socio-economic assessment of the Oresund Bridge.
Trans-port Policy, 27, 53–65. https://doi.org/10.1016/j.tranpol.2012.12.002
Laird, J. J., & Venables, A. J. (2017). Transport investment and economic performance: A framework for project appraisal. Transport Policy, 56, 1–11. https://doi.org/10.1016/j.tranpol.2017.02.006 Li, Z., Xu, M., & Shi, Y. (2015). Centrality in global shipping network basing on worldwide shipping
areas. GeoJournal, 80, 47–60. https://doi.org/10.1007/s10708-014-9524-3
Lieske, S. N., van den Nouwelant, R., Han, J. H., & Pettit, C. (2019). A novel hedonic price modelling approach for estimating the impact of transportation infrastructure on property prices. Urban
Stud-ies, 11, 1–21. https://doi.org/10.1177/0042098019879382
McCann, P. (2012). The role of industrial clustering and increasing returns to scale in economic develop-ment and urban growth. In N. Brooks, K. Donaghy, & G.-J. Knaap (Eds.), The Oxford handbook of
urban economics and planning. Oxford, England: Oxford University Press. https://doi.org/10.1093/
oxfordhb/9780195380620.013.0009
Meijers, E. J., Burger, M. J., & Hoogerbrugge, M. M. (2015). Borrowing size in networks of cities: City size, network connectivity and metropolitan functions in Europe. Papers in Regional Science, 95(1), 181–198. https://doi.org/10.1111/pirs.12181
Melo, P. C., Graham, D. J., & Noland, R. B. (2009). Regional science and urban economics: A me-ta-analysis of estimates of urban agglomeration economies. Regional Science and Urban Economics,
39(3), 332–342. https://doi.org/10.1016/j.regsciurbeco.2008.12.002
Mohammad, S. I., Graham, D. J., Melo, P. C., & Anderson, R. J. (2013). A meta-analysis of the impact of rail projects on land and property values. Transportation Research Part A, 50, 158–170. https://doi. org/10.1016/j.tra.2013.01.013
Nelson, J. P. (2004). Meta-analysis of airport noise and hedonic property values: Problems and pros-pects meta-analysis of airport noise and hedonic property values problems and prospros-pects. Journal of
Transport Economics and Policy, 38(1), 1–28. Retrieved from http://www.jstor.org/stable/20173043
Nguyen-Hoang, P., & Yinger, J. (2011). The capitalization of school quality into house values: A review.
Journal of Housing Economics, 20(1), 30–48. https://doi.org/10.1016/j.jhe.2011.02.001
Osland, L. (2010). An application of spatial econometrics in relation to hedonic house price modeling.
The Journal of Real Estate Research, 32(3), 289–320.
Osland, L., & Thorsen, I. (2008). Effects on housing prices of urban attraction and labor-market acces-sibility. Environment and Planning A, 40(10), 2490–2509. https://doi.org/10.1068/a39305
Rosen, S. (1974). Hedonic prices and implicit markets: Product differentiation in pure competition. Journal of Political Economy, 82(1), 34–55. Retrieved from http://www.jstor.org/stable/1830899 Straatemeier, T. (2008). How to plan for regional accessibility? Transport Policy, 15(2), 127–137. https://
doi.org/10.1016/J.TRANPOL.2007.10.002
To, W. M. (2015). Centrality of an urban rail system. Urban Rail Transit, 1(4), 249–256. https://doi. org/10.1007/s40864-016-0031-3
van Meeteren, M., Neal, Z., & Berudder, B. (2015). Disentangling agglomeration and network exter-nalities: A conceptual typology. Papers in Regional Science, 95(1). https://doi.org/10.1111/pirs.12214 Xiao, Y., Orford, S., & Webster, C. J. (2016). Urban configuration, accessibility, and property prices:
A case study of Cardiff, Wales. Environment and Planning B: Planning and Design, 43(1), 108–129. https://doi.org/10.1177/0265813515600120