Nr 190 o 1993
Soil Acidification and Element Fluxes of a Fagus
ylvatica Forest as Influenced by Simulated
Nitrogen Deposition
Bo Bergkvist, Department of Plant Ecology, University of Lund, Lund
Lennart Folkeson, Swedish Road and Traffic Research Institute (VTI),
Linköping
VTI särtryck
Nr 190 - 1993
Soil Acidification and Element Fluxes of a Fagus
sylvatica Forest as Influenced by Simulated
Nitrogen Deposition
Bo Bergkvist, Department of Plant Ecology, University of Lund, Lund
Lennart Folkeson, Swedish Road and Traffic Research Institute (VTI),
Linköping
Reprint fram Water, Air, and Soil Pollution 65, 1992, pp. 111- 133
&»
Vä
-acllhaf/'I!-'Insgitutet
SYLVATICA FOREST AS INFLUENCED BY SIMULATED NITROGEN DEPOSITION
BO BERGKVIST and LENNART FOLKESON
Department of Plant Ecology, University of Lund, 0" Vallgatan 14, S 223 61 Lund, Sweden
(Received July 6, 1991; revised November 8, 1991)
Abstract. The in uence of simulated 3- and 9-fold increases in the current N deposition on element
uxes and soil acidi cation was investigated in a beech forest in S Sweden. Treatments, in three replicates,
were 66 and 198 kg N ha"1 yr"1 as NH4NO3 during 5.5 yr. All the supplied N could not be accounted for by leaching or soil accumulation, and possible pathways are discussed. Leaching of NO; increased greatly upon treatment. Nitri cation, also occurring in the control soil, was considerably enhanced by the low-N but not by the high N treatment. Leaching of NO; (added or resulting from nitri cation) had a strongly acidifying in uence. Soil solution (cup lysimeters at 30 cm depth) pH was 4.51, 4.07 and 3.81 in the control, low- and high-N plots, respectively. The buffering of protons shifted from the base-cation to the Al buffer range. The base cation/Al ratio (equivalents) of cation mobilization was 2.7 in the control, 1.1 in low N and 0.15 in high N plots. Also Mn and Rb uxes were drastically increased. The C:N ratio of beech litterfall decreased with increasing N supply but uxes of elements in litterfall and in throughfall were not in uenced. The bulk deposition of N was 18 kg ha 1 yr l. A moderate further increase in the N deposition to this N saturated forest would considerably increase NO; leaching and soil acidity and cause depletion of base cations and mobilization of Al and Mn.
1. Introduction
Nitrogen has long been considered the nutrient limiting the primary productivity of forests. During the last decades the situation has changed, and atmospheric N deposition now contributes N in quantities well above the demand of forests in much of Europe. Many forest soils are approaching a state of N saturation in which biomass productivity does not respond to increased N supply (Nihlgård,
1985). The current load to SW Sweden, 15 to 20 kg N ha 1 yr'l, is in the upper part of the range of the proposed critical load of N (Nilsson and Grennfelt, 1988). In most forest types, there is little tendency for inorganic N to accumulate in the soil. The NO; anion is only weakly adsorbed on soil surfaces and is thus readily leached if not taken up by roots. The NH4+ ion can be retained on cation exchange sites. However, quantities of exchangeable NH,,+ on exchange sites in forest soils are usually insigni cant due to the high biological demand and to nitri cation of NH,,+ not incorporated into biological tissue. The balance between N supply and biological N demand generally controls leaching of NO; and cations (see e.g. Tamm, 1991).
An increase in the NHJ N supply to a forest may promote nitri cation which is a strongly acidifying process. Soil acidi cation potentially changes element uxes not only in the soil but also in the entire ecosystem, including root uptake, throughfall
Water, Air, and Soil Pollution 65: 111 133, 1992.
and litterfall (Reuss and Johnson, 1986; Parker, 1990; Tamm, 1991).
Effects of N additions have been much studied in coniferous forests (see e.g. Tamm, 1991) but little is known about effects on beech forest ecosystems. The aim of the present study was to quantify the in uence of simulated 3- and 9 fold increases in the current N deposition on (1) element uxes and soil acidi cation and (2) the fate of N in a beech-forest ecosystem in S Sweden. Granulated NH4NO3 was repeatedly supplied during 5.5 yr, and chemical changes in throughfall, litterfall, soil solution and soil were studied during the last experimental year. The study forms part of an integrated experiment where also effects on leaf chemistry, tree growth, performance and nutrient dynamics, vegetation changes and macrofungal fruitbody production were studied (Tyler et al., 1992).
2. Site Description and Experimental Design
The experimental site is situated in a Fagus sylvatz'ca forest, Maglehems Ora (55 O35,N, 14 o07 E) in eastern Skåne, southernmost Sweden, 4 km from the Baltic Sea. The elevation of this level site is 76 to 78 m a s 1 which is well above the highest coast line. The bed-rock is a fine-grained gneiss which is covered by a delta deposit of glacio uvial sand, only slightly mixed with moraine. The texture is mainly fine sand (0.06 to 0.6 mm) with a low clay (<10%) and a low boulder content. The site is very well drained and the soil profile is a light Dystric Cambisol, transitional to a Cambic Arenosol with less distinct horizons. The humus type is a weakly aggregated sandy mull, at sites slightly transitional to moder. The soil has a
pH-TABLE I
The pH (0.2 M KCl) of the soils before the experiment (August 1985) and after nearly 5 yr (March/April 1990). Sieved (2 mm mesh) fresh soil. Meanisd. n:6 (two samples from each plot). Low N and High N:66 and 198 kg N ha"1 yr l, respectively. Neither in 1985, nor in 1990 did pH differ significantly between control, low N and high N in any of the horizons (Tukey test; p level 0.05). Significance of the difference between years (in the same treatment and soil horizon): a p<0.05, b p<0.01, C p<0.001 (Student s t test). Data provided
by B. Nihlgård (pers. comm.)
1985 1990
A horizon Control 3.56"_|-0.11 3.66i0.07
Low N 3.61i0.13 3.59i0.13
High N 3.56i0.10 3.59i0.12
AB horizon Control 3.ooJ_ro.04 3.54i0.07b
Low N 3.68i0.05 3.45o_Lo.12b
High N 3.70i0.04 3.44iO.IOC
B horizon Control 3.87i0.04 3.80i 0.04b
Low N 3.84i0.03 3.78i0.06a
TABLE II
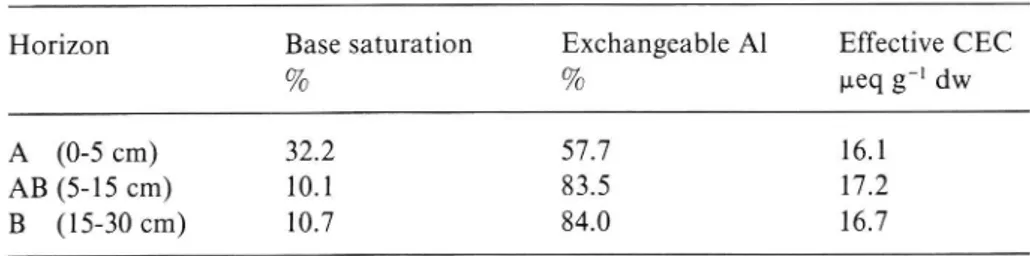
Base (Ca, Mg, K, Na) saturation, exchangeable Al percentage and effective cation exchange capacity in different horizons of the soil before the start of the experiment.
Data provided by B. Nihlgård (pers. comm.)
Horizon Base saturation Exchangeable Al Effective CEC
% % ueq g"1 dw
A (0-5 cm) 32.2 57.7 16.1
AB (5 15 cm) 10.1 83.5 17.2
B (15 30 cm) 10.7 84.0 16.7
KC1 of 3.6 in the A horizon and 3.8 in the B horizon (Table I). The percentage base saturation and percentage exchangeable A1 are given in Table II.
The area has mainly been forested for centuries. The present beech stand is even aged, established after an ample mast production in 1869. No thinning has occurred since 1980 and the canopy is closed. The number of trees (exclusively beech) is ca 200 ha , the basal area ca 30 m2 ha 1 and the mean tree height 32 m. The shrub layer is sparse. The eld layer, not fully closed, is dominated by Oxalis acelosella, Anemone nemorosa and Cardamine bulbifera with some Viola riviniana,
V. reichenbachiana, Rubus idaeus and a few other species.
The climate is temperate, suboceanic and subhumid. The mean temperature of July (warmest month) is 17 oC and that of February (coldest) 1 OC. The years 1985 1987, especially the winters, were colder than average whereas there were positive temperature anomalies in 1989 1990, e.g. +5.5 oC in February 1990. Except for the dry year 1989, the annual precipitation during the 6 yr of experiment was close to or slightly above the long time (1961 1989) average, 602 mm. Usually, the precipitation is fairly evenly distributed over the year though somewhat lower during the spring months. These data are from the meteorological station at Vitemölla, 7 km away, where the precipitation November 1989 October 1990 was 555 mm which is less than was measured at the experiment site.
In the 1.3 ha experimental area, nine 25 X 25 m plots with 5 m buffer strips in between were laid out in 1985. Controls and two levels of N treatment were randomized in triplicates. The treatment plots were supplied with granulated (1 to 3 mm diam.) kalkammonsalpeter , made up of NH4NO3 with CaCO3 and MgCO3 additions. The granulate, containing 27.7% N (13.9% NH4-N and 13.8% NO3-N), 4% CaCO3, 2% MgCO3 and traces of other elements, see Table IV) was distributed by hand on one occasion each month from May to September during 1986 through 1990. The supply amounted to 66 and 198 kg N ha 1 yr 1 in the low- and high-N treatments, respectively. Prior to this, 16 and 48 kg N ha 1 yr 1 (divided on two occasions) were supplied to the low and high-N plots, respectively, in the autumn of 1985. The annual supply during 1986 1990 corresponded to about 3 and 9 times the atmospheric wet deposition of N to the stand.
3. Materials and Methods
Bulk deposition was collected in four samplers (shaded polyethylene, PE, funnels, diam. 20 cm, with PE sieves, connected to 10 L PE bottles) placed 2 m above ground in a clear cut area 700 m from the plots. In each plot, throughfall was collected in ve shaded samplers (funnels as above, 5-L bottles) placed c. 0.5 m above ground and randomly distributed in the area >7.5 m away from the plot border to avoid border effects and > 1.5 m away from trunks to diminish the in uence from stem ow water coming loose from the trunks, some of which where slightly inclined. Litterfall was also collected in these funnels.
Bulk deposition and throughfall were weighed in the eld. Bulk deposition waters were treated as single samples but the ve throughfall samples were pooled together. A 1.3-L subsample was brought to the laboratory. The litter from the ve funnels was also pooled together.
Soil solution was collected with ceramic cup lysimeters (P80, vacuum 60 to 80 kPa). In a regular pattern in each of the nine forest plots, four lysimeters were installed at 30 cm soil depth (upper part of the B horizon) >5 m away from the plot border. Collecting bottles (Duran glass) were placed in a frigolite-covered PVC container below ground to keep samples dark and cool. To allow lysimeters to equilibrate with the soil solution, the rst few lysimeter solutions, obtained within 2 mo of installation, were discarded.
After this equilibration time, soil solution was sampled continuously from 12 July, 1989 to 9 November, 1990. Bulk deposition, throughfall and litterfall were sampled continuously from 8 November, 1989 to 9 November, 1990. Sampling period duration was 12 to 39 days during the vegetation seasons and 40 to 46 days during the defoliated season.
Soil samples were taken in August 1985, before the experiment, and in March/ April 1990 from the A (0 to 5 cm), AB (5 to 15 cm) and B (15 to 30 cm) horizons. From each horizon, two bulk samples were attained, each consisting of fteen subsamples taken out with a thin soil auger along either of the two diagonals.
The aqueous samples were stored at 20 CC. After thawing, throughfall samples were ltered (paper OOR, Munktell STORA) whereas bulk precipitation and soil leachate were not. Subsamples were taken out for analysis of NHJ, NO3 , 802", Cl" and dissolved organic carbon (DOC). Subsamples (700 to 1000 mL) for metal analysis were transferred to a 1-L Erlenmeyer ask which was sealed with a hood of lter paper and evaporated at 105 OC. The residue was treated with 10 mL conc. HNO3 (anal. gr.) to destruct organic matter and redissolve the metals. The volume was reduced by evaporation to c. 2mL and diluted with deionized water to 25 mL prior to analysis.
The litterfall samples, stored in paper bags at 20 OC, were dried at c. 40 OC, separated into leaf litter and other litter and weighed. Samples from November 1989 to November 1990 were bulked together. Leaf-litter subsamples (2.5 g) were digested in 30 mL conc. HNO3. The samples were evaporated, ltered and diluted.
The soil samples were dried at 85 oC for > 24 hr and sieved (mesh 2 mm). Extracts for NHJ and NO3 analyses were obtained using 0.2 M KCl. Extracts for analyses of Na, K, Ca and Mg were obtained using IM ammonium acetate (pH 7.0). Extracts for analyses of exchangeable acidity and exchangeable Al were obtained using
IM KCI.
The following analytical methods were used for aqueous and/or litter samples: pH was determined electrometrically. NH4+ was determined colorimetrically (flow injection analysis, FIA); NO3', SO? and C1" by ion chromatography; Rb (with 2000 ppm K in solutions) by flame emission; Cd by AAS; S (litter only), P, Al, Ca, Cu, K, Mg, Mn, Na and Zn by inductively coupled plasma spectrometry. DOC in aqueous samples was analyzed by infrared technique (C analyzer). In litter samples, C was analyzed using infrared technique and total N by Kjeldahl analysis. Soil 0.2 M KCl extracts were analysed for NH4+ and NO; using FIA. On soil IM KCl extracts exchangeable acidity was determined titrimetrically with NaOH after addition of fenolftaleine as an indicator, and exchangeable Al was thereafter determined titrimetricaly with HCl on the same sample after addition of NaF.
Element uxes for the l-yr period from 8 November, 1989 to 9 November, 1990
were calculated as follows: For bulk precipitation and throughfall, the element uxes (concentration times water volume) were calculated for each of the eleven sampling occasions. The element uxes in litterfall were calculated by multiplying the concentrations in the leaf litter fraction by the dry weight of the pooled l-yr total litterfall. The soil-solution uxes were calculated for each of the nine sampling occasions using measured lysimetric soil-solution concentrations and calculated soil water uxes, assuming the ux of Cl in throughfall being equal to the ux of Cl in the soil solution of the control plots (Mulder et al., I989b).
One year element uxes were calculated by adding up the uxes for all sampling occasions. For some elements, uxes in bulk deposition, throughfall and soil solution were calculated for the winter half year (8 November, 1989 27 April 1990; defoliated period) and the summer half year (27 April 9 November, 1990; foliated period) separately.
The measured water volumes for the l yr period was 852 L m 2 for bulk deposition and 571 L m 2 for throughfall (average of the control and the two treatments).
The volume of soil leachate, as calculated using the Cl ux, was 317 L m 2 as
an average.
4. Results 4.1. CHEMISTRY OF THROUGHFALL AND SOIL SOLUTION
The tree canopy has a strong in uence on the chemistry of the precipitation. The bulk deposition pH was 4.47 (annual arithmetic mean) whereas the throughfall pH was 5.9 to 6.0 (Table III). Throughfall pH was c. 1.5 units higher during the foliated period (mean value 6.5) than during the defoliated period (mean 5.0). Upon passage of the canopy, the precipitation was enriched in NH4+, N03", SO , P,
T A B L E II I Mean p H an d el em en t co nc en tr at io ns (m g L ) in bu lk de po si ti on , th ro ug hf al l an d so ilso lu ti on fr om th e up pe r B ho ri zo n. Th re e re pl ic at es . El ev en sa mp li ng oc ca si on s (8 No ve mb er 19 89 -9 No ve mb er 19 90 ). DO Cz di ss ol ve d or ga ni c ca rbon . n. a. :n ot an al yz ed . Me an s la ck in g co mm on le tt er s di ff er si gn i ca nt ly (p <0 .0 5) be tw ee n tr ea tm en ts (T uk ey te st ). n: 44 fo r bu lk de po si ti on , 33 fo r th ro ug hfal l an d 55 -8 7 fo r so il so lu ti on
pH
DO
C
NH
z-N
No
;-N
so
ar
s
P
C1
A1
Ca
Cd
Cu
K
Mg
Mn
Na
Rb
Zn
Bu lk de po si ti on 4. 47 n. a. 1. 41 1. 07 1. 52 0. 05 4 4. 31 0. 04 0. 48 0. 00 01 4 0. 00 44 6 0. 44 0. 21 0. 01 2. 00 0. 01 8 0. 01 8 Th ro ug hf all Co nt ro l L o w N Hi gh N So il so lu ti on Co nt ro l L o w N Hi gh N 5. 90 a 5. 98 a 5. 94 a 4. 51 a 4. 07 b 3. 81 0 9. 90 a 10 .3 & 10 .3 & 12 .2 0 18 .1 b 24 .3 a 2. 08 3l 2. 15 a 2. 10 a 0. 69 b 1. 94 b 3. 76 3 1. 57 a 1.46 a 1. 68a 2. 86 C 29 .0 b 56 .3& 2. 55 & 2. 33 a 2. 72 a 5. 77 & 4. 93 21 5. 43 & 0. 65 1a 0. 42 9a 0. 46 1a n. a. n. a. n. a. 9. 24 El 7. 85 a 10 .0 a 17 .1 a 15 .6a 19 .7 a 0. 04 a 0. 04 a 0. 04 a 1. 22 6 7. 52 b 17 .9 a 2. 24 a 2. 06 a 2. 30 a 6. 92 C 21 .6 b 28 .4 a 0. 00 01 2a 0. 00 01 1a 0. 00 01 2a00
01
02
0
0.
00
32
4b
0.
00
57
1a
0. 00 49 3a 0. 00 52 9a 0. 00 52 3a 0. 00 06 9a 0. 00 08 1a 0. 00 08 7a 4. 42 a 4. 10 a 4. 34 a 0. 56 a 3. 55 b 4. 17 b 0. 92 a 0. 84 a 0. 97 a 1. 300 4. 48 b 8. 01 a 0. 35 a 0. 23 a 0. 35 a 0. 41 0 4. 61 b 9. 74 a 3. 77 a 3. 18 a 3. 97 a 6. 44 a 7. 72 a 7. 72 a 0. 04 8a 0. 01 8a 0. 05 22 1 0. 00 20 0. 01 3b 0. 02 6a 0. 01 5a 0. 01 3a 0. 01 6a 0. 07 4C 0. 27 3b 0. 42 8aCl , Ca, Mg, Na, Rb and especially K and Mn whereas the concentrations of Al, Cd, Cu and Zn were lower or unaltered in the throughfall compared with the bulk precipitation. None of the elements showed any signi cant difference in mean throughfall concentrations between the treatments low N, high N and control.
Contrary to the throughfall, the soil solution responded very clearly to the treatments. The overall response was a strong acidi cation. The mean pH was 0.4 and 0.7 units lower in the soil solution of the low- and high- N plots, respectively, than in the control which had a mean pH of 4.51.
In the low-N soil solution, the mean NHJ concentration was not statistically
different from the control but the N03 concentration was increased ten times.
In the high-N soil solution, the NH4+ concentration was c. five times and NO3 c. 20 times the control. Increasing NH4NO3 load gave rise to increased leaching of Al, Ca, Cd, K, Mg, Mn, Rb, and Zn. Compared with the control, the concentrations in the high-N soil solutions were increased 4 to 13 times for most elements, 15 times for Al and even 24 times for Mn. Only for Ca, K and Mg can part of this increase be attributed to contribution from the fertilizer.
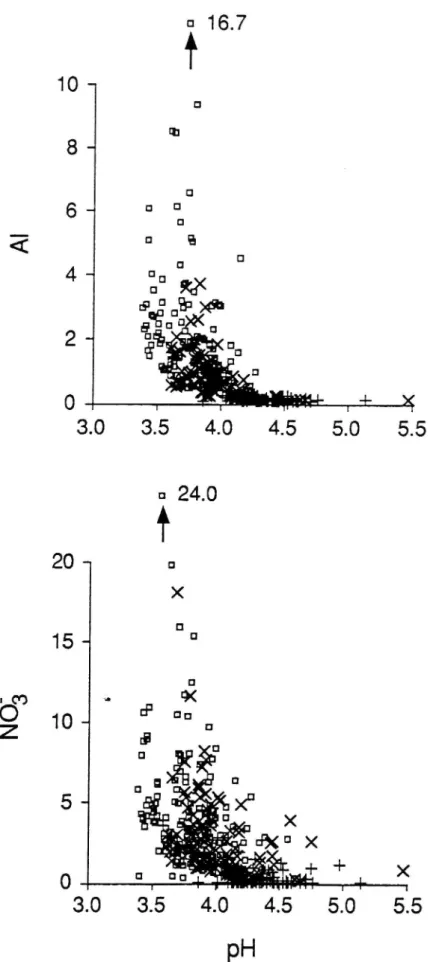
In the treated plots, the Al concentration in the soil solution from the upper B horizon (30 cm) was very high, up to 17 meq L 1 (150 mg L ) in the high-N treatment (Figure 1). The pH, the NO," concentration and the total Al concentration of the soil solution were closely related. There was a dramatic decrease in soil-solution pH with increasing NO3 concentration. Likewise, there was a concomitant increase in the Al solubilization with a decrease in pH. A treatment effect is clearly displayed in the plots; H+, Al and NO, concentrations increasing in the order control < low-N < high-N.
Interestingly, also the organic matter solubilization seems to have been enhanced by the treatment, as shown by signi cantly increased DOC concentrations (Table III). The concentrations of SO? and Cl were not altered by the treatments. These anions are only weakly adsorbed by this Dystric Cambisol (Table IV), and the treatments did not seem to change the adsorption capacity, as the Fe- and Al oxide content in the B horizon normally is low in this type of soil.
4.2. FLUXEs AND SOIL BUDGETS
Bulk deposition of N was rather high, 1.8 g N m 2 yr 1 (Table IV). The N uxes in bulk deposition and throughfall were rather similar. The annual uxes of elements (including N) in throughfall were not obviously in uenced by the treatments. Neither were the element uxes in litterfall, even though the litterfall C/N ratio decreased with increasing N treatment: 43.5, 40.0 and 37.6 in the control, low N and high N plots, respectively (difference between control and high-N signi cant at p <0.05, Tukey test).
In the soil solution, however, the low-N and, even more, the high-N treatment considerably increased the uxes not only of NH4+ and NO3 but also of DOC, SOZ , Al, Ca, Cd, Cu, K, Mg, Mn, Rb, and Zn.
0 16.7
10
D lh 8-D6
av
DAI
20-
u
15-
°
3
10-N
O
Fig. 1. pH and concentrations of NO; and Al (meq L l) in the soil solutions. Fifteen sampling occasions from 12 July 1989 to 9 November 1990. +: control; crosses: low-N; quadrats: high-N treatment.
T A B L E IV Fl ux es an d ca lc ul at ed so il bu dg et of el em en ts (m g m 2yr ). Th re e re pl ic at es . So il wa te r uX es es ti ma te d as su mi ng C1 in pu t eq ua l to Cl ou tp ut . Ni tr og en in li tt erfa ll an d bi om as s in cr em en t (a bo ve gr ou nd bi om as s in co rp or at io n) co ns id ered as NH J-N. In aq ue ou s ux es , S is in th e fo rm of SO § -S . Bi om as s in crem en t: av erag e of tw o ol d be ec h st an ds on Po dz ol so il in No rt h-Ce nt ra l Sk ån e (B er gk vi st , Fo lk es on an d Ol ss on , in pr ep.) ; S an d P: va lu es fr om Ni hl ga rd (1 97 2) . n. a. : no t an al yz ed D O C N H I N NO g-N To t N S P Al Ca Cd Cu K M g M n Na Rb Zn Bu lk de po si ti on (B D) n. a. 99 0 78 3 17 70 12 30 29 28 33 2 0. 11 4 3. 66 41 5 23 7 8 26 00 7. 74 14 .0 0 Th ro ug hf al l (T F) Co nt ro l 41 10 99 8 71 6 17 10 12 70 21 1 20 90 9 0. 07 1 2. 19 16 50 43 4 11 1 23 00 12 .8 7. 53 iS t de v 32 1 23 5 12 24 7 9 49 0. 2 63 0. 00 4 0. 36 19 4 6 25 90 1. 46 0. 29 Lo w N 41 40 10 40 69 9 17 40 11 70 15 4 19 81 6 0. 06 0 2. 29 14 60 39 0 88 19 60 11 .2 6. 69 iS t de v 38 2 76 31 10 7 54 27 2 46 0. 00 8 0. 34 12 3 43 13 288 2. 85 0. 54 Hi gh N 40 80 95 3 75 1 17 00 12 40 16 5 20 90 5 0. 06 5 2. 43 15 80 44 3 11 3 22 80 12 .5 8. 21 iS t de v 34 8 11 6 63 17 9 35 28 1 35 0. 00 6 0. 44 10 1 1 7 82 0. 48 1. 27 Li tt er fa ll (L F) Co nt ro l 49 60 49 60 49 3 51 0 37 46 60 0. 05 1 2. 01 13 10 46 8 88 7 15 7 5. 10 13 .5 iS t de v 50 5 50 5 38 10 2 35 8 0. 00 7 0. 04 85 62 55 10 0. 72 1. 23 Lo w N 52 50 52 50 50 4 41 8 36 45 80 0. 05 4 1. 71 13 30 49 7 77 5 15 3 5. 15 12 .9 iS t de v 63 3 63 3 41 19 0. 5 33 2 0. 01 1 0. 25 20 9 28 78 9 1. 24 1. 28 Hi gh N 57 50 57 50 50 9 42 8 36 43 10 0. 04 8 1. 78 12 90 50 2 75 8 14 4 5. 33 12 .1 iS tde v 44 1 44 1 29 30 3 20 7 0. 01 3 0. 21 59 46 41 11 0. 59 1. 34 Fe rt il iz er ad di ti on (F A) Co nt ro l 0 0 0 0 0 0 0 0 0 O 0 0 0 0 0 Lo w N 33 10 32 90 66 00 14 25 12 10 20 0. 00 4 0. 00 3 65 48 9 17 0. 00 0. 13 Hi gh N 99 40 98 60 19 80 0 41 74 35 30 60 0. 01 2 0. 00 8 19 6 14 70 9 50 0. 00 0. 40 m Bi om as s in cr em en t (B I) 15 00 15 00 25 0 n. a. 4 53 3 0. 01 1 1. 20 66 0 10 8 92 17 4. 00 3. 23
Ta bl e IV (C on ti nu ed ) D O C N H J -N
No
;-N
To t-N Al Ca Cd C u Mg Rb Zn So il so lu ti on (S S) Cont ro l 37 80 iS t de v 97 3 Lo w N 65 80 :t St de V 17 70 Hi gh N 84 40 :t St de v 33 30 So il bu dg et (B D+ FA Bl SS ) Co nt ro l L o w N Hi gh N 12 2 82 39 8 13 8 79 3 42 6 63 2 24 00 86 40 13 80 12 60 68 30 3410 1070 0 39 90 597 27 60 15 00 13 40 72 30 3550 1150 0 44 20 12 30 360 85 70 17 60 213 20 20 528 21 00 11 50 780 10 30 10 80 38 3 93 16 10 13 50 32 80 402 358 15 70 32 20 2870 1540 5110 2440 8052 1070 3070 4290 2420 0. 36 8 0. 07 5 0. 91 5 0. 47 0 1. 15 0. 20 4 O. 26 6 0. 80 8 1. 040.
19
0.
04
0.
22
0.1
5
0.2
8
0.0
7
2. 28 2. 25 2. 19 20 8 12 3 66 6 56 8 86 3 33 3 45 4 84 6 9 12 50 8 21 0 97 7 26 7 16 00 119 379 359 1 17 1 10 6 97 8 50 5 18 30 394 255 1060 1900 17 90 511 19 80 304 17 30 482 793 620 904 0. 67 0. 24 2. 68 2. 32 5. 32 0. 69 3. 07 1. 06 1. 58 28 .2 9.49 64 .6 34 .9 76 .9 37 .6 17 .4 53 .7 65 .8throughfall (TF), litterfall (LF) and fertilizer addition (FA) minus the output terms root uptake (RU) and leaching with soil solution (SS). Only part of the RU will end up in the above ground biomass (biomass incorporation, BI), the remainder being internally circulated (internal circulation, IC) as TF and LF minus bulk deposition (BD). Since thus RU=BI+IC and IC=TF+LF BD, the soil budget TF+LF+FA RU SS can be reduced to BD+FA BI SS (Figure 2).
Both wet and dry deposition should be included in the input term since dry deposition can contribute substantial amounts of e.g. N to a forest (Lovett and Lindberg, 1986). Dry deposition of N and S is known to be of much less importance to deciduous than to coniferous forests, however (see Wiman et al., 1990). The fact that there was no difference between bulk-deposition uxes and throughfall uxes of NHJ, NO3 and SO4 indicates dry deposition to be negligible to the stand under study. Such a comparison does not consider the presence of foliar uptake of e.g. N, however (Schaefer and Reiners, 1990). For the other elements studied here, dry deposition is known to be of minor importance. Though possibly somewhat underestimating the input of some elements, the use of bulk deposition as input to the ecosystem can be justified from what is referred above.
In a beech forest, stem ow is of course an important pathway to the soil for many elements. Results from five beech forest localities in Skåne during 3 yr, show that the stem ow contribution to the total amount reaching the ground (as throughfall+stem ow) is c. S% for each of NH4+ and NO, . For Al, Ca, Cd, Mg, and Zn the corresponding percentage is c. lO%, and for SOf , K, Mn and Na c. 15% (Bergkvist, Folkeson and Olsson, in prep.). Stemflow, creating steep ux gradients near trunks (Falkengren Grerup, 1989), is thus important for the element transport to the ground. These gradients were beyond the aim of the present study, however. Further, stem ow cannot possibly in uence the ground beyond l rn from the trunks, especially not in this sandy soil where lateral water flux can be considered negligible. Inclusion of the area close to trunks would have led to an overestimation of element uxes to the ground on a stand-area basis. Being based on lysimeters placed well away from trunks, our uxes should thus be valid for the stand as a whole with the exception of the area within 1 m of the trunks, which was calculated to constitute less than 6% of the stand area.
In the control plots, the calculated soil budget was negative (decreasing stores) for all elements except for Cu, Na and Rb ( Table IV). With increasing fertilizer load, the budget became increasingly negative for S and the acidity-sensitive metals Al, Cd, K, Mn, and Zn. The budget of Mg became less negative due to the Mg addition in the treatment. Also Ca was added in amounts high enough to keep pace with the increased leaching in the treatment plots. The Rb budget turned negative in the high-N plots. Copper and Na were not affected by the treatments and showed positive budgets in both control and treatment soils.
Of the N reaching the soil as throughfall, 88% was leached from the rooting zone (30 cm soil depth) in the control plots. The amount of NO3 leaching with the soil solution was 190% of the amount deposited with throughfall but the
Co
nt
ro
l
Lo
w
-N
Hi
gh
-N
BD 8TF
111FA
A
92
q
92
A
92
LF
887
88
775
1,3
758
99 8 86 3 _ 87 1 / / Re le as e RU 94 7 \ 10 80 ) x ) l ; ln m O)v1
71
V
97
8
K
/
18
30
Fi g. 2. An nu al ux of M n in th e co nt ro l, lo w-N and hi gh N pl ot s. m g m" 2 yr l. BDzb ul k de po si ti on , TF =t hr ou gh fa ll , LF =l it te rf a1L FA zf er ti li ze r ad di ti on , BI =inc or po ra ti on in to ab ov e gr ound bi om as s, IC zi nt er na l ci rc ul at io n ( = T F +LF B D ) , RU =r oo t up ta ke (= BI+I C) , SS :s oi l so lu ti on . B D , TF ,LF , F A an d SS me as ur ed va lu es , BI fr om a pa ra ll el st ud y, ot he rs ca lc ul at ed . BD +F A Bl SS gi ve s th e M n re le as e fr om th e 0-30 so il co mp ar tm en t. Se efu rt he r Ta bl e IV .corresponding value for NH4+ was only 12%, which indicates nitri cation to be important also in the untreated beech-forest soil which is rather acidic.
In the control plots, both NH4+ and NO3 had negative soil budgets. In the low-N plots, the soil budget of (total inorganic) N was slightly negative. Interestingly, however, the greater part of NH; added with the fertilizer was efficiently trans-formed to NO, and leached out of the rooting zone the leaching of NO, increased five times, compared with the control. In the high-N plots, the NO; leaching was enhanced eight times compared with the control. Most of this originated from the NO; added with the treatment, however. All the mineral N supplied was not leached, however, and more than one-third of the added amount seemed to be retained within the system or lost by other pathways, and the N budget appeared to be greatly positive.
The transport of NH4+ through the soil pro le was about equal in size during the winter (trees defoliated) and summer (foliated) half years (Table V). In the control plots, the leaching of NO; was much higher during the defoliated than the foliated period whereas this difference was small in the treated plots. The bulk deposition of N to the canopy was fairly similar during the defoliated and the foliated period but the fertilizer was distributed (on five occasions) only during the foliated period. The soil-solution pH was lowest and the Al leaching highest during periods with the highest NO, leaching, i.e. the defoliated period in the control (and low-N) plots but the foliated period in the high-N plots. The increase in the leaching of DOC in the N-treated plots indicates an enhanced mineralisation of soil-organic matter with increasing N load. However, also the added CaCO3
TABLE V
Mean pH and uxes of dissolved organic C (DOC), NHJ N, NOj-N and Al in the soil solutions during the period 8 November 1989-27 April 1990 ( defoliated period ), four sampling occasions, and 27 April-9 November 1990 ( foliated period ), seven sampling occasions. Three replicates. mg rn'2 yr 1
pH DOC NHJ-N NOf N Al Defoliated period Control 4.24 2630 51 1220 286 iSt dev 749 26 1140 70 Low N 4.02 5130 154 4020 840 iSt dev 1590 149 1910 609 High N 3.99 6330 384 4930 1140 iSt dev 2380 462 2780 304 Foliated period Control 4.61 1150 71 158 97 iSt dev 291 56 116 25 Low N 4.09 1450 244 2810 772 iSt dev 276 141 1520 744 High N 3.75 2110 410 5730 2130 iSt dev 969 39 1720 213
(4%) and MgCO3 (2%) could have some part in the increased solubilization of soil organic matter. The leaching of DOC was highest in the late autumn, especially in the high N treatment.
4..3 SOIL ACIDIFICATION AND BUFFERING
The annual H+ load to the soils caused by the acid production of the transport or transformation of H+, NHJ, NO3 and S04" was calculated according to Mulder et al. (1987). Also the alkalizing effect of the CaCO3 and MgCO3 added with the fertilizer, must be included in the calculations (expressed in equivalents):
H+ load = (Hin _ Hdut) + (NH4in _ NH4out) _ (No3in _ N03out) _
(so2- soz
4in _ 4out- (coz
3in _coz-
3out 'The subscripts in and out indicate input ux with bulk deposition+fertilizer addition and output ux from the rooting zone at 30 cm soil depth, respectively. For comparison, the mobilization of Al, base cations and Mn was calculated as well (expressed in equivalents):
Al mobilization = Alout Al-1n'
Base cation mobilization = (Naout Nam) + (K
+ (Mgout _ Mgin)'
Kin) + (caout _ Gain) out _
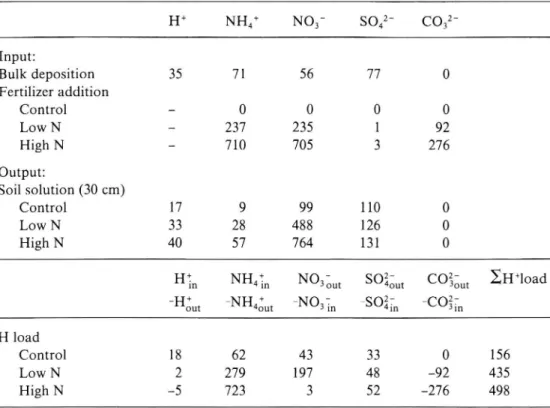
TABLE VI
Input and output uxes of H+, NHJ, N03 , 803," and COå j and the H+ load to the soil. meq m 2 yr l H+ NH4+ N03 S042 C032 Input: Bulk deposition 35 71 56 77 O Fertilizer addition Control 0 O 0 0 Low N 237 235 l 92 High N 710 705 3 276 Output: Soil solution (30 cm) Control 17 9 99 110 0 Low N 33 28 488 126 0 High N 40 57 764 131 0
Hg
Nm;n
N03;ut soggmt cog;ut ZH+1oad
_Hdut _NH4dut _NO3 in _SOåi'n _Coåi n H load
Control 18 62 43 33 0 156
Low N 2 279 197 48 92 435
Mn mobllizatlon = Mnout Mnin.
In the low-N and high-N plots, the soil acidi cation, regarded as the H+ load to the soil compartment 0 to 30 cm, was c. three times that of the control plots (Table VI). In the control plots, NH,;+ accumulation, nitri cation and N03 _ leaching together accounted for 67% of the total acid production. In the low-N plots, these processes correspondingly accounted for as much as 90% of the acid production, most of which was attributable to nitri cation. In the high-N plots, however, the greater part of the acid production could be ascribed to NH4+ accumulation or uptake, according to the calculations. Only a minor part of the supplied NH4+ could be recovered in the high-N soil after extraction, however (Table VII) and other pathways, e.g. denitri cation, are probably involved. The acidi cation attributable to SOå' leaching was of limited importance in both treatments.
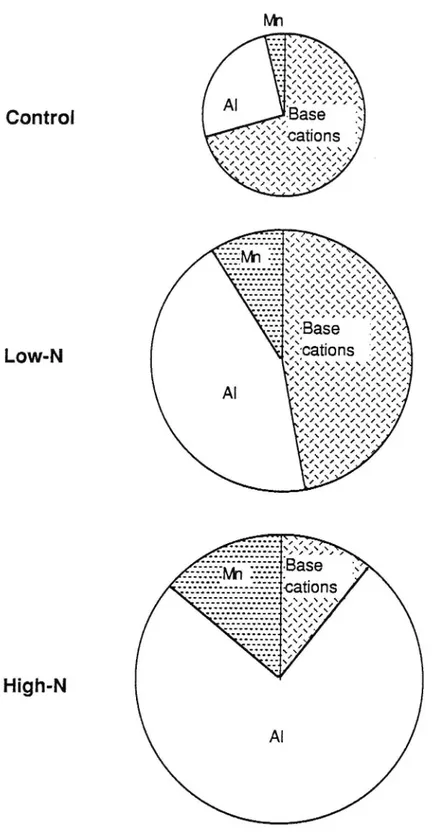
In the control plots, the main buffering mechanism was leaching of base cations but Al buffering was also of importance (Table VIII, Figure 3). The low-N treatment
TABLE VII
Soil stores (0-30 cm; mmol m z) of NH: and NO; Sampling in March/April 1990 after four years of N treatment
NH} NO; Einorganic N
Control 151 14 165
Low N 190 56 246
High N 219 59 278
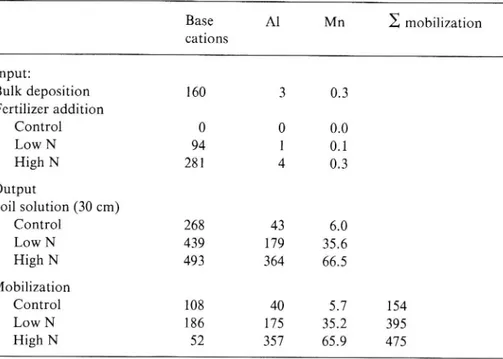
TABLE VIII
Input, output and mobilization of base cations (Ca, Mg, K, Na), Al3+ and Mn . Mobilization : output with soil solution minus input with bulk deposition and
fertilizer. meq m 2 yr 1 Base Al Mn 2 mobilization cations Input: Bulk deposition 160 3 0.3 Fertilizer addition Control 0 0 0.0 Low N 94 1 0.1 High N 281 4 0.3 Output Soil solution (30 cm) Control 268 43 6.0 Low N 439 179 35.6 High N 493 364 66.5 Mobilization Control 108 40 5.7 154 Low N 186 175 35.2 395 High N 52 357 65.9 475
Control
LOW'N iljlpations ., ,
Al III/Illi/Il/
High-N
Fig. 3. Base cation, Al and Mn mobilization in the soil (30 cm). Mobilization : output with soil solution minus input with bulk deposition and fertilizer. Base cations: Ca, Mg, K, Na. Circle area proportional
doubled the base-cation mobilization but the Al mobilization was four times that of the control and the Al buffering became as important as the base-cation buffering. The buffering action in the high-N plots was mainly by Al mobilization which was nine times that of the control plots.
The A1 proportion of the total cation mobilization increased from 26% in the control to 44% in the low-N plots and to 75% in the high-N plots where Mn buffering was as important as base cation buffering (Figure 3). Interestingly, Mn was the element with the most marked increase in mobilization; 12 times in the high-N plots compared with the control. In spite of this considerable mobilization in the soil due to acidi cation, the great internal Mn circulation in the ecosystem seemed to be unaffected by the fertilizer treatment (Figure 2). Manganese, like K, is characterized by a remarkably ef cient internal circulation in the forest ecosystem. Most of the Mn deposition to the ground was mediated by litterfall.
The pH-KCl of the soil tended to be slightly lower in the soils that had been N treated but the difference from the control was not statistically significant (Table I). In the AB horizon of both control and treatment plots, pH was lower in 1990 than in 1985. The exchangeable acidity and the concentration of exchangeable A1 were also determined (for 1985 and 1990) but no treatment effects were found.
After 5 yr of treatment, in the spring of 1990, the KCl-extractable soil store (0 to 30 cm) of inorganic N in the low- and high N plots was only 50 and 70%, respectively, higher than the control (Table VII). After these 5 yr, this excess N in the low- and high N soils corresponded to only 70 and 17%, respectively, of the 1-yr net addition of N (input with BD plus FA minus output with SS).
5. Discussion
The primary effect of the NH4NO3 treatment was a substantial increase in the leaching of NO; ions with the soil solution. This excess NOJ, emanating partly from the NO3 _ supplied with the fertilizer and partly from nitrification of the supplied NH4+, leaches through the soil which has a very limited capacity of NO; adsorption. If the percolating N03" stems from nitrification, it gives a considerable H+ contribution to the soil (see e.g. Reuss and Johnson, 1986). Nitri cation is a process giving rise to a H+ load which is twice that arising from NH4+ uptake (Gundersen and Rasmussen, 1990);
nitri cation: NH4+ + 202 = NO, + 2H+ + HZO
ammonium uptake: ROH + NH} ?> RNH2 + HZO + H+.
Nitri cation and leaching of the excess NO, were the main acid producing
mechanisms not only in the low N treated soil but also in the control soil. It is now well established that nitrification occurs also in acidic forest soils (Kriebitzsch, 1978; Lang, 1986; Gundersen and Rasmussen, 1990). According to the calculation of the H+ load, the soil acidification in the high N treated plots was mainly due
to NH4+ accumulation in the soil (or root uptake), however. In these plots, the efficiency of the nitrifiers seemed to be insufficient to keep pace with the great addition of NHJ, and the NO; production was lower than in the low N plots. This elevated NH4+ level may have had a toxic in uence on the nitri ers. Ecto mycorrhizal fungi have been shown to be intoxicated by very high NHf/K+ ratios in a laboratory study (Boxman et al., 1986). There are possibly alternative explanations of the low rate of nitri cation in the high-N plots.
Results from the soil extraction (KCl) indicate that far from all the N added with the fertilizer to the high-N plots could be accounted for by accumulation in the O to 30 cm soil or by leaching. This sandy soil, low in clay content, certainly has a limited ability to accumulate N (Zöttl, 1990). The merely moderate increase in the soil store of inorganic N found 5 yr after the onset of the treatment indicates a situation approaching steady state rather than a continuous N accumulation. Moreover, lower total N contents (Kjeldahl) in the A horizon (O to 10 cm) of the low- and especially the high-N soils than in the control were actually found at Maglehem by Tyler et al. (1992). Enhanced N uptake and/or nitrate leaching may possibly have occurred as a quick response during the first few years after the onset of treatment.
Part of the N not recovered may be explained by increased biomass uptake of N. The slight but statistically significant decrease in the C:N ratio of the beech leaf litter supports this probability (Tyler et al., 1992). In a parallel study at the same site, Balsberg Påhlsson (1992) likewise found the concentrations of both NO, and total N in the beech leaves to be somewhat higher in the treated plots than in the control. Nitrogen fertilization is often but not always reported to increase the N concentration in leaves (Huttl, 1990) and litter (Khanna and Ulrich, 1981). On the other hand, an enhanced N uptake into the tree biomass should promote tree growth but according to a stem-increment analysis after four years of treat-ment, tree growth was not in uenced by the treatment (Tyler et al., 1992). An increased N uptake in trees is also contradictory to the supposed N saturation of the ecosystem.
Compared with increased biomass uptake, denitrification could possibly form a quantitatively more important pathway for that amount of added N that was not recovered as leached through the soil or stored within it. Denitriflcation is known to be favoured by a high pH and shifts between aerobic and anaerobic conditions typical of sites with a fluctuating ground-water table (Haynes, 1986). Such conditions do not apply to the acidic and sandy soil of Maglehem. This does not exclude the presence of microhabitats suitable to denitrifiers, however (Tamm, 1991). Further denitrification is promoted by high concentrations of soil N03 , a condition certainly prevailing in the treated soil. Remaining one of the possible pathways for the excess N in the high N plots, denitri cation would merit expe-rimental investigation.
The difficulty in recovering all added N was not expected but the concordant results from all three replicates strengthen the observation.
The calculation of the H+ load of the soil presupposes that the NH4NO3 was quantitatively dissolved and incorporated into the soil. Soon after supply, no traces of NH4NO3 granules were visible on the ground. It cannot be excluded that part of the NH4NO3 N might have been lost through ammonia volatilization (Tamm, 1991). (A saturated aqueous solution of the NH4NO3 had a pH of 5.5.) Since pKais as high as 9.3, NH3 volatilization of the fertilizer supplied to this acidic soil is highly unlikely, however.
The most thorough going effect of the treatment was the intense acidi cation as revealed by the highly acidic soil solution. The acidi cation of the soil was not yet, after ve and a half years of treatment, strong enough to be discernible by an extraction analysis, however.
The decrease in the soil-solution pH and the great NO, leaching brought about base-cation depletion and increased Al release in the mineral soil. It is remarkable that the total cation mobilization increased four fold in the high-N treatment and that 75% of the this mobilization was Al. The possibility that the increase in Al leaching could be an artifact due to Al leaching from the lysimeter material can be ruled out according to tests by Rasmussen et al. (1986) as well as in our laboratory. The results clearly indicate that the NH4NO3 treatment had driven the Maglehem soil from the base cation buffer range into the Al buffer range (Ulrich, 1983). As to Mn, it is noteworthy that this heavy metal was mobilized in the high-N plots in greater quantity than were the base cations together.
Soil acidi cation is connected with increased solubilization of Al containing solid phases(e. g. gibbsite or organically bound Al; Thomas and Hargrove, 1984; Mulder et al., 1989a). The solubility of Al, Ca, Cd, K, Mg, Mn, Na, Rb, and Zn is very susceptible to changes in soil acidity, as demonstrated by experimental acidi cation of lysimeter soils (Bergkvist, 1986). A minor pH decrease within the measured pH range of the soils in the present study will raise the soil-solution concentration of these metals considerably (Bergkvist, 1987a; Tyler et al., 1987). The origin of the solubilized base cations and Cd is cation exchange complexes (Berggren, l992a). Since Cu is mainly mobilized in the form of complexes with organic matter, the increased Cu ux in the treated soils is probably more a result of increased leaching of organic matter than of acidi cation (Berggren, 1992b).
The strongly enhanced NO; leaching in the treated soils indicates that the vast majority of the added N was not taken up by the roots. This feature is characteristic of N saturation (Nihlgård, 1985). In combination with a high bulk deposition of N, the lack of N interception by the canopy forms another sign of N saturation of this beech-forest soil. In less N-loaded environments, the N ux is commonly lower in throughfall than in bulk deposition (Helmisaari and Mälkönen, 1989; Parker, 1990).
Most of the leaching of NO3 and NH,,+ commonly occurs during spring when plant uptake and soil biological activity are low (Mälkönen, 1990). This was so also in the untreated plots of Maglehem. In the treated plots, the N leaching was of about the same size during the foliated and the defoliated half year, however.
This is further evidence of N saturation.
This suggested incapability of the tree roots to take up the excess N in the treated plots may be related to the deterioration of the mycorrhizal ef ciency that is indicated by the disappearance of fruitbodies of ectomycorrhizal macrofungi. This was in contrast to the litter-decomposing species where a drastic increase in the number of fruitbodies was found (Ruhling and Tyler, 1991). The increased DOC concen trations in the soil solution also point towards enhancement of the organic-matter mineralization rate in the N-treated soil, but the Ca and Mg carbonate addition with the fertilizer may also partly increase the solubilization of organic matter. Further evidence for an enhanced mineralization rate is provided by the slightly but signi cantly decreased C content of the humus layer of both the low and high N plots (Tyler et al., 1992). In contrast, Söderström et al., (1983) found N amendments to decrease microbial activity in Podzol soils.
Fertilizer amendments are often reported to result in raised concentrations of various elements in throughfall soon after supply (Khanna and Ulrich, 1981; Parker, 1990). This was not so in the present experiment with repeated treatment, not even for NO; or NHJ. This lack of response in the throughfall is remarkable with regard to the substantial increase in soil-solution concentrations of most elements analysed.
Despite the location of this forest far away from pollution sources, N input with bulk deposition was as high as 1.8 g m 2 yr 1 which is at the same level as that found in another local study (Bergkvist et al., 1987). Nitrogen deposition twice as high, 3.0 to 6.0 g m"2 yr l, is reported from deciduous and coniferous forests in Denmark and central Europe where at the same time the N output was in the range 1.1 to 8.7 g m"2 yr 1 (van Breemen et al., 1982, 1987; Bredemeier, 1985; Mulder et al., 1987; Rasmussen, 1988). Compared to this, the N output in our
control plots (1.2 g m 2 yr l) is rather low.
In input/output studies in a number of coniferous forests in northern and central Europe, if has been shown that NOJ N outputs are less than 0.1 g N m 2 yr 1 where inputs are less than 1.0 g N m"2 yr"1 (Grennfelt and Hultberg, 1986). The NO3 N output increases drastically as input exceeds 1.0 g N m 2 yr , and at inputs
of 2.4 g N m"2 yr , the NOJ-N output is almost 2.0 g N m"2 yr l. In the present
study, NOJ-N output from the upper 30 cm increased drastically upon N treatment. This beech forest soil thus seems to t into the pattern of increased N leaching from forest soils with increasing N inputs.
The soil-solution concentration of total Al is commonly reported to be in the range of 0.5 to 36 mg L 1 in studies of deciduous and coniferous forests on Cambisols and Podzols of Scandinavia, central Europe and the USA (Heinrichs and Mayer, 1977; Matzner and Hetsch, 1981; Lochman, 1983; David and Driscoll, 1984; Driscoll et al., 1985; Rost Siebert, 1985; Bergkvist l987a, b; Mulder et al., 1987, 1989b; Neitzke and Runge, 1987). Compared to this range, the Al concentrations in our control, low and high N soil solutions were in the lower, middle and middle/ upper part, respectively.
The leaching of base cations, Al and NO; in this acidic soil clearly indicates that the current load of N is, not only in the long run, above the sustainable, or critical load of N (Nilsson and Grennfelt, 1988).
6. Conclusions
In conclusion, the repeated treatment during ve and a half years of the Maglehem beech forest with granulated NH4NO3 gave the following main results:
Soil NO, leaching increased considerably with increasing N treatment.
Nitri cation, also occurring in the control soil, was greatly enhanced in the low-N plots. In the high-low-N plots, however, nitri cation seemed to be inhibited, and the great NO, leaching only slightly exceeded the amount of NO, added with the treatment.
The leaching of NOJ, whether arising from nitri cation, NO; addition or both, had a strongly acidifying in uence.
All N added to the high-N plots could not be recovered in soil or soil leachate. Denitri cation or incorporation into below or above-ground tree biomass could be tentative pathways of this excess N.
The treatment brought about a shift from the base-cation to the aluminium buffer range.
The soil acidi cation drastically increased the uxes of cations, especially Al, Mn and Rb.
The treatment promoted the mineralization of organic carbon. Beech litterfall C:N decreased with increasing N supply.
Fluxes of elements, including N, in litterfall of throughfall were not in uenced by the treatment.
This forest is N saturated. A moderate further increase in the N deposition, as NO; or NHJ, would soon lead to a considerable increase in NO; leaching and soil acidity as well as epletion of base cations and mobilization of Al and Mn.
Acknowledgments
Our gratitude is due to Bengt Nihlgård for providing soil samples, to Anders Jonshagen for eld work, to Anita Balogh for chemical analyses and to Dan Berggren for constructive criticism of the manuscript. The study was nancially supported by the Swedish Environmental Protection Agency.
References
Balsberg Påhlsson, A.-M.: 1992, In uence of nitrogen fertilization on minerals, carbohydrates, amino acids and phenolic compounds in beech (Fagus sylvatica L.) . Tree Physio]. (in press).
Berggren, D.: 1992a, Speciation and Mobilization of Aluminium and Cadmium in Podzols and Cambisols of S. Sweden . Water, Air, and Soil Pollut. (in press).
Berggren, D.: 1992b, Speciation of Copper in Soil Solutions from Podzols and Cambisols of S. Sweden . Water, Air, and Soil Pollut. (in press).
Bergkvist, B.: 1986, Water, Air, and Soil Pollut. 31, 901. Bergkvist, B.: 1987a, For. Ecol. Manage. 22, 2
Bergkvist, B.: 1987b, Water, Air, and Soil Pollut. 33, 131.
Bergkvist, B., Folkeson, L., and Olsson, K.: 1987, Fluxes of Protons, Metals and Anions in Spruce,
Beech and Birch Forest Ecosystems , in Direct Effects ofDry and Wet Deposition on Forest Ecosystems in Particular Canopy Interactions. Workshop, Lökeberg, Sweden, 19-23 October, 1986, Commission of the European Communities, EUR 11264, p. 79 85.
Boxman, A. W., Sinke, R. J., and Roelofs, J. G. M.: 1986, Water, Air, and Soil Pollut. 31, 517. Bredemeier, M.: 1985, In NH4 Tagung, Kasteel Groeneveld, Baarn, Utrecht, The Netherlands.
Breemen, N. van, Burrough, P. A., Velthorst, E.J., Dobben, H. F. van, Wit, T. de, Ridder, T.B., and
Reijnders, H. F. R.: 1982, Nature 299, 548.
Breemen, N. van, Mulder, J., and Grinsven, J. J. M. van; 1987, Soil Sci. Soc. Am. J. 51, 1634. David, M. B. and Driscoll, C. T.: 1984, Geoderma 33, 297.
Driscoll, C. T., Breemen, N. van, and Mulder, J.: 1985, Soil Sci. Soc. Am. J. 49, 437. Falkengren Grerup, U., 1989, J. Appl. Ecol. 26, 341.
Grennfelt, P. I. and Hultberg, H.: 1986, Water, Air, Soil Pollut. 30, 945. Gundersen, P. and Rasmussen, L.: 1990, Rev. Environ. Contam. Toxicol. 113, 1.
Haynes, R. J.: 1986, Mineral Nitrogen in the Plant-Soil System , in T. T. Kozlowski (ed), Physiological
Ecology Academic Press, Orlando. 483 pp.
Heinrichs, H. and Mayer, R.: 1977, J. Environ. Qual. 6, 402.
Helmisaari, H.-S. and Mälkönen, E.: 1989, Scand. J. For. Res. 4, 13.
Huttl, R. F.: 1990, Plant Soil 128, 45.
Khanna, P. K. and Ulrich, B.: 1981, Acta Ecologica/Gcologia Plantarum 2, 155. Kriebitzsch, W. -U.: 1978, Scripta Geobotanica 14. Göttingen. 66 pp.
Lang, E.: 1986, Göttinger Bodenkundliche Berichte 89. Göttingen, 199 pp.
Lochman, V.: 1983, Lestnictvi 29, 659.
Lovett, G. M. and Lindberg, S. E.: 1986, Biogeochemistry 2, 137.
Mälkönen, E.: 1990, Plant Soil 128, 75.
Matzner, E. and Hetsch, W.: 1981, Z. Pflanzenernaehr. Bodenka'. 144, 64.
Mulder, J., Grinsven, J. J. M. van, and Breemen, N. van: 1987, Soil Sci. Soc. Am. J. 51, 1640. Mulder, J., Breemen, N. van, and Eijck, H. C.: 1989a, Nature 337, 247.
Mulder, J., Breemen, N. van, Rasmussen, L. and Driscoll, C. T.: 1989b, Aluminum Chemistry of
Acidic Sandy Soils with Various Inputs of Acidic Deposition in The Netherlands and in Denmark,, in T. E. Lewis, (ed.), Environmental Chemistry and Toxicity of Aluminum, 194th Annual Meeting of the American Chemical Society, New Orleans, August 30 September 4, 1987, Lewis Publishers,
Inc., Chelsea, Michigan, pp. LII-194.
Neitzke, M. and Runge, M.: 1987, Bot. Jahrb. Syst. 108, 403.
Nihlgård, B.: 1972, Oikos 23, 69. Nihlgård, B.: 1985, Ambio 14, 2.
Nilsson, J. and Grennfelt, P. I. (eds.): 1988, Critical Loads for Sulphur and Nitrogen. Nordic Council of Ministers, Report. 1988: 15. Copenhagen.
Parker, G. G.: 1990, Evaluation of Dry Deposition, Pollutant Damage, and Forest Health with
Throughfall Studies , in A. A. Lucier and S. G. Haines (eds.), Mechanisms of Forest Response to Acidic Deposition, Springer-Verlag, New York, pp. 10 61.
Rasmussen, L., Jörgensen, P., and Kruse, S.: 1986, Bull. Environ. Contam. Toxicol. 36, 563.
Rasmussen, L.: 1988, Report from Laboratory of Environmental Science and Ecology, Technical University of Denmark. Lyngby. 74 pp.
Reuss, J. O. and Johnson, D. W.: 1986, Acid Deposition and the Acidi cation of Soils and Waters ,
Ecological Studies 59. Springer-Verlag, New York.
Rost-Siebert, K.: 1985, *Untersuchungen zur H- and Al-Ionen-Toxizität an Keimpflanzen von Fichte (Picea abies) und Buche (Fagus sylvatica) in Lösungskultur . Diss. University of Göttingen. Ber. Forschungszentrum Waldökosysteme Universisa't Göttingen 12. Göttingen. 219 pp.
Schaefer, D. A. and Reiners, W. A.: 1990, Throughfall Chemistry and Canopy Processing Mechanisms , in S. E. Lindberg, A. L. Page and S. A. Norton (eds.), Sources, Deposition, and Canopy Interactions, Advances in Environmental Science, Acidic Precipitation, vol. 3. Springer-Verlag, New York, pp.
241-284.
Söderström, B., Bååth, E., and Lundgren, B.: 1983, Can. ]. Microb. 29, 1500.
Tamm, C. O.: 1991, Nitrogen in Terrestrial Ecosystems. Questions of Productivity, Vegetational Changes, and Ecosystem Stability , Ecological Studies 81. Springer Verlag, New York.
Thomas, G. W. and Hargrove, W. L.: 1984, The Chemistry of Soil Acidity , Soil Acidity and Liming. Agronomy Monograph no. 12 (2nd ed.) Madison, USA.
Tyler, G., Berggren, D., Bergkvist, B., Falkengren-Grerup, U., Folkeson L., and Ruhling, A.: 1987,
Soil Acidi cation and Metal Solubility in Forests of Southern Sweden , in T. C. Hutchinson and K. M. Meema (eds.), Effects ofA tmospheric Pollutants on Forests, Wetlands and Agricultural Ecosystems. NATO ASI Series, Vol. G16, Springer-Verlag Berlin Heidelberg, pp. 347-359.
Tyler, G., Balsberg Påhlsson, A.-M., Bergkvist, B., Falkengren-Grerup, U., Folkeson, L., Nihlgård,
B., Ruhling, Ä, and Stjernquist, I.: 1992, Scand. ]. For. Res. 7.
Ulrich, B.: 1983, Soil Acidity and its Relations to Acid Deposition , in B. Ulrich and J. Pankrath (eds.), Effects ofAccumulation ofAir Pollutants in Forest Ecosystems, Kluwer Acad. Publ., Dordrecht, Holland, pp. 127 146.
Wiman, B. L. B., Unsworth, M. H., Lindberg, S. E., Bergkvist, B., Jaenicke, R. and Hansson, H. -C.: 1990, J. Aerosol Sci. 21, 313.