Number E-C126 June 2008
Surface Transportation Weather
and
Snow Removal and
Ice Control Technology
Fourth National Conference on
Surface Transportation Weather
Seventh International
Symposium on Snow Removal
and Ice Control Technology
June 16–19, 2008
Chair: Debra L. Miller, Secretary, Kansas Department of Transportation, Topeka
Vice Chair: Adib K. Kanafani, Cahill Professor of Civil Engineering, University of California, Berkeley Division Chair for NRC Oversight: C. Michael Walton, Ernest H. Cockrell Centennial Chair in
Engineering, University of Texas, Austin
Executive Director: Robert E. Skinner, Jr., Transportation Research Board
TRANSPORTATION RESEARCH BOARD 2008–2009 TECHNICAL ACTIVITIES COUNCIL
Chair: Robert C. Johns, Director, Center for Transportation Studies, University of Minnesota, Minneapolis
Technical Activities Director: Mark R. Norman, Transportation Research Board
Paul H. Bingham, Principal, Global Insight, Inc., Washington, D.C., Freight Systems Group Chair Shelly R. Brown, Principal, Shelly Brown Associates, Seattle, Washington, Legal Resources Group Chair Cindy Burbank, National Planning and Environment Practice Leader, PB, Washington, D.C., Policy and
Organization Group Chair
James M. Crites, Executive Vice President, Operations, Dallas–Fort Worth International Airport, Texas, Aviation Group Chair
Leanna Depue, Director, Highway Safety Division, Missouri Department of Transportation, Jefferson City, System Users Group Chair
Arlene L. Dietz, C&A Dietz, LLC, Salem, Oregon, Marine Group Chair
Robert M. Dorer, Deputy Director, Office of Surface Transportation Programs, Volpe National
Transportation Systems Center, Research and Innovative Technology Administration, Cambridge, Massachusetts, Rail Group Chair
Karla H. Karash, Vice President, TranSystems Corporation, Medford, Massachusetts, Public Transportation Group Chair
Mary Lou Ralls, Principal, Ralls Newman, LLC, Austin, Texas, Design and Construction Group Chair Katherine F. Turnbull, Associate Director, Texas Transportation Institute, Texas A&M University,
College Station, Planning and Environment Group Chair
Daniel S. Turner, Professor, University of Alabama, and Director, University Transportation Center for Alabama, Tuscaloosa, Operations and Maintenance Group Chair
Surface Transportation Weather
and
Snow Removal and Ice Control Technology
Fourth National Conference on
Surface Transportation Weather
Seventh International Symposium on
Snow Removal and Ice Control Technology
June 16–19, 2008 Indianapolis, Indiana
Sponsored by
Transportation Research Board of the National Academies
In Cooperation with
Indiana Department of Transportation
American Association of State Highway and Transportation Officials Federal Highway Administration
June 2008
Transportation Research Board 500 Fifth Street, NW Washington, DC 20001
The Transportation Research Board is one of six major divisions of the National Research Council, which serves as an independent adviser to the federal government and others on scientific and technical questions of national importance. The National Research Council is jointly administered by the National Academy of Sciences, the National Academy of Engineering, and the Institute of Medicine. The mission of the Transportation Research Board is to provide leadership in transportation innovation and progress through research and
information exchange, conducted within a setting that is objective, interdisciplinary, and multimodal. The Transportation Research Board is distributing this Circular to make the information contained herein available for use by individual practitioners in state and local transportation agencies, researchers in academic institutions, and other members of the transportation research community. The information in this Circular was taken directly from the submission of the authors. This document is not a report of the National Research Council or of the National Academy of Sciences.
Surface Transportation Weather Task Force Wilfrid A. Nixon, Chair
Richard J. Nelson and Richard Wagoner, Vice Chairs Roemer Alfelor Roya Amjadi William M. Browder James D. Colyar Frank L. Estis Christopher Flanigan Tina Greenfield Arthur L. Handman Keishi Ishimoto Sandra Q. Larson Peter P. Neilley Jim O’Sullivan Jan Olander Leon F. Osborne, Jr. Max S. Perchanok Joseph Perrin, Jr. Panos D. Prevedouros Adel W. Sadek Kathy Strebe Surface Transportation Weather Program Subcommittee
Wilfrid A. Nixon Roemer Alfelor Peter P. Neilley Leon F. Osborne, Jr. Winter Maintenance Committee
John P. Burkhardt, Chair Joseph Brett Althouse
Roya Amjadi Richard M. Balgowan Lisa Ballard Dennis W. Belter Pete F. Costello Tim Croze Rand Decker Charles C. Goodhart Richard L. Hanneman Yasuhiko Kajiya Patrick Kennedy Dennis A. Kroeger David A. Kuemmel Chan-young Lee Mikko Malmivuo L. David Minsk Tony Myhra Richard J. Nelson Wilfrid A. Nixon Jan Olander Max S. Perchanok Thomas E. Pericak Lin Qiu Sean M. Riley Noriyuki Sato Xianming Shi Leland D. Smithson Gregory E. Thompson Torgeir Vaa Donald M. Walker Yetkin Yildirim Snow Removal and Ice Control Technology Program Subcommittee
John P. Burkhardt
Dennis W. Belter Richard L. Hanneman William Mahoney Wilfrid A. Nixon Frank N. Lisle, TRB Staff Representative
Transportation Research Board 500 Fifth Street, NW Washington, DC 20001
www.TRB.org
Ann E. Petty, Production Editor; Jennifer Correro, Proofreader and Layout; Jennifer J. Weeks, Manuscript Preparation; Mary McLaughlin, Jennifer Merrill Thompson, and Deborah Uffelman, Proofreaders
Preface
he 4th National Conference on Surface Transportation Weather was held on June 16–17, 2008, and the 7th International Symposium on Snow and Ice Control on June 17–19, 2008, in Indianapolis, Indiana. The conference was conducted by the Transportation Research Board (TRB) Task Force on Surface Transportation Weather, and the symposium, by the Winter Maintenance Committee, in cooperation with Indiana Department of Transportation, AASHTO, and FHWA. This conference and symposium included papers and presentations on the
application of weather information in transportation agencies; snowplow operations; maintenance decision support systems; modeling and forecasting weather in surface transportation; data collection and assessing technologies; impact of weather on traffic operations; weather information for drivers; environmental stewardship; blowing snow; pavement surface temperature; surface friction measurement; and characteristics of materials. Maintenance managers, engineers, and researchers from the following countries presented their papers: Canada, Denmark, France, Germany, Japan, Norway, Sweden, Switzerland, and the United States. The papers were not subjected to the TRB peer review process.
T
Contents
NATIONAL PERSPECTIVES AND ASSESSING TECHNOLOGIES
A New Paradigm in Observing the Near Surface and Pavement: Clarus and Vehicle
Infrastructure Integration(Weather08-012)...3 Paul A. Pisano, Patrick J. Kennedy, and Andrew D. Stern
Winter Operations in View of Vision Zero(Snow08-041)...16 Torgeir Vaa and Åge Sivertsen
Proposed Test Bed for Surface Transportation Weather Technologies(Weather08-025) ....27 Mark A. Askelson and Leon F. Osborne, Jr.
MODELING AND FORECASTING TEMPERATURE IN SURFACE TRANSPORTATION
Modeling Rail Temperature with Real-Time Weather Data(Weather08-001) ...37 Yu-Jiang Zhang and Sung Lee
The Road Temperature Forecast Tool(Weather08-009) ...49 Daniel Bättig
Spatial and Temporal Mapping of Pavement Temperatures for
Optimal Winter Road Maintenance Operations (Snow08-035A)...57 L. Fu, B. Hashemloo, F. Feng, and Max S. Perchanok
Night Icing Potential Demonstration Project (Snow08-045)...58 Paul J. DeLannoy, Shawn Allan, Terry M. Bullock, John D. McClintock, Greg Moffatt,
David Robbins, Robert Sayer, Philip Woodhams, Paul Richard, and Bernie MacDonald
CHARACTERISTICS OF MATERIALS
Eutectic Depressants: Relationship of Eutectic, Freezing Point, and
Ice Melting Capacity in Liquid Deicers(Snow08-008) ...73 Scott Koefod
The Amount of Salt on Road Surfaces After Salt Application: A Discussion
of Mechanisms and Parameters (Snow08-013)...85 Kai Rune Lysbakken and Harald Norem
Wet Dust Sampler: Technological Innovation for Sampling
Particles and Salt on Road Surface(Snow08-028)...102 Per Jonsson, Göran Blomqvist, and Mats Gustafsson
Numerical Evolution of Deicer Amount on Pavement Surface:
Traffic and Weather Influences(Snow08-046)...112 Mario Marchetti, Rodolphe Duval, Jean Livet, Maurice François,
Philippe Pecquenard, and Pierre Guillevic
USING WEATHER INFORMATION TO IMPROVE TRAFFIC SAFETY
Comprehensive Winter Maintenance Management System to
Increase Road Safety and Traffic Flow (Snow08-052) ...127 Thorsten Cypra
Advanced Road Safety and Weather Warning System (Weather08-007) ...140 Paul G. Knight, Jonathan Aguero-Valverde, and Paul P. Jovanis
Improving Traffic Safety Under Adverse Weather Conditions (Weather08-018A)...155 Charla Gaskins, Nathan Huynh, and Emmanuel U. Nzewi
ENVIRONMENTAL STEWARDSHIP
Winter Model: Roadside Salt Exposure Under
Different Weather Conditions (Snow08-026) ...159 Göran Blomqvist and Mats Gustafsson
Impacts of Magnesium Chloride-Based Deicers on Roadside Vegetation (Snow08-050)....171 Nicole A. Trahan and Curt M. Peterson
Road Dust and Air Quality in Sweden (Snow08-027)...187 Mats Gustafsson, Göran Blomqvist, and Per Jonsson
MAINTENANCE DECISION SUPPORT SYSTEMS
Providing Winter Road Maintenance Guidance: An Update of the
Federal Highway Administration Maintenance Decision Support System (Snow08-019)..199 Kevin R. Petty, William P. Mahoney III, James R. Cowie, Arnaud P. Dumont, and
William L. Myers
Development of Winter Maintenance Support System:
Overview and Status (Snow08-022)...215 Naoto Takahashi, Roberto A. Tokunaga, and Motoki Asano
An Overview of Implementation and Deployment of the Pooled Fund
Study Maintenance Decision Support System(Snow08-038)...229 Robert D. Hart, John J. Mewes, Benjamin W. Hershey, Leon F. Osborne, Jr.,
and David L. Huft
Maintenance Decision Support System Is Not Just
for State Departments of Transportation (Snow08-029)...240 William (Pat) Kennedy
SNOWPLOW OPERATIONS AND EQUIPMENT
The High-Speed–Environmental Snowplow (Snow08-025) ...253 Pontus Gruhs
Plowing Wider and Faster on 21st-Century Highways by
Using 14-ft Front Plows and Trailer Plows Effectively(Snow08-003)...261 Robert Glenn Lannert
Global Positioning System–Controlled Salt Spreading:
From Idea to Implementation (Snow08-030)...267 Freddy Knudsen and Bo Sommer
Tools to Gain Faster Snow and Ice Response While Ensuring Preservation of Equipment: Especially with Part-Time or Seasonal
Snowplow Operators(Snow08-009) ...273 Larry E. Nelson
APPLICATION OF WEATHER INFORMATION IN TRANSPORTATION AGENCIES
Guidance for Creating and Maintaining Written Snow and Ice
Control Plan and Policy Documents(Snow08-001) ...287 Duane E. Amsler, Sr.
Follow-Up Study of Winter Standard as a Reaserch and
Development Project(Snow08-042)...304 Torgeir Vaa and Ivar Hol
Integrating Weather into Transportation Operations:
A Utah Department of Transportation Case Study(Weather08-005) ...318 Christopher K. Strong and Xianming Shi
ROLE OF SURFACE FRICTION IN WINTER MAINTENANCE
An Approach to Terrain Classification to Improve Road Condition Forecasts of
Maintenance Decision Support Systems Forecasts(Snow08-039)...337 Max S. Perchanok
A Probabilistic Model for Discriminating Road Surface
Conditions Based on Friction Measurement (Snow08-033A) ...351 L. Fu, F. Feng, and Max S. Perchanok
A Feasibility Study on Friction for Winter Road Management (Snow08-020)...352 Roberto A. Tokunaga, Makoto Funahashi, Naoto Takahashi, and Motoki Asano
Measurements of Pavement Condition and Road Weather Environment
Within North Dakota Using a Tow-Hitch Mount Road Grip Tester(Snow08-016)...364 Jeffrey S. Tilley, Scott S. Kroeber, Jennifer Green, Diana Clonch, and Don Halliday
BLOWING AND DRIFTING SNOW
The Physical Nature and Prediction of Blowing Snow
Within the Roadway Environment(Snow08-018) ...381 Benjamin W. Hershey and Leon F. Osborne, Jr.
Geospatial Variability of Roadway Vegetation and Blowing Snow (Snow08-031)...393 Scott S. Kroeber, Damon M. Grabow, and Leon F. Osborne, Jr.
Spatial Modeling for Evaluation and Remediation of
Snow Drifting on Ontario Highways (Snow08-036A)...403 Max S. Perchanok, Steve McArdle, Patrick Grover, and Aleksey Naumov
WEATHER SENSORS AND DATA COLLECTION
Noninvasive Road Weather Sensors(Weather08-002)...407 Paul Bridge
Using the Probe Vehicle to Gather Information on
Visibility in Snowstorms(Snow08-006)...416 Masaru Matsuzawa, Yasuhiko Kajiya, Yuma Matsuyama, Takashi Nishida, and
Yasuhiro Nagata
Operational Considerations in the Integration of Technologies for Automated Vehicle Location and Mobile Data Collection into
Decision Support Systems for Maintenance and Operations (Snow08-037) ...429 John J. Mewes, Robert D. Hart, Benjamin W. Hershey, Leon F. Osborne, Jr., and
David L. Huft
RELATIONSHIPS BETWEEN WEATHER EVENTS AND TRAFFIC OPERATIONS
Toward Weather-Responsive Traffic Management on
French Motorways (Weather08-014) ...443 Nour-Eddin El Faouzi, Olivier de Mouzon, and Romain Billot
Long-Term Analysis of Reductions in Traffic Volume Across
New Hampshire During Winter Storms(Weather08-011)...457 Melissa Grace Wellman, Samuel Miller, Stephen Gray, and Joseph Zabransky
Impact of Snow on Video Detection Systems
at Signalized Intersections(Weather08-013) ...469 Juan C. Medina, Madhav V. Chitturi, and Rahim F. Benekohal
RELATIONSHIPS BETWEEN WINTER SERVICE AND WEATHER
Modeling Winter Maintenance Activities Using Classification Trees(Weather08-010)...483 Jean Andrey, Alexander Brenning, Denis Kirchhoff, Brian Mills, and Max S. Perchanok
The Possibility of Implementing the Management Cycle of Winter
Maintenance by Performance Measurement (Snow08-007) ...499 Motoki Asano and Roberto A. Tokunaga
Winter Model: Road Condition Submodel(Snow08-011)...512 Staffan Möller
Estimating the Relationship Between Snow and Ice
Maintenance Performance and Current Weather Conditions(Snow08-053)...519 Thomas H. Maze, Massiel A. Orellana, Alicia Carriquiry, and Chris Albrecht
WEATHER AND PAVEMENTS
Physical Processes That Affect Runway Surface Conditions
During Winter Time: A Conceptual Model (Snow08-014) ...537 Alex Klein-Paste
The Pavement Precipitation Accumulation Estimation System(Snow08-017)...544 Mark A. Askelson
Temperature and Precipitation Sensitivity Analysis on
Pavement Performance(Weather08-019)...558 James T. Smith, Susan L. Tighe, Jean Andrey, and Brian Mills
SafeLane Overlay Performance Testing: Winter 2005–2006 (Snow08-004) ...572 Wilfrid A. Nixon
PROVIDING WEATHER INFORMATION TO IMPROVE DRIVER DECISIONS
Personal Weather Advisor: Providing Drivers with
In-Vehicle, Real-Time Weather Awareness(Weather08-008A)...585 Daniel R. Gallagher, Bob Baron, Bob Dreisewerd, John McHenry, and Don Olerud
A Study on the Expression of Winter Road Information and
Its Effects on Drivers’ Travel Decision Making (Snow08-021)...586 Yasuhiko Kajiya, Yasuaki Matsuda, and Tetsuro Matsushima
Driving Decisions Related to the Colorado Front Range
Winter Storm, December 20–21, 2006(Weather08-023)...597 Sheldon Drobot
WINTER EVENTS, FOG, AND PERFORMANCE MEASURES
The Role of Risk, Reliability, and Probability in the Interaction of Weather
and Surface Transportation (Weather08-016A) ...611 Wilfrid A. Nixon
Fog Forecast Provision Experiment for a Mountain Pass(Snow08-024) ...612 Yuma Matsuyama, Tatsuo Miyoshi, Matsuda Yasuaki, Masaru Matsuzawa, and
Yasuhiko Kajiya
Performance Measures for Snow and Ice Control Operations(Snow08-051) ...625 Thomas H. Maze, Chris Albrecht, and Dennis A. Kroeger
x
BENEFITS AND COSTS OF WINTER MAINTENANCE
Benefits and Costs Associated with
Maintenance Decision Support Systems(Weather08-004A)...641 Christopher K. Strong and David L. Huft
A Snow Removal Cost Estimation Model Using the Snow
Removal Unit Cost Curve(Snow08-044) ...642 Shigeyuki Nakamae, Junichi Oshima, Takahiro Okawado, Fumihiro Hara, and Shin-ei Takano
National Perspectives and
Assessing Technologies
NATIONAL PERSPECTIVES AND ASSESSING TECHNOLOGIES
A New Paradigm in Observing the Near Surface and Pavement
Clarus and Vehicle Infrastructure Integration
PAUL A. PISANO PATRICK J. KENNEDY Federal Highway Administration
ANDREW D. STERN Noblis, Inc.
The nation’s weather enterprise generally relies on a network of a couple thousand automated weather observing stations to sense and report on the state of the lower atmosphere. These stations are typically situated in pristine fields adjoining airport runways. And while these stations fulfill the requirements for airport ground operations, they do little to report accurately on pavement and near surface conditions on the nation’s roads. The FHWA is doing something about this data coverage gap through two initiatives: Clarus and Vehicle Infrastructure Integration (VII). First, the Clarus Initiative seeks to maximize the utility of road weather observations by running quality checks on the data and then disseminating the observations to the weather and transportation communities. The Clarus Initiative involves the creation of an advanced data management system that will be able to assimilate all environmental sensor station observations across North America and provide quality-checked road weather observations for any user. The second initiative involves utilizing passenger vehicles as mobile weather probes. The VII Initiative is based on having automobile manufacturers equip cars with onboard units and transceivers that are capable of collecting snapshots of dozens of onboard systems (e.g., windshield wiper state or outside air temperature) and transmitting these data to a national communications infrastructure. Successful deployment of such a national system could result in the generation of millions of new vehicle-based observations that could reveal new details about the state of the atmosphere at the driver’s level and conditions on the pavement surface. This paper provides details on the progress of both the Clarus and VII Initiatives, which have the potential to change the way that the nation observes and manages surface weather data.
he National Oceanic and Atmospheric Administration (NOAA) National Weather Service (NWS) tracks and categorizes the number of fatalities that are attributed to adverse weather each year (1). Figure 1 shows that on average, for the 10-year period ending in 2006, 650 people are killed in adverse weather. Many of these deaths are associated with major weather events, such as a landfalling hurricane or a major winter storm, that may have a national impact.
T
A much less discussed statistic is the number of people killed in automobile crashes during adverse weather each year. Many deaths occur as single-incident fatalities and often receive little press. The NHTSA has shown that during the 11-year period from 1995 to 2005, 1.57 million weather-related crashes each year, there are 690,000 injuries and 7,400 fatalities (2). This last value is more than 10 times larger than all of the weather-related fatalities tracked by the NWS combined.
The FHWA Road Weather Management (RWM) program believes that these statistics are unacceptable and has initiated numerous programs to reduce fatalities and to promote safety
FIGURE 1 Average annual weather-related fatalities for the United States. Statistics for weather categories (from “Total NWS Tracked” and to the left are from the National Weather Service U.S. Natural Hazards Statistics web page) are for the 10-year period ending
in 2006. Aviation fatality statistics are from the FAA for the 2-year period ending in 2005. Road weather fatality statistics are from NHTSA for the 11-year period ending in 2005.
on the nation’s roadways. Two initiatives, Clarus and Vehicle Infrastructure Integration (VII), will be discussed.
THE CLARUS INITIATIVE
For the past several decades, environmental observing networks have grown in number, sophistication, and level of detail. However, rather than concentrating on surface conditions, most observational networks focus their instrumentation, observations, and resulting products in the atmospheric (aboveground) domain. Well-established research initiatives (such as the FAA’s Aviation Weather Research Program) have contributed to a significant reduction in weather-related plane crashes, and the increased meteorological knowledge has resulted in better aviation forecasts and warnings.
In contrast, the efforts to invest in observations and products focused on the near surface, pavement surface, and subsurface have been inconsistent, less organized, and only modestly funded, mostly via limited state resources. Federal administration of surface observation
programs focused on the aviation community and the deployment of runway (ground) sensors at some airports. As a result, state departments of transportation (DOTs) had to invest in
environmental sensor stations (ESS) to obtain weather and pavement conditions along their road networks. Most ESS are field components of Road Weather Information Systems (RWIS). These ESS are deployed along roadways and other transportation facilities to provide their agencies with observations on surface conditions to improve safety and mobility on the nation’s roads.
The current challenge is that the available sources of RWIS data are not managed to develop a comprehensive and coherent picture of conditions in the surface transportation domain. Other stakeholder communities outside transportation, such as agriculture, water management, and power utilities, have made similar investments to compensate for their lack of surface observations and data management capabilities. The end result is a mosaic of discrete observation points owned by various public and private entities without interaction with the greater community.
In 2003, the FHWA approached the National Academy of Sciences (NAS) and described the problems and challenges. In 2004, it responded with its landmark report, “Where the Weather Meets the Road: A Research Agenda for Improving Road Weather Services” (3). In the report, NAS acknowledged the troubling statistics associated with weather-related vehicle fatalities and recommended that the nation invest in a robust, integrated road weather observational network and database management system. This visionary idea was the impetus for the Clarus Initiative.
The Clarus System
Clarus, which means “clear” in Latin, is a data management system for the collection, quality
checking, and dissemination of surface transportation–related observations from North America. Figure 2 shows a timeline of the Clarus system development process. From 2004 into 2006, the
Clarus system progressed through a rigorous systems engineering process that extended from
concept of operations development and requirements gathering to design and implementation. All engineering documents can be found at the Clarus Initiative website,
www.Clarusinitiative.org.
One of the most important developmental activities associated with Clarus was the creation of a group of interested practitioners who would be used as a resource throughout the Initiative. Coined as the Initiative Coordinating Committee (ICC), this multidisciplinary group of stakeholders from the public, private, and academic communities across the transportation and weather sectors participated in the requirements gathering process and served as evaluators of design documents and as members of subject-specific task forces. These task forces dealt with a number of issues ranging from reviewing the foundational concept of operations documentation to metadata collection and data dissemination policies.
Once the Clarus system was built and operating, a proof-of-concept (PoC) demonstration was held during the fall of 2006 in three states: Alaska, Minnesota, and Utah. The PoC showed that state DOTs could provide both data files and station metadata to the Clarus system. The demonstration also showed that each of the processing modules functioned properly, allowing for the parsing, caching, and quality checking of hundreds of observational fields.
By the end of 2006, initial development and testing of the Clarus system was
successfully completed. Its internal memory and database was designed to cache millions of observations for a period of 1 week. The next steps were to create a web portal to make interacting with the system easier and to begin populating the database with ESS observations from across the continent.
FIGURE 2 Timeline of the Clarus Initiative extending from the vision for the project (from the NAS study) to the eventual transition to operations.
The transition to NOAA may take through 2011 to complete.
The Clarus Graphical User Interface
To facilitate use of the Clarus system and to promote data exploration, a simple graphical user interface (GUI) was developed. The GUI, which can be accessed on the web at Clarus.mixonhill. com, provided an easy way to retrieve and visualize the ESS data. The home page for Clarus, shown in Figure 3, provides access to state DOT ESS data through links. A series of menu-driven queries allows users to access observations from individual stations or entire states from one point in time to a large time window.
The GUI provides for easy spatial visualization of the ESS data by using Google Maps geonavigation tools. As an example, Figure 4 displays air temperature data from ESS sites in Minnesota. The purple “thumb tacks” indicate that current data are available in the system. Gray thumb tacks show where the current receipt of data has been interrupted or stopped. This may be an indication of sensor failure or a communications problem.
FIGURE 3 Home page for the Clarus system can be found at clarus.mixonhill.com before the transition to NOAA. This web portal allows access to the Google
Maps–based GUI and to the cache for data exploration.
FIGURE 4 A Clarus display using Google Maps as the display tool. In this example, air temperature data from Minnesota DOT and
Quality checking output and location-specific metadata can be easily displayed from the GUI. Figure 5 shows the result of clicking on a purple thumb tack. All of the observation fields are shown in a table. Quality checking algorithm titles can be seen along the top. Within the table matrix, green circles represent a quality checking test that passed. A red X indicates that the results of the quality checking test were beyond thresholds set within the metadata. Receipt of a failure icon does not necessarily mean that the data or sensors are bad. It does, however, provide an easy way for state DOT ESS administrators or even end users to spot sites that may require additional investigation.
The Clarus system also allows for the creation of subscriptions through the GUI. A subscription is a convenience process that can be used primarily with automated data retrieval systems. Once a subscription has been invoked, a selected group of observations will be placed into a protected directory at a known time interval. Hence, an external data collection system would be able to retrieve only the most recent observations for a specific time period from one constant web address.
The GUI is for demonstration and familiarity purposes only. The portal does not provide any value-added information or content. It is expected that external interests in the weather enterprise will eventually construct a much more sophisticated Web portal. In fact, the FHWA is even aiding in this process through a project called the Clarus multistate regional demonstration.
FIGURE 5 The GUI allows users of the Clarus system to monitor the results of the quality checking tests. In this example, the test names are shown vertically along the top of the
displayed table. Test results are shown as green circles (passed), red X’s (failed), and dashes (not scheduled to run for this sensor). A failed result may mean that a sensor is bad,
Clarus Multistate Regional Demonstrations
During the second half of 2006, as the Clarus dystem was undergoing its PoC demonstration and evaluation, the FHWA introduced to the stakeholder community a series of activities which are called the Clarus multistate regional demonstrations. Through the demonstrations, FHWA aims to achieve the following objectives:
1. Demonstrate that the Clarus system functions as designed by incentivizing a large number of state and local agencies to contribute data from their ESS networks;
2. Enable proactive transportation system management through utilization of the Clarus System; and
3. Provide an environment so that the private sector and academic organizations can innovate and create new and improved products that will benefit the public, academia, and the entire weather enterprise.
The Clarus multistate regional demonstrations contained three distinct phases. The phases were
• Phase 1. Concept of operation (ConOps) development, • Phase 2. Connection Incentive Program (CIP), and • Phase 3. Application development and deployment.
Phase 1. Concept of Operations Development
The first phase of the regional demonstrations contained two parts. In the first part, teams of state DOTs (or provincial transportation ministries) were to form teams along a common corridor (such as an interstate highway). The teams would need to develop a ConOps of business-to-government solutions which were enabled by utilization of the Clarus system. The ConOps could describe any number of innovative new products, services, algorithms, or systems that would improve surface transportation safety, mobility, or productivity. The second part of the first phase of the regional demonstration promoted the population of the Clarus database with transportation agency ESS data.
During late 2006, the FHWA issued a request for applications (RFA) from public transportation agencies. In early 2007, three groups of transportation agencies were selected for participation in the regional demonstrations. These groups were
Group 1. Northwest Passage. This team consisted of state DOTs along the I-90/I-94 corridor extending from Wisconsin through Minnesota, North Dakota, South Dakota, Wyoming, Montana, and Idaho to Washington State.
Group 2. ALCAN (Alaska–Canada). This team consisted of Alaska DOT, the provincial transportation ministries in Yukon, British Columbia, and Alberta and Environment Canada.
Group 3. Aurora Consortium. This team consisted of Aurora members along the I-80 corridor extending from Iowa to Illinois, Indiana, and Ohio.
ConOps documents from each of the groups were delivered to FHWA in January 2008. The use and disposition of the ConOps is explained below in the third phase of the regional demonstrations.
Phase 2. Connection Incentive Program
The second phase of the Clarus multistate regional demonstrations is the CIP. The objectives of the CIP are to both incentivize public transportation agencies into providing their ESS data (observations and metadata) to the Clarus System and to provide financial assistance to agencies to help offset some of the expenses associated with connecting to the Clarus system.
Funding has been set up to be streamlined in the form of federal grants to state DOTs. Funding can be used to offset travel expenses to each ESS for the purpose of collecting and organizing site and sensor metadata. To contribute ESS data to Clarus, a certain amount of metadata must be obtained and entered into the system. Specifics about required and optional metadata fields can be found on the Clarus Initiative website at www.Clarusinitiative.org/ documents.htm under “Metadata Dictionary.”
Grant funds can also be used to procure hardware such as handheld Global Positioning System (GPS) units or digital cameras to aid in collecting and documenting site metadata.
Funding can also be used to acquire a consultant to compile climate metadata or to have software developed to put ESS observations into a standard format (such as comma delimited text or XML).
Under the streamlined application process, transportation agencies need only create a technical plan and a financial plan. The technical plan affirms the agency’s eligibility to receive the funds and provides details about its ESS network. The financial plan provides expenditure details and includes information about the required 20% state match. Funds cannot be used to purchase new ESS sensors. The CIP will be available through the end of fiscal year 2008.
Phase 3. Application Development and Deployment
The third phase of the Clarus multistate regional demonstrations involves implementation of innovations that were included in Phase 1 ConOps documents. Each ConOps will undergo an internal evaluation at FHWA. Each concept within a ConOps will be evaluated based on
• Strengths and weaknesses,
• Similarities (with other proposals),
• The probability of successful completion, and • The potential business model.
At the time this paper was written, the plan was to post a request for proposals (RFP) in late winter–early spring of 2008 for members of the weather enterprise to implement selected “concepts” within the ConOps documents. The companies will be given 24 months to work on implementation details, which include utilization of a full systems engineering process. Once a concept has been implemented, the new product or service will become the property of the participant company.
In addition to implementation activities, participants in Phase 3 will take part in an independent evaluation of the Clarus system.
Clarus Transition to Operations
NWS has been interested in the Clarus Initiative since its inception. It is working on creating a new operational processing system that collects, quality checks, and disseminates observations from a diverse set of platforms ranging from space-based (satellite data) to remotely sensed data (e.g., from radar, sounders, balloons, aircraft).
Observations from the surface, which includes airport automated systems and
transportation ESS, are also planned for implementation. The transition from Clarus to the NWS operational system is expected to take place in 2011.
VII PROGRAM
All relatively new passenger vehicles on the road today contain small computers to monitor and control various systems such as engine combustion, antilock braking, and air bag deployment. What if the status of many onboard systems could be collected onboard and periodically
transmitted to a roadside receiver? What if near real-time information could then be sent back to the originating vehicle to provide advice about weather or road conditions, traffic, and collision avoidance? These concepts are the basis for U.S. DOT’s VII program.
Overview
The long-term objective of the VII program is to create an enabling communication
infrastructure to support both vehicle-to-vehicle and vehicle-to-infrastructure communications in support of both safety and mobility applications. Safety applications will increasingly have an emphasis on developing a crash avoidance capability. Mobility will include obtaining better information (in both quality and in density) for roadway system management and operations. This includes the potential to observe and infer both driver-level weather and pavement conditions.
Current plans for VII are to use wireless communications based on the Federal
Communication Commission’s (FCC) allocation of 5.9 GHz radio frequency for implementing direct short-range communications (DSRC) (4). Use of this frequency would allow low-latency, reliable, and secure communications between vehicles and the roadside within approximately ½ mi of each roadside unit. A consortium of eight automobile manufacturers is working on
common data and transmission formats. Inclusion of DSRC transponders in some new vehicles may begin as soon as the 2012 model year. There is, however, still a question of how many roadside units will be installed when VII-enabled vehicles hit the showroom floor. A sizable number of challenges face the VII program, including funding, private-sector participation, and privacy. All these challenges are being addressed by the managers of the VII program. The RWM program is focusing on the intersection of VII and weather.
Potential Data Elements
All VII-enabled cars will have a few capabilities in common:
• Each vehicle must have a GPS capability to be able to report its location and heading. • While not all vehicles will have the same type or amount of equipment onboard, a common, minimum set of data should be available for V2I communications (such as vehicle speed, windshield wiper state, and headlight state).
• It will be up to the automobile manufacturers to design and implement a
communications interface in the vehicle cabin to convey information with minimal distraction to the driver.
In addition to the basic elements listed above, Figure 6 shows a potential list of all available vehicle-based data elements. Elements such as antilock braking system, vehicle stability control, and vehicle traction control could be used to infer pavement conditions and a friction index. Windshield wiper state and headlight state could infer the occurrence of
precipitation. The windshield wiper rate and vehicle speed could infer precipitation rate. Exterior air temperature could infer precipitation type. These elements could easily be integrated with existing data sets (such as Doppler weather radar) to create more complete vehicle-based road weather observations (5).
According to current plans, data elements and status fields will be collected on the vehicle by a processor that polls each system during specific intervals. The polling intervals are controlled by certain events. Periodic collection of data elements will occur solely on the basis of the movement of the vehicle as an inverse function of its speed (6). A vehicle traveling at
Interstate speeds may collect snapshots every 30 s while a vehicle traveling on a secondary arterial at a slower speed may collect data every 10 s. Snapshot generation can also be invoked if an event is noted in one of the vehicle systems. An event would be a change in state of
FIGURE 6 The list shows many different types of in-vehicle systems that could be polled during VII demonstrations.
a system, such as turning the vehicle traction control from off to on or from activation of a safety system such as the antilock braking system. Finally, snapshots can be generated when a vehicle begins moving and stays above a certain speed (e.g., 10 mph) or when it comes to a stop. A maximum of 30 snapshots can be stored in the vehicle before older or less priority data is overwritten.
Field Operational Tests
FHWA is working with a number of contractors to hold one or more field operational tests during 2008. Roadside units and communications have already been installed in test beds near Detroit, Michigan, and Palo Alto, California. A number of other communities have indicated interest in setting up similar capabilities.
Data Analysis
The initial emphasis during the field demonstration will be to capture data from vehicles during as many different types of weather and traffic conditions as possible. This includes daytime and nighttime data runs, along with attempting to capture liquid, freezing and frozen precipitation events.
It is envisioned that data analyses will include
• Comparison of vehicle-based data to in situ observations (ESS and nearby automated airport observations);
• Determination if there are biases, quality errors, or outliers within the vehicle data set; and
• Estimation of the minimum number of data samples that would be required that would result in a quality observation for a specific segment of road.
Once the vehicle-based data are assessed and considered to be of good quality, a second analysis utilizing other weather data sets will occur. For example, a correlation study will be performed to compare Doppler weather radar reflectivity data with vehicle wiper status and wiper rate. This study may show that vehicle-based data can be a tool to define better where radar echoes actually produce precipitation that reaches the ground.
A second study may entail correlating antilock braking system, vehicle traction control, or vehicle stability control activation events with slippery road surfaces (e.g., road surface friction) and with observed external air temperatures.
Roadway Segmentation and Data Aggregation
Once sufficient data are collected and analyzed for quality, an additional study may commence to determine how vehicle-based probe data can best be aggregated for use by the weather enterprise and the transportation community. Currently, thousands of airport-based weather observations are available across the country. However, within a decade of the introduction of VII-enabled vehicles and its supporting communications network, there could be millions of vehicle-based probe messages available each day. What is the best way to process this fire hose of data?
One possible solution could be to collect, process, and analyze vehicle-based data by road segments. A segment could be defined as a fixed length of Interstate from one mile marker to the next. Or if it is determined that fixed segmentation is not reasonable because of microclimates, terrain, or infrastructure differences, then the segments could be variable and correlated to the local features. For example, a segment may be better defined as along a span of a bridge or a road surface along the bottom of a canyon. Most important, each road segment could have its own set of localized metadata which would be able to describe its location and unique features.
Once segmentation issues have been considered, the next step will be to analyze how much data are required to generate a statistically sound (e.g., free of bias or outliers) observation. Should data be collected for 10 min for each segment and then processed for data quality? Are there a minimum number of data samples below which a statistically sound observation cannot be generated? If the numbers of data samples are low during nonpeak periods but much higher during peak periods, should observation timing be different? These are just some of the questions that will be explored during this phase of research.
SUMMARY
The RWM program of the FHWA has been working on several projects that will benefit both the surface transportation and the weather communities. The objectives of both projects include improving mobility, safety, and productivity on the nation’s roadways.
This paper described two ongoing initiatives. The first is Clarus, which is a data management system for all public transportation agency surface transportation-related weather observations. The Clarus system has been designed and implemented and is currently being populated through the use of regional demonstrations and incentivizing programs. The latest documentation on the Clarus Initiative can be found and the program website,
www.Clarusinitiative.org.
The second initiative described within this paper is VII. It has been shown that different systems on passenger vehicles can be used to observe directly or infer weather and pavement conditions. The VII Initiative aims to partner with automobile manufacturers to create an infrastructure that allows for two-way communications between the vehicle and the roadside. The long-term objective of the VII program is to create an enabling communication
infrastructure to support both vehicle-to-vehicle and vehicle-to-infrastructure communications in support of both safety and mobility applications.
The Initiative has evolved to the point where test beds are being set up in several locations around the country. U.S. DOT plans on holding at least one field operational
demonstration during 2008 to test communications and to study the quality of the data. Several studies are planned to determine how best to process the potentially large amounts of data for the benefit of the surface transportation community and the weather enterprise.
REFERENCES
1. NOAA/National Weather Service, U.S. Natural Hazards Statistics web page: www.nws.noaa.gov/om/ hazstats.shtml. Accessed November 30, 2007.
2. Pisano, P. A., L. C. Goodwin, and M. A. Rossetti. U.S. Highway Crashes in Adverse Road Weather
Conditions. Paper 8.1. 87th Annual Meeting of the American Meteorological Society, New Orleans,
La., January 2008.
3. National Research Council. Where the Weather Meets the Road: A Research Agenda for Improving
Road Weather Services. The National Academies Press, Washington, D.C. www.nap.edu/catalog/
10893.html, 2004.
4. Petty, K. R., and W. P. Mahoney III. Enhancing Road Weather Information Through Vehicle Infrastructure Integration. In Transportation Research Record: Journal of the Transportation
Research Board, No. 2015, Transportation Research Board of the National Academies, Washington,
D.C., 2007, pp. 132–140.
5. Petty, K. R., and W. M. Mahoney III. Weather Applications and Products Enabled Through Vehicle
Infrastructure Integration (VII): Feasibility and Concept Development Study. National Center for
Atmospheric Research, Boulder, Colo., January 2007.
6. Vehicle Infrastructure Integration (VII): VII Architecture and Functional Requirements Version 1.1, USDOT, ITS Joint Program Office, Washington, D.C., July 20, 2005.
NATIONAL PERSPECTIVES AND ASSESSING TECHNOLOGIES
Winter Operations in View of Vision Zero
TORGEIR VAASINTEF Roads and Transport ÅGE SIVERTSEN
Centre for Road and Traffic Technology in Trondhei Norwegian Public Roads Administration
The project Winter Operations is one of several actions and subprojects in the Norwegian national demonstration project for Vision Zero Traffic Safety Lillehammer. The background for giving priority to winter operations was the many serious winter accidents on National Road E6 in the Lillehammer area in the period 1995–2002. The purpose with the project has been to test possibilities for improvements in the winter operations by looking into the choice of strategy, operational methods, and level of effort and also systems for decision support. To improve the general terms for safer roads there was also reconstruction of E6 with different measures. E6 is a trunk road passing through the study area and most of the measures have been concentrated to this road. The winter operation part of the Vision Zero project has given important knowledge regarding local operation of the Vision Zero road network, but has also lightened up situations of national importance. The more general experience is especially valid for the importance of good mechanical cleaning of the roadway to reduce the salt consumption. The “theory” of using a winter road strategy when it is too cold to use salt has been confirmed to be an effective
alternative to a bare road strategy.
he project Winter Operations is one of several actions and subprojects in the Norwegian national demonstration project for Vision Zero Traffic Safety Lillehammer. The background for giving priority to winter operations was the many serious winter accidents on E6 in the Lillehammer area in the period 1995–2002 (1).
T
OBJECTIVE
The objective of the project Winter Operations–TS Lillehammer is formulated like this: The purpose with the project is to test possibilities for improvements in the winter operations by looking into the choice of strategy, operational methods, and level of effort and also systems for decision support. The project will illustrate the consequences with regards to effects on driving conditions and traffic safety. The effect of different measures will be assessed in relation to costs by a change in the winter operations. One important goal for the project is that the results in addition to having a local significance will lead to knowledge transfer and found a basis for assessment of measures and initiatives in the future from a Vision Zero point of view.
WHAT HAS HAPPENED IN THE PROJECT PERIOD?
The following measures have been carried out in the project period: • New climate station established at Fåberg in autumn 2004. • New winter strategy (almost bare roads) in autumn 2005.
• Reconstruction of E6 with different measures; visual central reserve partly with rumble strips, two-lane road with crash barriers on central reserve, narrow four-lane road. The reconstruction was completed in autumn 2005.
• Testing alternative sanding methods.
• Change in the contractor’s operational routines autumn 2005 for adaptation to the physical changes on E6.
Figure 1 shows a road section with visual central reserve and rumble strips. Another example of physical measures is shown in Figure 2 with a picture of a road section with crash barriers on central reserve.
WINTER STRATEGY New Strategy
The new salting strategy is summarized in Table 1.The main difference compared to the former salt policy was that the new requirements allow for anti-icing actions and that the temperature limit for salting in connection with snowfall was removed. There was however still a
presumption that salting could only be carried out when snowfall was confirmed.
FIGURE 2 Two-lane road with crash barriers on central reserve.
TABLE 1 Strategy for Almost Bare Roads
Measures Measures and time to actions at different AADT Under 3,000 3,001–5,000 5001 and above
Anti-icing Carried into effect when friction can be expected to fall below 0.30 Deicing after
snowfall, bare in tracks within
6 h 4 h 2 h
The definition of the surface condition bare in tracks is that between the edge lines not less that 2/3 of the roadway should be free for snow and ice. For E6 the annual average daily traffic (AADT) is 10,000, i.e., the roadway should be bare in tracks within 2 h after the snowfall has ended. Compared to a full salting practice which requires bare road between the edges lines within the same time limits, this allows for a longer period to regain bare road condition after a snowfall.
RESULTS
Experiences with Changed Strategy
Viewed in relation to the salt consumption the strategy “almost bare roads” must be said to have been successful (see Figure 3).
18,9
8,5
5,2
0
5
10
15
20
25
at rom oad) etten stø) ads en N ryan with ltingo
Tons salt per km the winter season 2006 2005–
ns
T
Rv4/E6 Einav Ving (bare r n– E6 Vingrom–Tr N (Båd (almost bare ro E6 Trett ) (winter road (Bådstø)–F active saFIGURE 3 Salt consumption the winter season 2005–2006 on roads with different salting strategies.
In relation to previous practice with a kind of active salting, the increase in salt usage has been moderate. The difference in salt consumption between “almost bare road” and “bare road” is considerable when comparing E6 Vingrom–Tretten with almost bare roads standard and NR 4/E6 Einavatn–Vingrom with bare road standard. Following the intention with the reduced requirements in the “almost bare roads” strategy, this will imply that the requirements are linked to bare in tracks and not bare road between the edge lines, which follows from the bare roads strategy. The requirements for preventive salting actions are in practice the same, i.e., the salt is not spared in the beginning but at the end of the precipitation period. The discursive point here is how easy it is to gain real bare road in the wheel tracks, or whether the new strategy leads to an increase in the time with slippery road in tracks compared to a bare road strategy. The results from the winter season 2005–2006 indicate that this is the case.
A greater amount of the time with slippery road in tracks will imply increased risk for traffic accidents, but it is not possible on the basis of the experiences from only one winter season to conclude that there in fact is a higher risk with the almost bare roads strategy compared to the bare road strategy. Several of the physical measures carried out on E6 will probably also counteract the consequences of a greater proportion of the condition slippery in tracks.
Trials with the fixed sand method (mixing hot water and sand) have shown that this sanding method is an effective alternative when the temperature is too low to use salt (sodium chloride), i.e., when the road is operated according to a winter road strategy (2). Figure 4 shows an example with use of fixed sand on E6 on the four-lane road section. Results from friction measurements before and after spreading warm wetted sand are shown in Figure 5.
FIGURE 4 Fixed sand (warm wetted sand) spreading on E6, January 3, 2006.
1
0,9 Before After After 1 h
0,8 After 2 h After 3 timer After 4 h
Coefficien t of frictio n 0,7 0,6 0,5 0,4 0,3 0,2 0,1 0
Lane 1 Lane 2 Lane 3 Lane 4
FIGURE 5 Results from friction measurements after fixed sand spreading on E6 road section with four lanes, January 3, 2006.
Even on a high traffic road such as E6, it seems that a fixed sand measure has so long duration that it is sufficient with 1–4 measures per day. To gain more experience with the fixed sand method on roads like E6 around Lillehammer, it would be desirable to study more periods with cold weather with fixed sand used as an ordinary measure.
The main impression is that during a snowfall it is difficult to keep the friction standard requirements on the four-lane road at Hunder on the lanes with least traffic, i.e., the lanes nearest the central reserve. It also seems to be difficult to maintain good driving conditions during greater snowfall in spite of relatively extensive salting.
In general the strewing actions seem to be carried out in accordance with the contract regulations, including in the cases when the road is operated using a winter road strategy. It would however have been of interest to follow up new precipitation cases to look more
thoroughly into the extent of salting during snowfall with regards to both dosage and frequency of salting actions.
Decision Support and Follow-Up System
The contractor has access to several sources for road wheather information as a support for their decisions, in terms of both prognosis and actual situation:
• Weather forecast (Meteogram) (prognosis), • Weather radar (actual situation), and
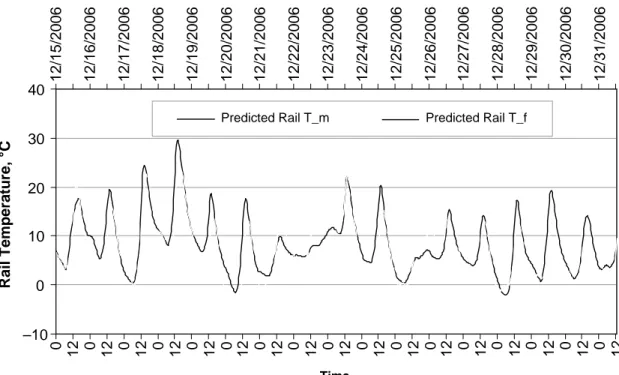
• Climate stations, roadway weather information system (RWIS) (actual situation). Figure 6 show an example of how the 3-day weather forecast looks like. The comparisons made between the weather forecast for Øyer and the RWIS station at Fåberg, show that there are some divergences (see Figure 7).
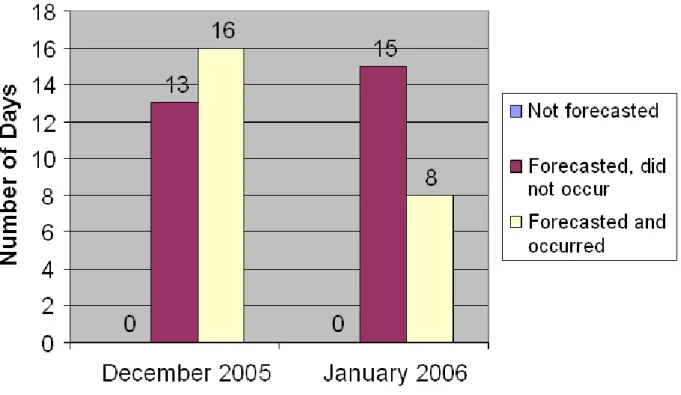
FIGURE 7 Number of days with precipitation in the Lillehammer area in December 2005 and January 2006.
For example, in December 2005 it was predicted there would be precipitation in 29 days, while precipitation was registered only in 16 days with a Tipping Bucket (precipitation
measurement device). In January 2006 the weather forecast predicted 23 days of precipitation, while the actual number of days with precipitation was only 8 days with a Tipping Bucket. If one takes into account precipitation registered by Optic Eye (based on light beams) on days the Tipping Bucket did not detect precipitation, it was 9 days in December and 8 days in January with predicted precipitation, no precipitation was registered either by Tipping Bucket or by Optic Eye. All days with precipitation the weather forecast predicted rainfall or snowfall, i.e., there was no precipitation that was not predicted.
With the grid system the calculation models are based on and which is the basis for the generation of the weather forecast (Meteogram), one has to count on the fact that local conditions can diverge from the forecast. It is of course not sufficient to use only data from one RWIS station to assess the reliability of the weather forecast in general. As a central tool in the decision support system there seems however to be a need for a closer look at the quality of the weather forecast by analyzing other geographical areas.
Regarding the RWIS station at Fåberg, this is an advanced climate station that has a doubling of several of the functions, among them measuring the amount of precipitation (Optic Eye and Tipping Bucket). Optic Eye seems to be less accurate in quantity compared to Tipping Bucket, and in some cases there seems to be registered precipitation during dry spells. This can be a problem when considering whether there is a need for an action or not. With more frequent cleaning it is possible that the accuracy of Optic Eye can be improved.
Experiences with Operational Routines and Plowing and Spreading Equipment
In the winter season 2005–2006 the contractor used the tandem principle on the main road passing by Lillehammer. The following equipment was used on this specific road section:
• Truck with spreader in front-mounted plow and side-mounted plow (see Figure 8). • Grader with front-mounted plow and plowshare (see Figure 9).
FIGURE 8 Truck with spreader in front-mounted plow and side-mounted plow.
On the r ing in tandem also for other reasons than because of the four-lane motorway on parts of the road section:
• Two-lane sections with central guardrail have evacuation passages. It is an advantage to plow these passages together with the roadway.
• Tandem driving makes it possible to plow ramps in crossings simultaneously with plowing of the main road.
• In broad crossing areas with painted canalization it is possible to plow the whole width in one operation by use of tandem.
In general driving in tandem is beneficial because the plowing action is finished earlier and a better standard on the road network and especially on ramps is achieved. One disadvantage for the contractor on a fixed price contract is that tandem driving leads to more kilometers of plowing.
Tandem is used during greater snow falls, the grader first and the truck behind. On two-lane sections normally only the front-mounted plow is being used on the grader. Normally the plowshare underneath the grader is used only when the snow is hard packed. The front-mounted plow on the truck places the snow to right edge and the side-mounted plow throws the snow over the snow bank or the guardrail. Thus most of the roadway on road sections with two lanes
normally is plowed both with the front-mounted plow on the grader and the front-mounted plow on the truck.
In crossings the truck is plowing the ramps, and the grader the section between the ramps. The grader plows to the end of the on-ramp and then turns into the off-ramp. Afterwards the grader is backing on the on-ramp to achieve continuous plowing. Here the grader is waiting till the truck has finished the plowing of the ramps.
The share on the grader does not throw the snow like the side-mounted plow on the truck. No and then it is therefore necessary that the truck plows the section between the off-ramp and the on-ramp in crossing areas to get the snow thrown over the snow bank or the guardrail.
Both the plow and the plowshare beneath the grader are used on sections with 4-lane roadway. On the truck the front mounted plow places the snow out to the edge and the side mounted plow throws the snow over the snow bank and guardrail. When salting during the plowing action, the side mounted plow is used in full width to spread a sufficient amount of salt into the left lane.
The grader is driving with the front-mounted plow on the left side of the center line on ordinary two-lane roads. The area around the center line is thereby plowed twice. The truck coming behind the grader uses both the front-mounted and the side-mounted plow. The experience shows that the driving speed should not exceed 35 km/h to get a good result.
The same plowing principle is used on a two-lane road with central reserve with rumble strips as on an ordinary two-lane road. When plowing on the rumble strips the truck is shaking and produces more noise than on an even roadway. This is the reason why the speed should not exceed 35 km/h. More snow and slush are left in the rumble strip area than on the rest of the roadway. There are more spurts under slush conditions when the vehicle drives on the rumble strip area than on other parts of the roadway. There is very little wear on the profiled center line when it is combined with rumble strips.
In T-crossings with broad painted canalization there is a need for tandem driving in order to plow in the full width. Some extra wear is noted on the painted canalization in such areas.
The normal procedure is that salting takes place at the same time as the plowing action down to –8ºC. The experience so far is that it is possible to avoid snow and ice packed layer on the roadway by using salt at such low temperatures. With the former strategy it was necessary to do
aintaining sufficient level of friction during reater problem that snow around 0ºC.
e important to adjust the height exactly during plowing. the ground pressure on the plow becomes too heavy, there is a possibility that the driver can lose the stee
w and ice on short road sections and along the edge. Thereby the standard requirement is achie
arizes the accident statistics from 1995 and during the project period.
s ombination of physical central reservation with crush b
on part of the Vision Zero project has given important knowledge regarding local op
a winter to a bare roa
ad accordance with regulations in the contract, with prevent
ut some grading to get rid of the snow sole. One disadvantage by using salt at low temperatures is that the friction can become low and it can be a problem m
and after the snow fall at such low temperatures. With regards to friction, snowfall at low temperatures is therefore a g
One disadvantage in using the grader is that the ground pressure on the front shaft is too low to balance the front plow. It is therefor
If
ring of the grader.
On the other hand one advantage with the grader instead of the truck is that the grader is easier to maneuver. Furthermore it is easier to utilize the share on the grader to remove hard-packed sno
ved faster and the action is finished earlier when one of the units in a tandem operation is a grader. The normal situation will however still be to use two trucks instead of one grader and one truck.
Accident Situation
Table 2 summ
In the 3-year period 2003–2005 eight accidents with personal injury were reported on those parts of E6 included in the Vision Zero road section. In average this corresponds to 2.7 accident per year. For comparison there were 8.2 accidents per year in the 8-year period 1995–2002.
From the accident pattern it seems that a c
arriers and reinforced winter maintenance has been the measure with the greatest influence on serious accidents. By introducing different measures at the same time it is however difficult to isolate the effects from a single measure.
CONCLUSIONS
The winter operati
eration of the Vision Zero road network, but has also lightened up situations of national importance. The more general experience is especially valid for the importance of good
mechanical cleaning of the roadway to reduce the salt consumption. The “theory” of using road strategy when it is to cold to use salt has been confirmed to be an effective alternative
d strategy.
When it comes to an almost bare road strategy, this has been a successful strategy with regard to salt consumption. It is however uncertain what consequences reduced salting compared to a bare road strategy will have on traffic safety. From the increased proportion of a slippery ro condition in tracks with the almost bare road strategy compared to a full bare road strategy, from known risk figures a certain increase in the number of traffic accidents.
The salting is by and large done in
ive salting, salting during snowfall and then salting right after snowfall has stopped. However in some cases a too great an amount of salt has been used during the snowfall witho
TABLE 2 Number of Accidents Before and During the Project Period
Type of Accident per Year 1995–2002 2003–2005
Accidents with personal injury 8.2 2.7
Accidents with serious personal injury 2.3 0.7 (before crash barriers were mounted)
Meeting accidents 1.4 0.7 (before crash barriers were mounted)
at Hunder is a challenge regarding keeping driving conditions as good as on th
te truck for each method. However, with good weather forecasts it should be possible to ut up efficient operational routines based on using the same truck for both methods.
friction measurements have come into focus by the fact that different easuring devices on certain road conditions can give great deviations in measured coefficient
regards to what is
that this not
cing different measures at the same time it is however ifficult to isolate the effects from a single measure.
CKNOWLEDGMENTS
or d as a
r
E-getting the expected results. It is therefore necessary to look more into the routines of salting during falling snow.
The four-lane road
e adjacent two-lane road sections. Further investigations should be conducted to see to what extent this is a local problem or a more general problem for four-lane roads.
When it comes to a winter road strategy and using sand for friction improvement, this will of course imply extra effort for the contractor to shift the method from salting to sanding. This can explain why fixed sand is used to so little extent, and it would have been desirable with a separa
p
Methods for m
of friction. It is also a question whether the standard requirement is reasonable with
realistic to achieve with friction improvement actions. In the almost bare road strategy it is possible that the time for reaching a certain road condition should be increased a bit to reduce the salt consumption during snowfall. The results from studies made in the project indicate
necessarily will lead to poorer driving conditions.
From the accident pattern it seems that a combination with physical central reservation with crush barriers and reinforced winter maintenance has been the measure with the greatest influence on serious accidents. By introdu
d
A
The Public Roads Administration of the Road Directorate in Trondheim has been responsible f carrying out the project. In addition there was established a project group that functione
technical advisory group for the planning and conduct of the project. Both the local road administration and the contractor contributed actively in the project team.
REFERENCES
1. Giaver, T., T. Lindland, and T. Vaa. Winter Operations–TS Lillehammer. SINTEF Report A06089. December 2006.
2. Vaa, T. Implementation of New Sanding Method in Norway. Transportation Research Circula
C063: Proceedings of the Sixth International Symposium on Snow Removal and Ice Control
Technology, Transportation Research Board of the National Academies, Washington, D.C., 2004, pp.