. Nr 386A e 1993
Objectives for the average
| fuel consumption of new
passenger cars Henrik Jonsson %
VTI rapport
Nr 386A 0 1993
Objectives for the average
fuel consumption of new
passenger cars
Henrik Jensson
«I»
Pub/ism
P °a"°"-'VT1 RAPPORT 386A
Published: Project. code:
1993 75339-2 (80022)
Swedish Roadand
-
Project:
Reasonable objectives for the
'Transpm383981311 [031111119
average fuel consumption ofnew
8-581 95 Linko'ping Sweden passenger cars
Author: Sponsor!
Henrik Jonsson The National Board for Consumer Policies
Tit/e:
Objectives for the average fuel consumption of new passenger cars
Abstract.(background,aims, methods, results) max 200 words:
In connection with the winding-up of the Board ofTransport, from July 7, 1991 , the National Board for Consumer Policies was commissioned to cover the deve10pment in fuel consumption of new passenger cars and was also made responsible for negotiations with passenger car suppliers concerning the limitation of fuel consumption (Government decision, June 20, 1991).
The aim ofthe report is to prepare abasis for the National Board for ConsumerPolicies comprising: - analyses of the existing supply of new cars,
- potential technical development up to the year 2005,
- different technical scenarios concerning reasonable changes in the characteristics of new passenger cars, including the use of alternative fuels and electric power,
- different alternatives concerning the renewal of the car eet (sale of new passenger cars and scrapping rate).
The carbon dioxide emissions from passenger car traf c should be compared with the goal set up by Parliament, i.e. not to exceed the 1990 level in the year 2000, and the goal of the National Environment Protection Board (SNV), a reduction of 20 % by the year 2005.
The data base ofthe National Board for Consumer Policies, containing fuel data for mixed driving and vehicle description data, is used for analyses and declarations of how fuel consumption is in uenced by:
- service weight,
the ratio between engine power and service weight, - type of gearbox,
- model year, - make of car.
All other factors being equal, technical development admits the ef ciency enhancement of fuel consumption by 1.9 % annually. The actual reduction is scarcely 0.9 % annually, from 0.93 to 0.83 litres per ten kilometres because of increased service weight and power/weight gures.
The two lower growth alternatives (low and intermediate) result in CO2 emissions within the goal limits for all technical scenarios in the year 2000. The goal set up by the Swedish National Environment Protection Board concerning 2005, on the other hand, will only be met in the low growth alternative in certain technical scenarios.
FOREWORD
This report commissioned by The Swedish Board of Consumer Policies (KOV). Considerable assistance was provided by:
_ Ulf Hammarstrom, VTI, through many discussions on relevant problems. _ Dennis Nordberg and Bjorn Hagberg, The Swedish Board of Consumer
Policies, who provided valuable feedback on all aspects of the contents.
__ Lennart Erlandsson, the Swedish Motor Vehicle Inspectorate, contributed with expertise regarding testing methodology and exhaust emissions.
CONTENTS Page SUMMARY I 1 INTRODUCTION 1 2 HISTORY 4 3 CURRENT STATUS 8 4 FUTURE STATUS 12 5 ANALYSIS OF THE NEW VEHICLE FLEET 14 5.1 Service weight 15 5.2 Engine 15 5.3 Transmission 17 5.4 Model year 18 5.5 Other engines of potential future interest 19 5.6 Alternative fuels 20 5.7 The future, choice of fuel and Swedish car manufacturers 23 6 TEST METHODOLOGY FOR FUEL CONSUMPTION
AND EXHAUST EMISSIONS 25 7 THE CONNECTION BETWEEN CAR-RELATED
DATA AND FUEL CONSUMPTION 30 7.1 Analysis of vehicle data for model years 1978-1992 30 7.2 Analysis of vehicle data for model year 1992 35 7.3 Analysis of vehicle data for model years 1978-1992
for the 10 best-selling car makes in 1992 37 8 SOME FUTURE SCENARIOS 40 8.1 Reduction in energy consumption: Short term 41 8.2 Reduction in energy consumption: Medium term,
up to the year 2020 42 8.3 Development potential 44 8.4 Various technological scenarios 45 8.5 Data and forecasts for car sales, mileage and scrapping 46 8.6 Results for the years 2000 and 2005 respectively 55 9 CONCLUSIONS 61 10 BIBLIOGRAPHY 69
APPENDICES: Appendix 1. Appendix 2. Appendix 3. Appendix 4.
VTI RAPPORT 386A
Project description as per the assignment from The Swedish Board of Consumer Policies Factors affecting fuel consumption in practice
Discrepancies between theoretical values and the fuel folder gures in regression analysis, all car makes Discrepancies between theoretical values and the fuel folder figures in regression analysis for the ten best-selling makes, 1992
OBJECTIVES FOR THE AVERAGE FUEL CONSUMPTION OF NEW PASSENGER CARS
by Henrik Jonsson
Swedish Road Transport Research Institute (VTI) S-581 95 LINKOPING Sweden
SUMMARY Background
In 1975, the National Board for Consumer Policies (KOV) was commissioned to elucidate the structure of private consumption and energy consumption in society. The background was the rst "oil crisis" in the 70's. The result was a recommen-dation of standardised information concerning the fuel consumption of new cars. This information, which according to the policies of the KOV (KOVFS 1988: 1) is demanded for nearly all marketing of new passenger cars, is also distributed to consumers in the form of fuel folders reporting not only fuel consumption values but also important data on the year's car models. Fuel consumption in mixed driving (urban and highway driving) is measured in the laboratory according to a standardised measurement procedure.
With the aim of reducing energy consumption in Sweden, the Govemment commissioned the Board of Transport (TPR) of that time to try to in uence the energy consumption of passenger cars through negotiations with car suppliers. The result of the TPR efforts was the current agreement between the Motor Industry Association on the one hand and the TPR on the other hand concerning the average fuel consumption of new passenger cars in mixed driving, specifying that the average fuel consumption in mixed driving should be 0.85 litres per ten kilo-metres at a maximum as from the 1985 models of newly registered passenger cars. In connection with the winding-up of the Board of Transport, from July 7, 1991, the National Board for Consumer Policies was commissioned to cover the development of new passenger cars and was also made responsible for negotiations with passenger car suppliers concerning the limitation of fuel consumption (Government decision, June 20, 1991).
II
During the last few years, the previous annual reduction of fuel consumption has stagnated and even started to increase, see Table 1. The explanations will probably be found in :
- A reduction of the number of diesel cars, above all for tax reasons.
- A considerable proportion, almost 50 per cent, of all newly registered cars are so-called company cars, which means that for tax reasons there is no incitement for the user to choose fuel economical cars. These company cars are mainly chosen from the heavier cars (service weight above 1,200 kg).
- Cars are becoming heavier and thus consume more fuel as a result of safety demands.
- The relative price of fuel has been falling during the period 1978-1989.
Table 1 The weighted average fuel consumption of passenger cars in mixed driving
|1978 1979 1980 1981 1982 1983 1984 1985 1986 1987 1988 1989 1990 1991 1992 I093 0.92 0.90 0.87 0.86 0.86 0.85 0.85 0.84 0.82 0.82 0.82 0.83 0.83 0.82
Aim
The task was to compile a basis conceming the fuel consumption of new passenger cars to be used in the negotiations between the KOV and the suppliers of new passenger cars. The negotiations aim at the determination of goals for the average fuel consumption of new cars. In parallel with producing this basis, the emission levels of carbon dioxide will be calculated for passenger car traf c. The forecast discharge level for the year 2000 should be compared with the goal set up by Parliament, i.e. carbon dioxide discharges must not exceed the 1990 level. Furthermore, the 2005 level should be compared with the 1990 level in order to nd out whether the goal of reduced carbon dioxide discharges set up by the National Environment Protection Board can be realised. The basis should comprise the following:
- analyses of the existing supply of new cars,
- potential technical development up to the year 2005,
- different scenarios concerning reasonable changes in the characteristics of new passenger cars,
- different scenarios concerning the renewal of the car eet (sale of new passenger cars and scrapping rate).
Method
The National Board for Consumer Policies has developed a data base containing fuel data (for driving on main roads and in towns as well as mixed driving) and descriptive vehicle data. This data base is used for analysing e.g., how fuel consumption is in uenced by the factors: 1) service weight, 2) engine power/service weight, 3) type of gearbox, 4) model year and 5) make of car.
In the analyses, the model year will represent a group of characteristics such as engine ef ciency, air resistance, rolling resistance etc. and the development of these characteristics over time. Through de nition of different technical scenarios for future development, based on the analyses, the average fuel consumption can be rated for new passenger cars. Through literature studies and contact with the car industry such changes are surveyed that are suf ciently developed for production or where there is no doubt that they will be introduced in the 90's. Three economic growth scenarios are based on long-term economic forecast from 1992 and the VTI's revised traf c prognosis up to the year 2020, where the intermediate scenario is regarded as the expected development.
Basic data
The development of cars over the period has been analysed by means of vehicle data from the KOV's fuel folders from the years 1978, 1980, 1984, 1988, 1990 and 1992. Data concerning fuel consumption in mixed driving, service weight, engine power, transmission, model year and make of car were used to describe existing
relations.
In order to estimate the total fuel consumption of the car eet, there is a need for information concerning 1) annual driving distances for different models [in tens of km], 2) the number of cars in traf c of different models and 3) speci c consump-tion for cars of different models [litre/ten km].
From these supplementary data, the total fuel consumption of a model is calculated by the multiplication:
driving distance* number of cars * specific fuel consumption
The values obtained for each model are added, resulting in a totalled fuel consumption for the whole car eet.
IV
The annual driving distances and the scrapping rate for old cars (assumed to have been the same as during the years 1956-1990), respectively, used for the calcula-tions in this report, are illustrated in Figures 1 and 2.
25000 20000 15000 10000 An nua l dr ivi ng di st an ce (k m) 5000 12 3 4 5 6 7 8 910H121314151617181920212223242526272829303132333435 Age otcartyears) 0
Figure 1 Annual dn'ving distances for cars of different ages according to investi-gations carried out by the VTI. Driving distances for 17 to 25 year-old cars have been assigned successively decreasing standard Values down to 4000 km/year and even older cars have been assigned the value 4000 kin/year. 100.0 90.0 -80.0 ~ 70.0 60.0 50.0 40.0 -30.0 -* 20.0 10.0 -Pe rc en ta ge re ma in in g ca rs In to da y' s ve hi cl e e et of va ri ous ag es (1 ) 0.0
"N
°
°9=993922228888§38888888838
Age of car (years)
Figu_re 2 Number of remaining cars of different ages in the car eet for the last 35 years, according to "Motoring in Sweden".
Using the Swedish Road and Transport Research Institute s forecast as a basis, three different growth scenarios (low, intermediate and high) are generated. The sale of new cars is illustrated in Figure 3,
New car sales 450000 * - High AOWO + Informed. 350000 I Low + Sales 300(200 250(130 Average 200CDO lSCIDO lOOCDO 500(1) 1955 1970 1975 1930 1985 1990 1995 2000 2005 MOdEIYer Figur_e 3 Illustration of the development of the sale of new cars during the
period 1965-1992 and three different future scenarios: Low, Inter-mediate and High growth. The continuous lines show the average sale of new cars and the trend during the period 1965-1992, respectively. The high value of the 1988 model is due to the fact that the 1989 model was in many cases sold as the 1988b model because of exhaust regulations.
Results
The analysis of the technical development of cars and the factors in uencing fuel consumption resulted in a model that can be described schematically as follows: Fuel consumption:
(1 + weight factor* service weight)*(1 +powerfactor * engine power/(service weight/100)) *(1 +5-gearbox factor + automatic gearbox factor)*(1 + make ofcarfactor)* (constantfactor + model year factor) (I) Fuel consumption is expressed in litres per ten kilometres, service weight in kg and engine power in kW. The different factors in Equation (1) were decided by means of a non-linear regression model. The occurrence of the factors 5-gearbox factor and automatic gearbox factor depends on whether a certain model is equipped with a 5- speed manual gearbox or an automatic gearbox (at least one of the
VI
factors is equal to 0). For a car with four gears, both factors are equal to 0. The make of car factor was included to describe how the levels of fuel consumption of certain makes deviate systematically from the average car on the market. The constant factor is included in order to determine a standard level for the whole Equation (1) concerning the 1978 car models. This standard level is then adjusted by means of the model year factor, which is decided for cars of different models (cars of the 1988 model, for example, have one speci c factor, while those of 1992 have another). The model year factor is the same for all cars of a certain model year.
Table 2 illustrates how the weight and power factors in uence fuel consumption (when all other factors are the same). The table values (1 +weight factor*service weight)*(1 +power factor * engine power/(service weight/100)) from Equation (1), are standardised on the basis of service weight 1,300 kg and engine power 90 kW. By comparing two table values, x and y (x < y), the relative increase from x to y is obtained as y/xI and inversely the relative decrease from y to x is obtained as I -x/y. Example: A car having a service weight of 1,300 kg and a power of 100 kW has the table value 102. If the service weight is reduced by 100 kg and the power by 10 kW, the new table value is 95. The reduction in fuel consumption is then 1 -95/102 = 0.07 or 7 %.
Table 2 Blustration of how changes in weight and engine power in uence fuel consumption according to the produced relationship. The values are standardised from a car with a service weight of 1,300 kg and an engine power of 90 kW. Engine power [kW] Service weight [kg] 30 40 50 60 70 80 90 100 110 120 800 63 65 68 70 73 75 77 80 82 85 900 68 70 72 75 77 79 82 84 86 89 1000 73 75 77 79 82 84 86 88 91 93 1100 77 80 82 84 86 88 91 93 95 97 1200 82 84 87 89 91 93 95 97 100 102 1300 87 89 91 94 96 98 100 102 104 106 1400 92 94 96 98 101 103 105 107 109 111 1500 97 99 101 103 105 107 110 112 114 116 1600 102 104 106 108 110 112 114 116 118 120 The technical development for this car eet is re ected by the constant factor and the model year factors. All other factors being equal (service weight, engine
power/100 kg, gearbox, make of car), the ratio between model year factor and constant factor gives the relative development in fuel ef ciency during 2, 6, 10, 12 and 14 years, respectively. Distributed as an annual decrease in per cent, an improvement is obtained according to Table 3. The actual, realised reduction is scarcely 0.9 annually (from 0.93 to 0.83 in 713 years, according to Table 1, because of increased service weights and power/weight gures).
Table 3 Average annual ef ciency enhancement of the fuel consumption of a car with given service weight, engine power and gearbox, in per cent. Year Number of years from Annual development
base year 1978 in per cent [%] 1980 2 1.3 1984 6 2.0 1988 10 1.8 1990 12 1.9 1992 14 1.9
The corresponding analysis was also carried out for the ten most sold makes in 1992 (see Chapter 7.3). The annual technical development in per cent is approxi-mately 1.6 % over a period of 14 years, compared to 1.9 % in Table 3, for all models on the market. This may depend on the fact that the large makes on the Swedish market, e.g. the domestic makes, are emphasised even more in this model than in the one comprising all makes and that the large makes have been less successful in manufacturing/marketing cars with low fuel consumption than the average manufacturer on the market.
From a literature survey and data analysis, the conclusion can be drawn that there are technical, economic and environmental possibilities of reducing the average fuel consumption of new passenger cars considerably, compared to the present situation. Theoretical studies indicate that it will be possible to improve the degree of ef ciency of the Otto engine by approximately 10-15 %, while improvements to the transmission may give an enhancement of approximately 10 % and rolling and air resistance may be reduced further. All other factors unchanged, the choice of vehicles with lower weight and lower speci c engine power (kW/kg) than today, among both manufacturers and consumers, may give considerable reductions in average fuel consumption.
Fue l co ns um pt io n (l it re s/ 10 km )
The effects of the fuel consumption of all cars were studied in ve different techni-cal scenarios concerning the fuel consumption of new cars (illustrations in Figure 4):
Scenario No. Prerequisite
Fuel consumption as today1992-2005
Reduced fuel consumption by 0.9 % annually Reduced consumption by 1.7 % annually
Present consumption for every other car, 0.5 litres/ten km for the others from 1994
Reduced fuel consumption by 3.1 % annually.
h
W
N
r
t
Besides these scenarios, the possibility of using a 20 % mixture of ethanol based on biomass in the fuel for all cars from the 1995 model has been included as an
alter-native scenario for each of the ve scenarios mentioned above.
0.90 0.80 0.70 0.60 0'50 Scenario 1 0,40 Scenario2 0.30 " ' ' " Scenario?» ' " ScenarioA 0.20 ' " ScenarioS 0.10 0.00 1980 1985 1990 1995 20(1) Model year
Figure 4 Illustration of the development in speci c fuel consumption for new passenger cars (model by model)
Energy consumption, average energy consumption and C02 emissions for the whole car eet are calculated for the years 2000 and 2005, where annual driving distances (according to Figure 1), scrapping rate of old cars (according to Figure 2), pre-sold cars according to three growth alternatives (Figure 3) and different fuel consumption with and without ethanol mixture, respectively, according to five technical scenarios (Figure 4) are given.
VTI RAPPORT 386A
IX
As a complement to the ve scenarios, the effects conceming energy requirements and fuel consumption are also elucidated as a result of an introduction of electric cars on the market according to the "Califomia model", with an increase in the share of electric cars among new cars by one percentage point annually from 1996 up to 10 % in 2005.
The calculated C02 emissions in 2000 for the three growth alternatives meet the goals set up by Parliament according to Table 4 (change compared to 1990 in per cent, positive values state that the goal is not achieved). The relative changes in fuel consumption levels are just as large as the C02 emissions because of the proportionality between these (each litre of fuel gives 2.36 kg C02).
Table 4 Summary of existing changes in C02 emissions in per cent from 1990 to 2000.
Technical scenarios: Petrol Ethanol mixture of 20 % in petrol Year 2000 Seen. 1 Scen. 2 Seen. 3 Seen. 4 Seen. 5 Scen. 1 Scen. 2 Seen. 3 Seen. 4 Seen. 5
Growth scenario
Low -7.6 -10.0 -12.1 -17.6 15.6 ~14.5 -16.6 -l8.4 -23.2 -21.4 Average -1.2 -4.0 -6.3 -12.4 -10.2 -9.0 -11.3 -13.4 -18.7 -16.7
High 10.4 7.2 4.5 -2.6 0.0 1.4 -1.4 -3.7 -10.0 -7.6
The calculated C02 emissions in 2005 for the three growth altematives ful l the goal set up by the National Enviromnent Protection Board, i.e. a reduction of emission levels by 20 % from the level in 1990 according to Table 5 (change compared to 1990 in per cent, values in italics mean that the goal will not be
fulfilled).
Table 5 Summary of existing changes in C02 emissions in per cent from 1990 to 2005.
1..-Technical scenarios: Petrol Ethanol mixture of 20 % in petrol Year 2005 Seen. 1 Scen. 2 Seen. 3 Seen. 4 Seen. 5 Scen. 1 Scen. 2 Seen. 3 Seen. 4 Seen. 5 Growth scenario
Low -6.4 -12.0 -16.6 -21.5 -24.0 -17.4 -22.2 -26.1 -30.4 -32.4 Average 4.4 -2.0 -7.3 -12.9 -15 .8 -8.1 -13.6 -18.1 -22.9 -25.3 High 19.7 12.2 6.0 -0.4 -3 .8 5.1 -1.3 -6.5 -12.1 -14.9
Ethanol mixture of 20 % in petrol + Electric car introduction Low -20.9 -25.4 -29.1 -33.2 -35.0 Average -12.2 -I 7.3 -21.5 -26.2 -28.3 High 0.4 -5.6 -10.5 -16.0 -18.3
One aspect that has not been taken into consideration in this analysis is that the reduced cost for passenger car transports, a result of reduced fuel consumption levels, everything else being the same, will lead to an increase in passenger car mileage. This means that the demands on a reduction of fuel consumption should be even higher than what is required to ful l the goals without a margin. The alter-native is to ascertain that vehicle mileage does not increase, e.g., by using other measures such as C02 charges for fuel.
The C02 emissions are directly proportional to the use of fossil fuel. The substitu-tion of fossil fuel by fuel based on biomass reduces C02 emissions provided that the amount offossil fuel used in cultivation, production and distribution of biofuel is less than 100 % (of the energy content at the end use of the vehicle). In a future where many alternative fuels and energy carriers (methanol, ethanol, natural gas, biogas, hydrogen, electricity, etc.) will be used, on the one hand produced with a large or small amount of fossil fuel and on the other hand used in various combina-tions in hybrid cars, it will be much more complicated than today to provide fuel declarations for passenger cars. These problems and "suggestions for solutions" are reported in Chapter 9.
1 INTRODUCTION
The Swedish Board of Consumer Policies (KOV) will undertake negotiations with car manufacturers regarding reductions in the fuel consumption of new cars. The previous target for 1985 was 0.85 litres/10 km in the mixed driving cycle. This fuel consumption figure was achieved in accordance with the guidelines for information about new car fuel consumption as stated in KOV's statute book (KOVFS 1988: 1). The negotiations were undertaken between the then-current Board of Transport and the car suppliers. The background is best described by the Swedish Board of Consumer Policies [1991]:
Based on the guidelines for passenger car fuel consumption as rati ed by parliament (Government bill 1978/7999, TU 1978/79:18,rskr 1978/79s419) the government issued a 1979 declaration authorising the Board of Transport (TPR) to monitor the development of new-car fuel consumption and to try to in uence fuel consumption through negotiation (Government decision 1980-02-07).
The assignment included the following:
- to monitor developments in average fuel consumptionfor passenger cars. - to negotiate with car suppliers with the aim of reaching an agreement whereby
the total weighted average fuel consumption for new cars in Sweden, model year 1985, would not exceed 0.85 litres/10 km.
- to investigate the possibility of reaching agreement on a further reduction in fuel consumption for new cars up to the year 1990 in accordance with the parliamentary decision.
As the TPR s operations were wound down, the Swedish Board of Consumer Policies (KOV) was authorised on 1991-07-01 to monitor developments in the fuel consumption of new cars and to undertake negotiations with car suppliers
regarding a reduction in fuel consumption (Government decision 1991-06-20). The assignment given to VTI by the Swedish Board of Consumer Policies, see Appendix 1, relates to analysis of future trends in fuel consumption in the mixed driving cycle, measured as per the specific operating conditions described above. Fuel consumption in everyday driving depends on a number of different factors, and may therefore differ widely from the gures for mixed driving stated in the norms of the Swedish Board of Consumer Policies. It is worth emphasising that
all standardised fuel consumption measurement methods offer discrepancies in
individual cases, but according to the extensive car-maintenance surveys undertaken by the Swedish Board of Consumer Policies, the average consumption in the mixed driving cycle closely matches the figures stated by the car owners. A summary of factors in uencing fuel consumption is presented in Appendix 2.
Documentation will be compiled for use in negotiations which will take place between KOV and new car suppliers. This documentation should cover the following:
- various scenarios regarding reasonable changes in new-car characteristics - analyses of the current range of cars
- expected technological advances leading up to the year 2005.
The Swedish Board of Consumer Policies has created a database containing fuel consumption gures (for highway, urban and mixed cycle driving) and vehicle description data. This database can be utilised for analysis of how fuel consumption is affected by the following factors:
service weight
- engine power/service weight - type of gearbox
- model year - type of fuel - make of car.
In these analyses, the model year represents a group of properties such as the engine's ef ciency rating, air resistance, rolling resistance etc., and developments in these areas over a period of time. The definition of various scenarios for trends in these properties over a period of time allows us to assess average fuel consumption figures. One starting-point for these scenarios may be the fuel consumption gures for 1992 models, where cars with the lowest fuel consumption offer a figure of just 0.5 litres/10 km. In parallel with these developments, information is required about the number of cars from each model year in the total vehicle eet, and the average annual mileage.
Technical advances represented by model years are expected to bring about a certain reduction in fuel consumption, all else being equal. Analysis of new studies and contacts with the car manufacturing industry and researchers allows us to identify which changes are sufficiently developed for series production and which changes we can expect to see implemented during the '90s.
The average fuel consumption for various scenarios is presented, firstly for three altemative economic growth situations, and secondly for ve different development alternatives regarding specific fuel Consumption. The speci c fuel consumption per year up to the year 2005 is shown for each technological scenario. The total energy consumption levels and the specific fuel consumption figures forthe entire vehicle eet are shown for 1990, 2000 and 2005 in all cases. The energy consumption levels state the total energy consumption in TWh (including both fossil fuels and renewable fuels), while speci c fuel consumption is given as the equivalent quantity of petrol per 10 km, in other words the amount of fossil-based energy.
2 HISTORY
This historical review is obtained from TPR report 1990:1 (pp 5-7).
The transport industry s environmental objectives are stated in proposition 1987/88z85, JoU 23, rskr. 373. The overall aim is that operations affecting the environment be modified to suit the limits set by man and nature. The following sub-objectives and activities relating to passenger cars were set up to ensure the achievement of these objectives:
- Swedish emissions of nitrogen oxides shall be reduced by 30 % up to 1995,
based on the 1980 level. Various methods of halving this gure by the year 2000 will be studied. Carbon dioxide emissions in 2000 should not exceed the 1988 level.
- proposals for quality standards for diesel fuel to be produced
- the possibility of further emission reductions should be studied, among other things by examining the consequences of the requirements stated for California.
The transport industry's energy objectives are specified in: 1. Traffic policy proposition 1978/79:99
2. Energy policy proposition 1980/8 1 :90 3. Traffic policy proposition 1987/8850.
The transport industry's aims were revised between propositions 1 and 2 above. A consumption of 80-85 TWh was expected for 1985, and about 85 TWh for 1990. This gave an average annual increase of between 0 and 1 % in the period
1979-1985 and 0.6 % in the period 1979-1990.
The general assessment was that it would be possible to reduce passenger car fuel consumption during the '80s while the goods transport sector was less easy to in uence owing to its ties to national economic trends. One objective was to reduce oil's share of overall energy supply to about 40 %. Proposition 3 above showed the following assessments:
i) Energy consumption for new vehicles should gradually drop.
ii) In the long-term, the transport system should aim for a reduction in energy consumption, reduced dependence on oil and a gradual transfer to alternative fuels and power systems, which in the longer perspective can be based on domestically renewable raw materials/energy sources.
The passenger transport market expanded extremely rapidly during the '50s and '60s, particularly in the passenger car sector which showed a steady growth through to the mid-'70s. The situation then becomes slightly less clear-cut, but total domestic transport has nonetheless increased by 50 % since 1970. Expressed in kilometres per person per year, this corresponds to a leap from 8000 km to 12500 km. Passenger cars have always accounted for about 75 % of the transport market, while public transport has increased from 17 to 20 %. This was brought about by a gradual shift to public transport from pedestrian and cycle traf c. In the 5-year period from 1985 to 1990, the price of petrol dropped to the 1974 level in real terms, while incomes rose by 2-3 % per year. This favourable economic trend allied to excellent terms for loans led to an expansion in car ownership by about 3 % per year.
Between 1978 and 1989, the weighted average fuel consumption of new cars in the mixed driving cycle dropped from 0.93 litres/10 km to 0.82 litres/10 km, but this trend was broken in 1990 when consumption rose to 0.83 litres/10 km (KOV 1991). This was because the proportion of larger, heavier and more powerful cars sold in Sweden increased, partly owing to lower fuel prices in real terms and partly owing to a large proportion of company cars figuring in new-car sales (company cars generally account for a larger proportion of large-car sales). Cars became heavier because of their increase in size and because of their more powerful engines, with the accompanying demands this places on dimensioning of structural components, suspension etc., and also owing to increased comfort-enhancing features such as improved insulation, power steering, power windows, sunroofs etc. Other reasons for this increase in weight are requirements concerning headlamp wipers (approx. 10 kg) and better crash protection. A study by Johansson [1992] expresses the situation as follows: The average passenger car sold in Sweden between 1970 and 1990 has become 40 % more power il, 18 % more economical, 8 % heavier and 26 % more expensive (in real terms). An example of this trend can be seen in two cars which were a common sight on Swedish roads in 1980 and 1990, Table 1 (the data is obtained from KOV's fuel folders). As can be seen, both service weight and specific engine power have increased considerably during this 10-year period.
Table 1 Example of development with regard to service weight and speci c engine power.
Model Car model Service wt. Engine power Specific Wt. increase Increase year engine power 1980-1990 spec. power
[kg]
[kW]
[kW/100 kg]
[%]
[%]
1980 Volvo 240 DL 1310 75 5.73 - -1990 Volvo 740 GL 1370 85 6.20 4.5 8.2 1980 Saab 900 GL 1260 73 5.79 - -1990 Saab 9000 i16 1400 96 6.86 11.1 18.5 Fuel consumption for the transport sector (goods and passenger traffic) constituted 58 % of total oil consumption in 1990 (Source: TPR, 1990e). A comparison with the 1989 figure by Schipper [1992] gives basically the same result. Total oil consumption in Sweden amounted to 126 TWh, of a total energy consumption of 352 TWh. With 15 % of total energy consumption for passenger transport and 6 % for goods transport, this amounts to approx. 74 TWh, which is just over 58 % of total oil energy consumption. However, this does not take into account electricity generated by hydro-electric and nuclear stations and used for trains, the underground rail system and trams.
A government decision taken on 1990-03-29 authorised TPR to work together with the National Energy Commission, the National Environment Protection Board (SNV) and the relevant traffic commissions to produce a strategy including guidelines and measures for ongoing reduction in energy consumption (see TPR [1990e, page 11]). The aim of this project was to provide suggestions for ways of reducing energy consumption and carbon dioxide emissions within the transport sector through distribution of transportation between different systems, fuel ef ciency and the utilisation of different fuels. Needs, pre-conditions and suggestions for increased use of domestic, renewable fuels will be detailed. The 1988 traffic policy decision is re ected in two objectives for fuel consumption, namely i) and ii) above.
Developments so far, with a transportation growth rate of about 5 % annually in recent years, indicates difficulty in meeting these targets.
In 1975, the Swedish Board of Consumer Policies was asked by the Government to examine the structure of private consumption and overall energy consumption. The background to this was the first oil crisis in the 'seventies. The result was a proposal for standardised information about the fuel consumption of new cars.
This developed as follows, see the report of the Swedish Board of Consumer Policies [1992, page 2]:
Against the background of the government request and with the support of marketing legislation, KOV launched negotiations with the Motor Industry Association (MIA) regarding the way in which information about the fuel consumption of new cars was to be structured in subsequent marketing and the measurement methods to be used so as to ensure a uniform comparative system. These negotiations resulted in KOV producing guidelines for information about new car fuel consumption (KOVFS 1 977:2). The guidelines were subsequently revised on two occasions (1979 and 1988) and are integrated in the most recent version of KOV s statutes under the designation KOVFS 1988:].
The job of negotiating with the Motor Industry Association later went to the then-current Board of Transport (TPR) which represented the government. The result is the still-valid agreement on new-car fuel consumption for mixed cycle driving between MIA on the one hand and the TPR on the other, which stipulates that the average fuel consumption in mixed driving, according to KOV's guidelines, shall be max. 0.85 litres/10 km as of the 1985 model year, for all newly-registered passenger cars.
3 CURRENT STATUS
The current status of passenger car fuel consumption is described by the Swedish Board of Consumer Policies [1991]. TPR has since been wound up and the task of negotiating with the motor industry on reductions in the fuel consumption of new cars is now the province of the Swedish Board of Consumer Policies (KOV). According to KOV [1991] the target for 1985 has been met with a weighted consumption for new cars as in Table 2. The fuel consumption gures have been obtained in a chassis dynarnometer (a "rolling road") simulating two driving cycles for urban and highway driving. The results of these two cycles are weighted together to produce a value for the mixed cycle, in the ratio of 55 and 45 % respectively. Over the past few years, the previous annual reduction in fuel consumption stagnated and eventually even turned into a slight increase. The explanations are probably to be found below:
- A smaller proportion of diesel cars, principally for taxation reasons.
- A large proportion, almost 50 % of all newly registered cars are company cars, where the car user has little incentive to choose energy efficient models. Company cars are found mainly in the heavier segment (service weight above
1200 kg).
- Safety requirements mean that cars become heavier and therefore consume more fuel.
The price of petrol dropped in real terms in the period 1978-1989.
Table 2 Weighted average fuel consumption of passenger cars in mixed driving. 1978 1979 1980 1981 1982 1983 1984 1985 1986 1987 a 1988 1989 1990 1991 1992 0.93 0.92 0.90 0.87 0.86 0.86 0.85 0.85 0.84 0.82 0.82 0.82 0.83 0.83 0.82
The objective mentioned in chapter 2 - a signi cant reduction in nitrogen oxide emissions from the transport sector, will be achieved through the implementation of catalytic converters for cars sold in Sweden, provided any future developments in the EC do not curtail developments in that direction.
Important factors affecting fuel consumption on the road, but which are not included in KOV's fuel consumption gures (see also Appendix 2):
- other driving behaviour than that included in the driving cycles at the time of the test
- differing loads in the vehicles - the use of loaded roof-racks
- traffic enviromnent and road surface - amount of surface water on the road - the use of studded tyres
- winter road conditions.
There are considerable advantages to having a standardised test method which generally matches that of other countries. This is in fact probably essential if Sweden is to operate within the sphere of the EC (either within the frame of the EES or as a member of the EC). The car maintenance survey carried out regularly by the Swedish Board of Consumer Policies, the most recent in 1991, also suggests that fuel consumption gures closely match the information provided by car owners regarding their actual fuel consumption.
The driving cycles and other circumstances which are used in the test procedures which are regulated in immense detail for fixing the declared fuel consumption gures, are presented brie y in chapter 6. However, the test system is not entirely representative of Swedish driving conditions and the Swedish climate (driving in the winter, for example, results in about a 10 % rise in fuel consumption according to the Swedish Board of Consumer Policies [1989]). One possibility seen from the consumer's viewpoint might be to offer all interested car manufacturers the opportunity to present results produced with a testing method (driving cycles, temperature etc.) which better re ects Swedish conditions, and with normal use of all on-board equipment which reduces fuel consumption (for example a heat accumulator for minimising cold-start effects).
There is a strong correlation between fuel consumption and exhaust emissions, which means that a raised ef ciency rating brought about by improved technical solutions which reduce fuel consumption, can cause the maximum permitted exhaust emission levels for certain substances to be exceeded, so that certain environmental objectives are not achieved. Bearing this in mind, there is a sharper focus on the effects of the various regulated substances, CO, HC and NOx, and no weight at all is attached to C02 emissions which are reduced in proportion to the
10
reduction in fuel consumption (when fossil fuels are used). In general, consideration should be given to the combination of various substances in exhaust emissions, for instance in that a weighted total of all the components in the exhaust gas are noted. In the reference material quoted here, there are no results which indicate that the risk of increased N0;; emissions at raised engine ef ciency ratings is particularly high. In addition, NOX emissions are currently way below the limit (in the proposed environment class 3 for petrol), which leaves amargin for a possible increase of NOx emissions to help reduce C02 emissions.
In this context it should be mentioned that it is possible to obtain information about the effect of certain factors on fuel consumption and exhaust emissions from the results published by the Swedish Motor Vehicle Inspectorate and VTI. A survey by Erlandsson [1992], for example, illustrates the effect of service. The effect of a heavily loaded car or a trailer towed by a car, and the effect of the road surface, can all be calculated by VTI with the VETO program (see Karlsson and Hammarstrom, 1986), and these effects have been calculated for a number of different cases in previous studies. A VTI survey, Westman [1985], shows the benefits of using an engine heater. Another area of great significance to exhaust emissions is the effect of cold starts in various environments and how they affect different areas, in particular major cities. A detailed study would be of great bene t.
When the EES agreement comes into force, Sweden is going to have to accept that its cars must meetthe relevant EC directives as of January 1, 1995. These directives are based on other driving cycles than those used in Sweden, which will lead to considerable comparability problems over the years for consumers, govemment bodies etc. It will also be difficult to assess the degree to which the C02 target set for passenger cars is being met.
Sweden's total energy consumption is approx. 370 TWh/year (Schipper et a1, 1992). Passenger transportation accounts for about 15 % of this total, i.e. around 55 TWh. Sweden's approximately 3.6 million passenger cars are driven about 14000 km/year (13500 km/year according to Schipper et a1 [1992], 14500 km/year according to VTI [1992a]). With an average fuel consumption of about 0.9 litres petrol/10 km and an energy content of 31.8 MJ/litres, this gives an energy utilisation gure of 40 TWh. This means that 73 % of the total energy consumption for passenger transportation is used in transportation by car.
11
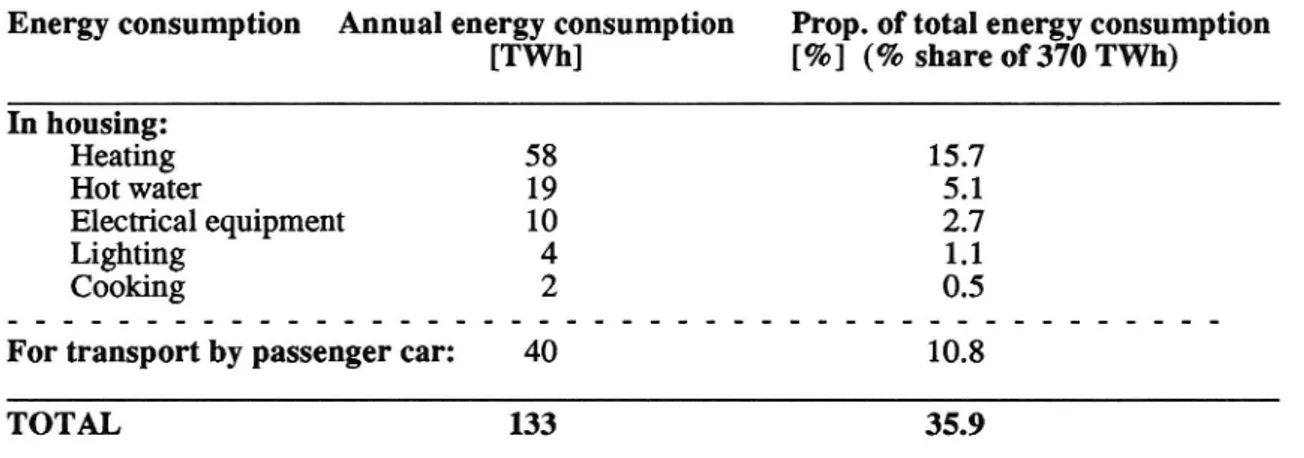
To put this into perspective, we can compare this with the total energy consumption in other contexts (data obtained from Schipper, 1992) as per Table 3. As this data shows, the total energy use in housing, excluding heating, amounts to about 35 TWh which is 5 TWh (12 %) lower than the total energy use for travel in passenger cars. These gures do include all use of cars for work purposes, it is true, but the comparison still shows that if we are concerned with reducing the overall use of energy in general and C02 emissions in particular, the potential for a reduction is far greater with measures designed to reduce car fuel Consumption than with measures aimed at the housing sector.
Table 3 Energy application in habitation and for passenger car transport.
Energy consumption Annual energy consumption Prop. of total energy consumption
[TWh] [%] (% share of 370 TWh) In housing: Heating 58 15.7 Hot water 19 5.1 Electrical equipment 10 2.7 Lighting 4 1.1 Cooking 2 0.5
For transport by passenger car: 40 10.8
TOTAL 133 35.9
12 4 FUTURE STATUS
The following description of future trends is obtained partly from TPR [1990a, page 9], and partly from VTI [1992a].
Private and public transport is expected to increase roughly equally quickly up to the end of the century, but in the long term public transport is expected to increase more quickly. A rough estimate indicates that passenger car traf c will increase by 16 % from 1987 up to 2000 and by 33 % to 2020. The corresponding gures for public transport are 18 % and 36 % respectively. An increased investment in road transport is expected to lead to as much as a 49 % increase in car traffic by the year 2020.
According to VTI's forecast, VTI [1992a, page 65], with low growth in the economy and gradual deregulation (C2) we can expect to see an increase of 20 % in car traffic from 1991 to 2005, and an increase of 40 % to the year 2020. In the light of new assessments on economic growth after LU 90 (Long-Term Survey 1990) this forecast is more probable than the other main scenarios in VTI's forecast, which indicates an even sharper rise in passenger car traffic.
The effects of the proposals in the KIS survey (Committee for Indirect Taxation), RINK (Survey on Reforms in Income Tax) and MIA (Environmental Charge Survey) are expected to lead to just a 3 % increase in passenger car traffic up to the year 2000, while public transport is expected to increase by 50 %. Furthermore, an increase in car ownership is forecast together with decreased utilisation of cars, owing to increases in operating costs (increased fees and taxes, fewer deductions in income tax returns).
In TPR's survey, TPR [1990e, pp 3-5], the time perspective extended to the year 2000, but with a view towards 2020. In this time perspective and with the expected trends in traffic, we cannot expect to meet the environmental objectives regarding carbon dioxide emissions. If the future unfolds as predicted, emissions in the year 2000 will exceed the 1988 level by approx. 2.8 million tonnes, with an excess of about 7 million tonnes in 2020. Many major international organs including the Brundtland Commission recommend extensive measures to reduce emissions of climate-affecting air pollutants. The Brundtland commission established that the use of fossil fuels should not be allowed to increase significantly above the current level. This means that the industrial nations, as a
13
gesture of solidarity with the developing nations of the world, should halve their use of fossil fuels. The Commission's work was followed up byan international conference in Toronto where the following recommendation was made:
Carbon dioxide emissions should, in the rst stage, be reduced by 20 % to the year 2005, followed by a further reduction ofat least 50 % over thefollowing 40-50 years. Each litre of fossil fuel produces 2.3 kg of carbon dioxide when burned. The National Environment Protection Board (SNV) is studying an altemative, to introduce a limit for carbon dioxide emissions as follows (see the Stockholm Group, 1991):
C02 limit = 55 + 0105* (normal vehicle weight with full tank +
average payload ofI 36 kg) [g/km] For a vehicle weighing 1000 kg, this limit gives a limit of 160 g/km, which corresponds to l.6/2.3=0.70 litres/10 km. For a "normal" car which weighs 1300 kg, this limit would give a consumption of 0.87 litres/10 km.
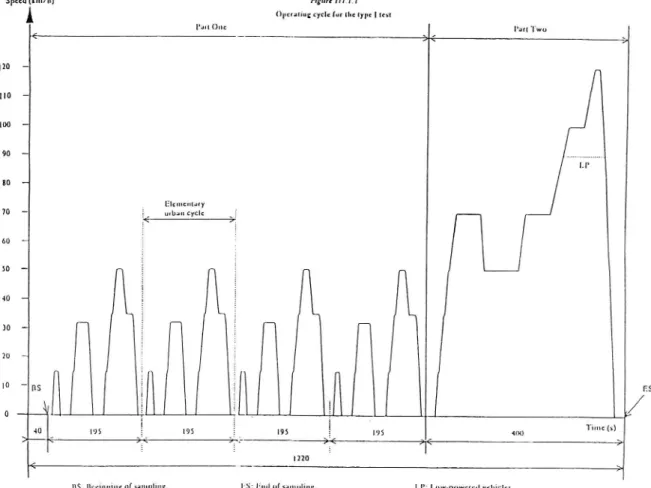
For the EC driving cycle, a vehicle's C02 value is the total C02 emission during an urban and highway driving cycle. From the point of view of duration, this means 66 % for urban driving (780 seconds of 1180). From the point of view of mileage, urban driving is weighted at 37 % (4052 m of a total of 11007).
Sweden's current use of the US driving cycle (from 1973) gives this C02 rating: C02 value = 0.55*(C02 emissions during USA urban driving cycle) +
0.45*(C02 emissions during USA highway driving cycle) A detailed description of the various driving cycles is provided in section 6. The introduction or otherwise of this type of limit is probably a matter for the EC and EFTA countries to agree on together. A review of the limit will be undertaken every third year.
Within the EC too there are discussions on new standards for car manufacturers regarding lower specific fuel consumption. According to an article by Seidler [1993] in "Vi Bil'agare" the Environment Ministers of France and Germany hit the headlines when they suggested a figure of 0.5 litres/10 km as the total fuel consumption for all new cars in the year 2005 (although most observers feel this target to be entirely unrealistic).
14
5 ANALYSIS OF THE NEW VEHICLE FLEET
Hammarstrom [1989] analysed trends in the fuel consumption of the existing car eet, model years 1980, 1984 and 1988. The most significant characteristics, their development over the years and their effect on fuel consumption are:
T l 4 Some important characteristics in uencing fuel consumption (+ = increase, - = decrease, +/- = depending on model year (formerly there was an increase in consumption, now it is comparable to a 4-speed manual gearbox and the potential for a reduction is considerable)). Characteristic Trend Fuel in uence
Service weight + + Engine power/service weight + + Type of gearbox - 5-spd. man. + -Type of gearbox - automatic + +/-Model year
The most significant characteristics causing an increase in fuel consumption are service weight and the power output/mass index, both of which have increased in recent years. This has not been sufficiently compensated by the reduction achieved by switching to 5-speed manual gearboxes and other technical advances (re ected in the model year characteristic), which has led to a renewed increase in average fuel consumption for new cars.
Thomblom and Kinbom [1990, page 36] show estimated energy ef ciency enhancement potential as per Table 5.
Table 5 The potential for the ef ciency enhancement of energy (relative improvements)
Measure Potential Time req'd. for dev. Efficiency rating, diesel engine 10 % 5 - 10 years Ef ciency rating, Otto engine 15 % 5 - 10 years Reduction in tare weight 5 - 30 % 3 - 20 years Reduction in rolling & air resistance 5 - 10 % 5 - 10 years Optimisation of engine performance 10 - 20 % now Ef ciency enhancement of driveline 2 - 3 % 5 - 10 years Braking energy recovery 5 - 25 % 2 - 10 years Total potential improvement 10 - 50 % - 20 years
The presented improvement potentials affect each other. From this follows that the total potential improvement is not obtained as per:
1 - (1-potentia11)*(1-potentia12)* . . .
15
but rather as an assessment based on the fact that certain of the improvement potentials can be viable for introduction on the market. The development period is also an assessment of how long it can take to achieve each potential. The nal value consists of the maximum value. The results in Tables 4 and 5 are commented in the following sub-chapters.
5.1 Service weight
The average weight of the car eet can be reduced in a variety of ways. The simplest means is of course through an increased demand for smaller and lighter cars. Furthermore, materials with a lower specific weight can be used, for example plastics and composites instead of iron and steel. Another means is to alter the design so that equally large but lighter vehicles can be manufactured using existing materials.
The use of vehicles optimised for specific transport requirements would result in smaller and lighter vehicles (approx. 1000 kg) powered by an engine of roughly 1 litre displacement, with a transmission which exploits the power unit's most efficient engine speed range at various loads. Theoretical calculations and the current crop of small cars show that it is possible to achieve a fuel consumption of about 0.50 litres/10 km. Many motoring journalists feel, however, that small cars are less practical because they lack the comfort of their larger counterparts and because they are less safe in a crash. With the latest trends in crash safety, with increased fuel and environmental costs and increased congestion in our major cities (primarily in the EC countries, the USA, Japan and South-East Asia), the proportion of small cars on the market will probably nevertheless increase in the future. Given this situation, lower comfort levels will probably be accepted while safety levels will remain virtually unaffected.
5.2 Engine
Hammarstrom and Karlsson [1985] analysed the technical possibilities for increasing energy ef ciency in the vehicle eet. A raised engine ef ciency rating of between 10 and 15 % is considered possible. An assessment of the development potential for today's Otto cycle engines was carried out by Bang et al [1992, page 26], and it suggests that fuel consumption according to the EC
16
driving cycle (only urban driving) can be reduced by 30 %. This could be achieved on the basis of today's 2-valve engines modified as smaller 4-valve units and featuring variable intake manifolds and variable camshaft timing (13 % reduction) and regulation of the intake valve opening (12 % reduction). The report does not specify how the variable camshaft timings differ from regulation of the intake valve. In total this report suggests that the ef ciency rating of the Otto cycle engine has an improvement potential of at least 10-15 %.
Development of the Otto cycle engine has taken a major step forward with the introduction of the 3-way catalytic converter. Unless EC requirements stipulate otherwise, there is every reason to assume that current (and probably even tougher) exhaust emission legislation will apply for all new cars in Sweden in the future. In the following presentation of alternatives to and developed versions of the catalysed Otto cycle engine, we assume that the solutions will be applied to Sweden only if environmental legislation corresponding to actual developments is satisfied. The remaining development will probably result in increase in the number of variable engine parameters such as:
variable valve timing (raised engine speed band with max. ef ciency rating, increased torque at low rpm permits economical gear ratios and lower friction losses (Honda has developed anextremely fuel-efficient car which is currently on the market, where the number of opened intake valves is regulated by engine load, see Sterner [1993]»
variable compression (increase in compression at part loads can result in a rise in the ef ciency rating by 10-15 % and a 5-10 % drop in fuel consumption, improving the possibility of running the same engine on various fuels)
turbocharging (turbocharging a small engine of about 1 litre displacement may result in about 20 % reduction in fuel consumption compared with a normally aspirated engine twice the size with the same power output)
lean-burn engines (with a higher air surplus and leaner combustion can raise the ef ciency rating by 7-8 % at full load, even more at part load, owing to lower pump losses. However, despite reduced NOx emissions, it cannot compete from the emission viewpoint with today's catalysed Otto cycle engines. Unfortunately today's exhaust cleanup technology does not work with the surplus air system while maintaining the nitrogen oxide reduction, although this may be possible in the future (Honda has developed an engine which utilizes the lean-bum principle ))
stroke engines (with a new injection system, the latest generation of two-stroke engines offers an ef ciency rating similar to or even better than that of the Otto cycle engine while at the same time weighing much less, resulting in
a fuel saving of up to 25 %. However, the gas- ow principle makes regulation
of surplus air more dif cult and therefore results in poorer control over NOx emissions (Jaguar is currently developing such an engine».
17
The new two-stroke engine using OCP technology (Orbital Combustion Process) which has been designed by Ralph Sarich is said to produce such low emissions that the new US norms are met with room to spare, while also offering a reduced fuel consumption of almost 30 %, see Ottossen [1990]. It is also considerably lighter in weight than a corresponding four-stroke engine. If the performance gures indicated so far are actually obtained in practical application, the ef ciency rating improvements indicated in Table 5 will be surpassed.
The accumulation of surplus heat during engine operation, which is stored and then utilised to heat the engine the next time it is started, would provide a considerable reduction in fuel consumption, emissions and engine wear. This is especially important for short trips. This technology is under development by companies such as SAAB, who have harnessed the system to quickly raise the catalytic converter to operational temperature after startup. Hanneberg [1992] notes that activation of the accumulator's heating system about 1 minute before the engine starts up will result in an 80 % reduction of CO and HC emissions. No
gures are given for the potential reduction in fuel consumption.
5.3 Transmission
There is a considerable potential for savings by regulating the transmission so as to optimise operation within a carefully calculated energy-efficient range. In practice this means that the system always works towards providing the highest possible torque (= highest engine load). This is obtained at the lowest possible engine speed, thus maximising the engine's ef ciency rating. There is already a gearbox which works according to this principle and it features a computer-controlled continuously variable ratio. The total saving is given as about 8 %, irrespective of whether it is implemented on its own or together with other ef ciency enhancing measures. For small cars, we may be looking at savings of as much as 12 %. This ef ciency-enhancing potential is verified by Egnell [1991, pp 14-20], with fuel consumption reductions of 4 % in urban traffic (because of considerable idling) and about 10 % on a trip from a suburb to the city centre. For highway driving according to the HWFET cycle (High Way Federal Economy TeSt) the result of choosing the optimum gearchange points is less obvious since most of the trip is undertaken at speeds above 72 km/h, when top gear is used throughout. Table 5 does not show the potential 8-12 % driveline improvement shown by Hammarstrom and Karlsson [1985].
18
The risk of increased NOx emissions when aiming for energy-optimising operation is pointed out by experts such as Egnell [1991, page 59]. A study of a number of cars driven at 50 km/h in both 4th and 5th gear, see Laveskog [1990], shows that NOX emissions [g/km] often dropped when the higher gear was used, but the opposite also occurred. Choosing optimum change-up points, whether manually or in an automatic transmission, can therefore not be disregarded as an energy-saving measure since NOx emissions increase.
The potential for development of alternative engines and fuels is presented in a more accessible way by Egnell [1991]. In the short term, a change in the driving pattern with increased used of the highest possible gear and a switch to wheels with less rolling resistance would give a fuel saving of about 10 %.
5.4 Model year
Some of the developmental stages presented by Hammarstrom [1990, page 59] are based on current technology for 1990 model cars. Developmental stages for cars in the intermediate sector are based on material produced in an STU (Board for Technical Development) project by Gunnar Kinbom, Leif Andersson and Rolf Egnell. The results from a driving cycle consisting of 30 % urban, 20 % suburban and 50 % highway are summarised below:
Technology status Fuel consumption NOx emissions [litres/10 km] [g/km] 0. Existing technology. Model year 1990. 0.84 0.12
1. Current technological development.
Corresponds to model year 1995. 0.70 0.06 2. Continuous variable transmission.
Corresponds to model year 2000. 0.56 0.04 3. Hybrid car. Introduction assumed as of
model year 2005. 0.50 0.035 With electric power, electricity consumption
is approx. 0.9 MJ/km (can be expressed as
15 kW power output when driving at 60 km/h)
19
5.5 Other engines of potential future interest
Santini [1985] analysed engine developments. The available alternatives are the conventional petrol engine, diesel engine, Stirling engine and gas turbine unit (Brayton). "System ef ciency" (not defined in the report, but should indicate average energy consumption for a mixed urban and highway driving cycle) for these alternatives is stated as 18, 21, 25 and 28 % respectively. As expected, the higher system ef ciency of the last two alternatives is obtained at higher cost. In addition, the gas turbine engine has roughly the same consumption profile at . idling speed as a petrol engine, whereas the Stirling unit is better, at about 60 % of the petrol engine's fuel consumption, or twice as much as for the diesel engine. The relative economy of using a fuel other than petrol or diesel depends naturally on the car's operational sphere and current car and fuel prices, among other things.
The section below presents a brief review of the advantages and disadvantages of the various engines. The summary is obtained from Egnell [1991].
Diesel engine. The advantage of the diesel engine is its low fuel consumption, obtained to a great extent through its far higher ef ciency at part load. Its disadvantages are mainly considerably higher NOx and particulate emissions compared with catalysed Otto cycle engines, and its higher price, coupled to higher taxation.
Elsbett engine. A variant of the diesel engine with a different injection system (including a special spreader) allowing the use of biofuels (for example vegetable oils). It produces lower NOx emissions at the expense of a small reduction in ef ciency compared with the diesel engine. The advantage of a high ef ciency rating under part load is retained.
Stirling engine. The Stirling engine is as environmentally clean as a modem catalysed Otto cycle engine, provided it uses the latest combustion technology. It is also extremely exible as regards fuel choice. At present it is too expensive for series introduction on the market.
Gas turbine engine. A ceramic engine developed within the AGATA project is largely up and running, see Egnell and Gabrielsson [1991]. It offers potential for low emission levels - similar level to the Otto cycle engine - but there is difficulty in obtaining the sort of driveability we are used to in a conventional engine. Volvo's EEC experimental car is equipped with a gas turbine which is of considerable interest, installed for hybrid power, see for example Sterner [1992] and Carlsson [1992]. This car aroused considerable interest in the USA in general, and in California in particular (Trouvé, 1993). Steam engine. Theoretical calculations have been undertaken for an advanced steam-powered system. One advantage is exibility in fuel choice, but there are no emission-related bene ts over the Otto cycle engine.
20
Electric motor. The use of electric power in battery-carrying vehicles gives clear-cut local environmental bene ts, but owing to ef ciency losses in the production of electricity, its distribution, battery recharging and vehicle power, and owing to its high mass (low energy density in the batteries), the energy consumption in the CVS cycle (journey from suburb to city centre) using two electric-powered commercial vehicles from Renault was 10-25 % higher at the power station than that for a corresponding Otto cycle engine (ef ciency ratings: power station 44 % calculated as per the energy supplied as electrical energy, 87.5 % from the power station via the battery to the electrical motor (deliberately high figure to compensate for the braking energy not recovered). For the 25% alternative, the electric car's consumption was
1.13 kWh/km, i.e. quite high compared to the petrol car's 0.91 kWh/km). Hybrid power. The use of an energy-optimised combustion engine (usually) coupled to a generator and batteries to form a combined source of electrical energy for an electric motor. The advantage is total lack of emissions in particularly vulnerable environments when running on batteries, allied to the operational range of a conventional car when driving long distances. Even with the combustion engine in operation, emissions are low. Energy savings can be made under certain driving conditions but this can be reversed in other conditions. Energy ef ciency depends on the ef ciency ratings of the electric transmission system (approx. 90 % per stage for generator, electric motor, charging and discharging of batteries give approx.70 % ef ciency rating at output))
Fuel cells in combination with electric motor. A fuel cell is an electro-chemical energy converter which can achieve ef ciency ratings of 60 %. Fuel cells are currently used in spacecraft applications. For car applications, however, the low power to mass ratio may mean that some of this efficiency is negated by the need to keep the vehicle on the move.
5.6 Alternative fuels
If there is a switch over to other fuels or forms of energy, such as biofuels, gas, electricity etc., it is irnportant to relate all statistics to the energy content of the fuel concerned. In practice, this may mean that all results are converted to a petrol equivalent or that emission levels are given in a common denominator, g/km, for all the fuels being examined. If biofuels are used, the net discharge of carbon dioxide should be stated since it is the carbon dioxide bound in the biofuel which is released upon combustion. The net discharge therefore does not have to be 0, because fossil fuels may be used in the production process. If electricity is used, it is essential to check which energy source was used in its production (hydro-electric station, nuclear power, oil-based condensation power station or other alternative). According to Egnell [1991, page 26] electricity produces the highest discharge of carbon dioxide when it is produced from coal. The main advantages of electricity are the considerable reduction of emissions and noise in urban
21
environments, and that environmental benefits accrue when electricity is obtained from non-fossil fuels (as in the case of Sweden, where 95 % of electricity comes from non-fossil fuel sources). The survey by Ecotraffic AB [1992] shows total resource consumption for various fuels divided per fossil energy and renewable energy. Total energy requirement is related to 100 % energy in the fuel tank. The entire process all the way to the car's fuel tank requires energy resources for such things as
1. production ofthe raw material used for energy (oil and gas drilling and extraction, cultivation and harvesting of biomass etc.)
transportation of the raw energy
conversion of the raw energy into nished fuel (refining crude oil, biomass processing etc.)
distribution of the fuel
electricity production (requires fossil fuels, biomass or hydro-electric power and related resources)
distribution of electricity. 9 % " ? 9! "
Some examples from the report show the extent of the net discharge of C02 all the way to the car's fuel tank as below.
Table 6 Distribution of fossil /non-fossil energy for some alternative fuels. Fuel Energy need for Fossil energy qty. Fossil
production of 100 up to prod. energy qty. energy units in tank before tank in tank Petrol 121 21 100 Diesel 1 14 14 100 Biogas (fossil
fuel-driven process) 174 30 0 Methanol (natural gas based) 145 45 100 Methanol (biomass based) 218 18 O Ethanol (grain and
fossil-fuel based) 243 108 0
Ethanol (based on straw) 246 24 0
Table 6 shows how much fossil fuel is necessary to obtain 100 energy units in the tank (column 2 in Table 6 can be interpreted as the number of litres of petrol or diesel needed for the production and distribution of an energy quantity corresponding to 100 litres of petrol or diesel, and column 3 can be interpreted as the number of litres of petrol or diesel in the tank). Efficiency in using these 100 energy units depends on how well the engine functions with each respective energy source and also on the mass and volume of the fuel in question (a fuel with a lower energy content per litre than that of petrol may require a larger fuel tank to give the vehicle a convenient operating range. This increases the vehicle's
22
weight and fuel consumption). Here are some of the conclusions of the report (pp
140- 141):
energy turnover 20-300 % higher for renewable fuels (17-70 % of the energy is expended in transportation compared with 85-90 % for fossil fuels)
. _ emissions which accelerate the greenhouse effect are lower for certain alternative fuels (propane, natural gas and methanol) and considerably lower for renewable fuels (65-70 %)
NOx emissions are highest at the end-user stage, the lowest levels are obtained for fuel/engine combinations which allow use of a 3-way catalytic converter; used in diesel engines, alcohol-based fuels give lower NOx emissions than diesel oil
the risk of discharging genetically damaging substances (alkenes, benzene, aldehydes etc.) is lowest for fuels with single molecules (like methane) and highest for petrol and diesel fuel.
In the study, end-use of fuel has been related to existing, well-defined engines in typical road-going vehicles (cars, trucks and buses). This means that existing laboratory statistics for emissions could be used as a basis for the calculations. However, Erlandsson [1992] has pointed to the lack of a health index for various substances. It is also worth emphasising that handling of methanol gives off the extremely toxic substance formaldehyde, whereas ethanol instead gives off the considerably milder acetaldehyde. Ethanol is in fact one of the least dangerous substances for large-scale use in industrial processes.
Furthermore, explosion hazards and other risks arising in the use of gas as a vehicle fuel should be carefully weighed. Experiments carried out in the USA, the Netherlands and other countries show that gas containers (under pressures of up to 200 bar) withstood stresses such as bullets (USA) and fire (Netherlands) without catastrophic results. In the context of fire, it is important that the blaze from the safety valve points down to the road or rearwards to permit the vehicle to be evacuated.
According to Egnell [1991, page 34] an ethanol mixture of up to 20 % is viable without impairing emissions or the normal function of a petrol-engined car equipped with a three-way catalytic converter. The problems and possibilities of using various alcohols as engine fuels were highlighted by Pettersson [1991] and others. One major conclusion is that the emission of unburned alcohol and aldehydes is higher than for petroleum-based fuels, but asuitable catalyst can be
23
used to considerably minimise fuel-related emissions and thus improve air quality in major cities.
In a Norwegian study, Bang et al [1992] show the effects of natural gas as a vehicle fuel on energy demand and the enviromnent. Comparisons are made with petrol and diesel cars. The summary (pp 100-101 in section 2.1) states that diesel fuel from crude oil used in a diesel engine offers the best total ef ciency rating (from raw material to completed transport assignment) for passenger cars, city buses and trucks in the mixed driving cycle. The calculations show that the best total ef ciency rating is obtained by passenger cars in urban driving and by electric cars for goods distribution in urban traffic provided the electricity comes from a natural gas plant. The total ef ciency rating for petrol engined cars in the mixed and urban driving cycles is given as 0.3 to 6.1 percentage points below the rating obtainable with CNG (Compressed Natural Gas), LNG (Liquid Natural Gas) or LPG (Liquid Propane Gas) produced from natural gas. The emission effects are presented in section 2.2 by Bang et a1 [1992] with a summary in chapter 9.
5.7 The future, choice of fuel and Swedish car manufacturers
Thomblom and Kinbom [1990, page 45] present a scenario which includes the phasing-out of conventional cars in favour of " exible-fuel" vehicles powered by petrol or diesel + alcohol or gas, and electric-hybrid cars or all-electric cars. The use of alcohol or biogas would reduce carbon dioxide emissions, but total energy consumption may increase. Electric-hybrid cars may offer higher energy ef ciency (and therefore lower carbon dioxide emissions) if the piston engine is optimised and the other relevant components also achieve a high ef ciency rating. All-electric cars produce a clear-cut reduction in carbon dioxide emissions if they are recharged with electricity produced by hydro electric or nuclear power, see also TPR [1990e, pp 57-64]. The emission levels of toxic substances with this type of fuel are discussed by a variety of experts, for example Ecotraffic AB [1992] whose findings are summarised in connection with Table 6 in this report. According to Santini [1988] the oil market will experience considerable dif culties during the coming 20-year period owing to insuf cient supplies at reasonable prices. Santini feels that the most cost-effective solution for dealing with the vehicle fuel supply situation is to produce methane from natural gas,