Abstract
Human activities have lead to changes in the energy balance of the Earth and the global climate. Changes in atmospheric aerosols are the second largest contributor to climate change after greenhouse gases since 1750 A.D. Land-use practices and other environmental drivers have caused changes in the emission of biogenic volatile organic compounds (BVOCs) and secondary organic aerosol (SOA) well before 1750 A.D, possibly causing climate effects through aerosol-radiation and aerosol-cloud interactions. Two numerical emission models LPJ-GUESS and MEGAN were used to quantify the changes in aerosol forming BVOC emissions in the past millennium. A chemical transport model of the atmosphere (GEOS-Chem-TOMAS) was driven with those BVOC emissions to quantify the effects on radiation caused by millennial changes in SOA.
The specific objectives of this licentiate thesis are: 1) to understand what drove the changes in aerosol-forming BVOC emissions (i.e. isoprene, monoterpenes and sesquiterpenes) and to quantify these changes; 2) to calculate for the first time the combined historical aerosol direct and aerosol-cloud albedo effects on radiation from changing BVOC emissions through SOA formation; 3) to investigate how important the biological climate feedback associated to BVOC emissions and SOA formation is from a global climate perspective.
We find that global isoprene emissions decreased after 1800 A.D. by about 12% - 15%. This decrease was dominated by losses of natural vegetation, whereas monoterpene and sesquiterpene emissions increased by about 2% - 10%, driven mostly by rising surface air temperatures. From 1000 A.D. to 1800 A.D, isoprene, monoterpene and sesquiterpene emissions decline by 3% - 8% driven by both, natural vegetation losses, and the moderate global cooling between the medieval climate anomaly and the little ice age. The millennial reduction in BVOC emissions lead to a 0.5% to 2% reduction in climatically relevant aerosol particles (> 80 nm) and cause a direct radiative forcing between +0.02 W/m² and +0.07 W/m², and an indirect radiative forcing between -0.02 W/m² and +0.02 W/m². The suggested biological climate feedback seems to be too small to have observable consequences on the global climate in the recent past.
Contents
List of papers and author's contribution...3
1. Introduction...4
2. Theory/Background...6
2.1 Atmospheric life cycle of aerosol particles and clouds...6
2.1.1 Aerosol particle and cloud droplet size distribution...6
2.1.2 New particle formation...6
2.1.3 Activation of Cloud Condensation Nuclei (CCN)...6
2.1.4 Condensation/deposition and evaporation/sublimation...7
2.1.5 Coagulation/collision coalescence...8
2.1.6 Dry deposition/precipitation...8
2.1.7 Wet deposition or wet scavenging...8
2.1.8 Chemical processing...8
2.2 Biogenic volatile organic compounds emissions (BVOCs) and secondary organic aerosol (SOA) formation...9
2.3 Aerosol- and cloud-radiation interactions.…...10
2.3.1 Estimates of anthropogenic RF through aerosol-radiation interactions (ARI)...11
2.3.2 Estimates of anthropogenic RF through aerosol-cloud interactions (ACI)...11
3. Methods/Approach...12
4. Presentation of papers...12
4.1 Paper I: Global emissions of terpenoid VOCs from terrestrial vegetation in the last millennium...12
4.2 Paper II: Aerosol size distribution and radiative forcing response to anthropogenically driven historical changes in biogenic secondary organic aerosol formation...14
5. Conclusions...16
6. Outlook...16
Acknowledgements...17
List of papers and author's contribution
Paper I: Global emissions of terpenoid VOCs from terrestrial vegetation in the last millennium
Acosta Navarro, J. C., Smolander, S., Struthers, H., Zorita, E., Ekman, A. M., Kaplan, J. O., Guenther, A., Arneth, A., & Riipinen, I. (2014). Journal of Geophysical Research: Atmospheres, 119(11), 6867-6885.
In this study I implemented and ran the model simulations for one of the two the models, I analyzed the results from both models and wrote most parts of the manuscript.
Paper II: Aerosol size distribution and radiative forcing response to anthropogenically driven historical changes in biogenic secondary organic aerosol formation
D'Andrea, S. D., Acosta Navarro, J. C., Farina, S. C., Scott, C. E., Rap, A., Farmer, D. K., Spracklen, D.V., Riipinen, I. & Pierce, J. R. (2015). Atmospheric Chemistry and Physics, 15(5), 2247.
In this study I contributed to the planning of the simulations, provided input data and helped implementing it in the chemical transport model. I took part in the discussions and analysis of the results and wrote the sections of the manuscript related to my work.
1. Introduction
The climate system is composed of interactive sub-systems (atmosphere, hydrosphere, cryosphere, biosphere, lithosphere and anthroposphere) exchanging energy and mass at different temporal scales. The large majority of energy driving physical, chemical and biological processes in these systems comes from the sun in the form of electromagnetic radiation. The global annually averaged global incoming Shortwave (SW) solar radiation at the top of the atmosphere (TOA) is 340 W/m², of which 100 W/m² are reflected back to space. The remaining 240 W/m² absorbed by the system are balanced by outgoing Longwave (LW) thermal radiation from the Earth's surface and the atmosphere (Stefan, 1879 & Boltzmann, 1884), keeping the system close to thermodynamic equilibrium. Hence, the temperature of the climate system is regulated by the amount of radiation absorbed by it (see Table 1 for a summary of the Earth's energy budget).
A climate forcer is an agent that brings the system to an energetic imbalance by interacting with SW and/or LW radiation. Radiative forcing (RF) is defined as the instantaneous anomaly at the TOA energy balance introduced by the forcing agent (IPCC, 2013). Once the RF is introduced, additional readjustments of the energy budget from different components of the climate system may enhance or dampen the net imbalance. These effects are called climate feedbacks and are essential for understanding climate change. RF induced changes in cloud cover, humidity, thermal profile of the atmosphere or surface albedo are the main feedbacks, although also other potentially important feedbacks exist (e.g. release of methane to the atmosphere from melting permafrost or changes in carbon uptake by the oceans or the biosphere).
Suspended liquid or solid particles in the air, known as aerosol particles, directly reflect 5.0 W/m² of the incoming SW solar radiation back to space, cooling the climate (Yu et al., 2006). Aerosol particle sizes range from a few nanometers to tens or hundreds of micrometers, they vary in chemical composition and can be generated by natural sources (e.g. desert dust, pollen, sea spray) or by human activities (e.g. fossil fuel combustion, biomass burning). In this thesis, the terms aerosol particle and cloud particles are used independently for clarity, although also clouds are technically aerosols. Clouds reflect 47.3 W/m² of SW solar radiation back to space and prevent 26.2 W/m² of LW thermal radiation from the surface of the Earth or atmosphere from escaping to space, causing a net cooling of 21.1 W/m² (Boucher et al. 2013). Comparing the numbers, it is evident that clouds are more important than aerosol particles in affecting the TOA energy budget (Table 1). However, cloud droplets and crystals are formed on aerosol particles, and the microphysical and optical properties of clouds are modified by changing aerosol properties (Twomey, 1977; Albrecht, 1989). Aerosol direct effect on radiation is known as aerosol-radiation interactions (ARI) and the indirect effect is known as aerosol-cloud interactions (ACI).
Radiation at the TOA Power per unit area (W/m²)
Downward SW solar radiation 340
Total reflected SW radiation (clouds, aerosols, surface, and air) 100
Reflected SW radiation by clouds 47
Reflected SW radiation by aerosols (out-of-cloud) 5
Net absorbed SW radiation 240
Outgoing LW thermal radiation 240
Prevented outgoing LW radiation by clouds 26
Table 1: Top of the atmosphere energy balance. All values are annually and globally averaged and represent present day conditions (Trenberth et al. 2009 & Yu et al. 2006).
Well-mixed greenhouse gases are excellent absorbers of LW radiation (Arrhenius 1896), but poor absorbers or scatterers of SW radiation, whereas aerosol particles are typically better absorbers or scatterers of SW than LW radiation. Human activities have changed the composition of the atmosphere, and the anthropogenic greenhouse gas RF is estimated to be 3.0 W/m² since 1750 (IPCC, 2013). Anthropogenic aerosols through ARI and ACI cause a net RF of -0.9 W/m² with a 90% uncertainty range between -0.1 and -1.9 W/m² (Boucher et al. 2013), offsetting part of the warming from greenhouse gases. Typically, the anthropogenic aerosol RF is estimated by quantifying direct changes in emissions from fossil fuels and biomass burning.
Vegetation emits large amounts of biogenic volatile organic compounds (BVOCs) to the atmosphere. After oxidation, a fraction of these compounds forms aerosol particles. By modifying the land cover of the Earth (e.g. agriculture, urbanization), humans have caused changes in the natural aerosol and radiative properties of the planet (Unger et al., 2014). Additionally, BVOC emissions from plants increase non-linearly as air temperature and solar radiation increase, and decrease with decreasing soil water content (Peñuelas and Stoudt, 2010) creating a possible biological climate feedback, which can be outlined as follows: climate change → modified BVOC emissions → aerosol properties change → radiative forcing → climate change. To my knowledge, only one previous study by Unger et al. (2014) had quantified the ARI RF (+0.09W/m² ) from changes in aerosol properties caused by land-use changes. However, the ACI RF has not been quantified before.
The main objective of this work was to quantify the historical land-use and environmental effects of aerosols on climate through changes in BVOC emissions (Paper II). To be able to do so, global millennial emission inventories of aerosol relevant BVOCs were created (Paper I). Based on these objectives, the following hypotheses were tested and served as the motivation for the research. The papers provide information to verify or falsify these hypotheses, the reasons are summarized in the conclusions of this work.
Hypothesis 1: Millennial changes in land-use modify BVOC emissions, and thereby aerosol properties which change the radiation balance of the Earth through ACI and ARI.
Hypothesis 2: The dominating environmental factor affecting global BVOC emissions, besides from land-use, is surface temperature change.
Hypothesis 3: The climate system responds to warming by increasing global emissions of BVOCs, therefore causing an increase in aerosol optical depth and cloud albedo. This causes a negative climate feedback.
2. Theory/Background
2.1 Atmospheric life cycle of aerosol particles and clouds 2.1.1 Aerosol particle and cloud droplet size distribution
Assuming spherical particles, the aerosol or cloud droplet population at a given location can be described reasonably well by using a multi-modal log-normal distribution representing their concentration as a function of their mean diameter. After direct emission of particles or their formation from gases, they undergo several microphysical processes before being ultimately removed from the air. Basically all cloud droplets are formed in the atmosphere through condensation on an aerosol particle and about half of the aerosol particles on which cloud droplets can form, are formed from vapors in the atmosphere (Merikanto et al. 2009). Commonly, aerosol and cloud microphysical processes are explained separately and different names are used to classify process that are equivalent in both cases. However, to keep the description brief and as a reminder of the similarity between these processes, they are described together when possible.
2.1.2 New particle formation
Solid or liquid particles can form from vapor molecules that collide and stick to each other to form clusters of a few molecules. In energetically favorable cases the clusters continue growing to form larger particles. This process is know as new particle formation. The net growth of a new particle is achieved through larger condensation than evaporation rates (Vehkamäki and Riipinen, 2012). Sulfuric acid at typical atmospheric conditions, formed in the atmosphere after oxidation of sulfur dioxide or dimethyl sulfide, has a low volatility and with the stabilizing aid of inorganic or organic bases forms new particles of a few nanometers very efficiently. Freshly formed aerosol particles can continue growing further by condensation of vapor molecules or collide and coalesce (coagulate) with other particles.
2.1.3 Activation of Cloud Condensation Nuclei (CCN)
The critical dry diameter for an aerosol particle acting as a CCN to activate as a cloud droplet is typically of the order of 50-150 nm (Figure 1). For a spherical cloud droplet forming on an aerosol particle, the theory describing these processes is the Köhler theory, which combines the competition between the Kelvin effect and Raoult's law (Figure 1). On one hand, the Kelvin effect expresses the ratio of equilibrium vapor pressure between a curved and a flat surface. The flatter the surface of the droplet, the lower the equilibrium vapor pressure. On the other hand, Raoult's law expresses the effect of a solute (e.g. soluble aerosol) on the equilibrium vapor pressure of a solvent (e.g. water). The amount of solute reduces the equilibrium vapor pressure of the solvent, it dominates at small droplet sizes (larger concentration of solute) over the Kelvin effect, and allows a CCN to activate if the ambient supersaturation exceeds a critical value (Figure 1). In summary, the larger and more soluble the aerosol particle, the lower supersaturation it needs to activate as a CCN. Activation of CCN (new particle formation) changes the size distribution of cloud droplets (aerosol particles) by increasing the total number of droplets (particles).
Figure 1: Köhler curves showing the equilibrium water vapor supersaturation (SS) at 293º K for droplets of pure water (dotted curve) and for droplets containing various masses of dissolved (NH4)2SO4 (solid curves) as function of diameter of the droplet. Taken from Andreae and Rosenfeld (2008)
2.1.4 Condensation and evaporation
If new particle formation (or activation of CCN) provides numerous new atmospheric particles (droplets), condensation provides the mass that grows them to larger sizes. For an aerosol particle or droplet to grow via condensation the ambient vapor pressure of the condensing gas must be larger than the vapor pressure at the surface of the particle (droplet), creating a net diffusive flux of molecules towards it. If the conditions reverse the opposite can happen causing a net evaporation from the surface of the particle (droplet) reducing its mass and size. These processes do not change the number of atmospheric particles (droplets) but increase or decrease their size/mass. Analogously to the role of water in growing cloud droplets or ice crystals, sulfuric acid and organic compounds formed in the atmosphere by oxidation, are fundamental to understand aerosol growth of freshly formed particles in many environments (Riipinen et al. 2011, Ehn et al., 2014). The diffusive flux is more efficient towards larger particles due to a smaller Kelvin effect (Figure 1), meaning that larger particles will take more vapors than smaller ones. In clean environments with few large droplets, newly formed aerosols find a more favorable state to grow enough by condensation to CCN sizes and ultimately become a cloud droplet by activation. This whole process can take clusters of a few nanometers to drops of hundreds of micrometers affecting the optical properties of both clouds and aerosols (Merikanto, et al., 2009).
2.1.5 Coagulation/collision coalescence
Coagulation of aerosol particles or collision coalesce of cloud particles are the processes in which two or more particles collide and stay together forming a new larger one. Brownian motion, and turbulent mixing generate the motions that make this collisions possible. Coagulation/collision coalescence decreases the number and keeps the mass constant. Aerosol or cloud particle collision efficiency is larger between large and small particles (droplets) and is low between particles of similar sizes. This has two effects for aerosol particles:
1. Nanometer sized freshly-formed atmospheric particles are easily removed by colliding with larger particles, this creates a competition between coagulation/collision coalescence removing particles and condensation growing them.
2. Aerosol particles of intermediate sizes (~ 300 nm) are not removed easily and accumulate more than at other sizes.
2.1.6 Dry deposition/precipitation
All particles suspended in the air are subjected to the Earth's gravitation, accelerate and fall downwards reaching a terminal velocity. The terminal velocity depends on the particle size and aerodynamic properties. Larger particles deposit faster than smaller ones. When a droplet or ice crystal grows enough to deposit, the process is called precipitation. The process reduces particle number an mass.
2.1.7 Wet deposition or wet scavenging
Wet deposition of aerosol particles include impaction scavenging, which is simply collision coalescence between aerosol and cloud particles. The process happens in and below clouds and removes aerosol particles from the air, therefore reducing both mass and number of particles. Wet deposition also includes activation, growth and precipitation of an aerosol particle acting as CCN. 2.1.8 Chemical processing
All chemical compounds in the atmosphere are subjected to an oxidative potential driven by photochemistry. Reactions happen both in the gas phase and condensed phase oxidizing the compounds involved. Gas phase reactions between both organic and inorganic compounds with the main oxidants of the atmosphere affect the thermodynamic properties and typically produce less volatile compounds. As a result, a fraction of the oxidized material condenses to form aerosol particles. The following are examples of generic gas-phase chemical reactions happening in the atmosphere relevant to this work:
SO2 + Oxidant (OH, O3)→ H2SO4 + other products (1
BVOC + Oxidant (OH, O3, NO3) → xSVOC, yLVOC or wELVOC + other products (2
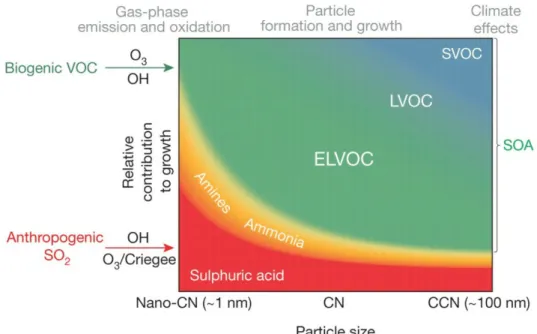
SVOC, LVOC and ELVOC stand for semi-volatile, low-volatile and extremely low-volatile organic compounds, respectively. x, y and w stand for their respective produced fraction. Sulfuric acid and SVOCs, LVOCs and ELVOCs are key compounds explaining new particle formation and growth in Boreal forest regions (see Figure 2) and possibly other forested areas.
2.2 Biogenic volatile organic compounds emissions and secondary organic aerosol formation Thousands of chemical compounds known as Biogenic Volatile Organic Compunds (BVOCs) are emitted by vegetation. Despite the high diversity in BVOCs, isoprenoids or terpenoids (isoprene, monoterpenes and sesquiterpenes) have the largest potential to affect global climate and are the main focus of this work. About one half of the global BVOC emissions are emitted in the form of isoprene, one tenth in the form of monoterpenes and about 5% as sesquiterpenes (Guenther et al., 2006). Broadleaved trees typically emit more isoprene than monoterpenes and sesquiterpenes making tropical and mixed forests large contributors to the global isoprene budget, whereas needleleaved trees located at high latitudes emit large amounts of monoterpenes and sesquiterpenes. It is currently thought that BVOC emissions have several ecosystem functions, such as plant communication or protection from biotic or abiotic stressors (Peñuelas and Stoudt, 2010), but there is no conclusive evidence on this regard.
It is also possible that pristine forest ecosystems, which typically have very low concentrations of aerosol particles in the air above, emit BVOCs together with water vapor from transpiration to modify the cloud properties, enhance precipitation and recycle water efficiently throughout the ecosystem. The importance of BVOCs in this elegant mechanism is not known. What is known, is that terpenoid compounds form aerosol particles very efficiently in some pristine environments. Most BVOCs enter the atmosphere in a reduced state making them highly reactive. Depending on the compound, from <1% to ~20% of the oxidized BVOC mass condenses forming secondary organic aerosol (SOA). A small fraction of BVOCs become extremely low volatile (Jokinen et al. 2015; Ehn et al., 2014, Figure 2) and enhance new particle formation rates and aerosol particle growth at the initial growth stage (nm-sized particles). In a clean environment with very few large aerosol particles, the growth of newly formed particles to CCN sizes is favored due to low coagulation losses and depletion of condensing vapors on large particles.
Figure 2: Schematic representation of the role of sulfuric acid, amines, ammonia and organic molecules of different volatilities in the growth to CCN sizes and composition of fine aerosol particles in a Boreal forest environment. Taken from Ehn et al. (2014).
2.3 Aerosol- and cloud-radiation interactions
Atmospheric particles (and cloud droplets) can absorb or scatter electromagnetic radiation. These processes are affected by the particle (droplet) chemical composition, size, shape and wavelength of the radiation. Fresh black carbon aerosol particles are good absorbers of solar radiation, they prevent incoming solar radiation to reach the surface, and warm the air in their surroundings. Cloud droplets, ice crystals, dust, sea spray, sulfate, nitrate and aged organic carbon aerosol particles are efficient scatterers of light and disperse incoming solar radiation, returning a fraction of it back to space. The absorption and scattering properties of atmospheric particles and droplets are quantified with the single scattering albedo coefficient, which it is the ratio between scattering and extinction (scattering+absorption) cross sections for a single particle/droplet. Additionally, an asymmetry factor can be estimated for different types and shapes, depending on the amount of radiation scattered forward and backward. A radiative transfer model integrates the concepts above and is used to estimate the total amount of radiation scattered and absorbed in a discrete multilayer column of air with suspended particles and droplets of different sizes and compositions. The Mie-Lorentz solution to Maxwell equations (Mie, 1908) provides an analytical method to solve the interaction between an homogeneous sphere and electromagnetic radiation of a certain wavelength, making it possible to estimate the optical properties needed by the radiative transfer model. In this way aerosol particle and cloud droplet effects on radiation are estimated in models.
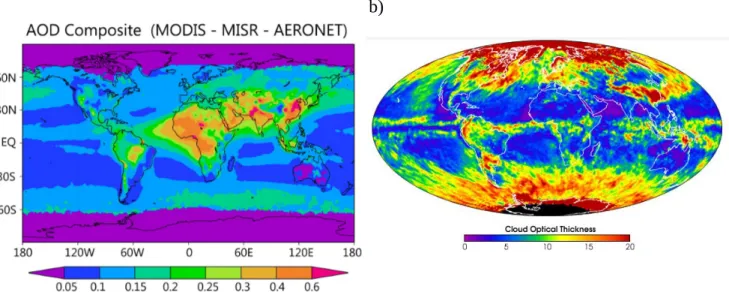
The optical depth or optical thickness is the total extinction cross section area in a column of air with respect to a surface area for a specific radiation wavelength. It provides a measure of the amount of light in a specific wavelength scattered or absorbed by particles or droplets in the column of air. The observation-based present day annual aerosol and cloud optical depth are displayed in Figure 3 a and b, respectively. Evidently, the cloud optical depth is much larger than the aerosol optical depth and causes stronger radiative effects (see Table 1). Desert regions, rich in mineral dust (natural aerosols), tropical biomass burning regions (natural and anthropogenic aerosols) and east Asian pollution (anthropogenic aerosols) regions stand out by having high values of aerosol optical depth. Strong cloud formation tend to cluster at the inter-tropical convergence zone and the mid-latitude storm tracks.
a) b)
Figure 3: a) Annually averaged clear-sky aerosol optical depth (AOD) at 550 nm from ground- and satellite-based retrievals. Taken from Kirkevåg et al. (2013). b) Satellite-based cloud optical depth at the visible range of light (Figure from NASA earth observatory, http://earthobservatory.nasa.gov/IOTD/view.php?id=1854)
2.3.1 Estimates of anthropogenic RF through aerosol-radiation interactions (ARI)
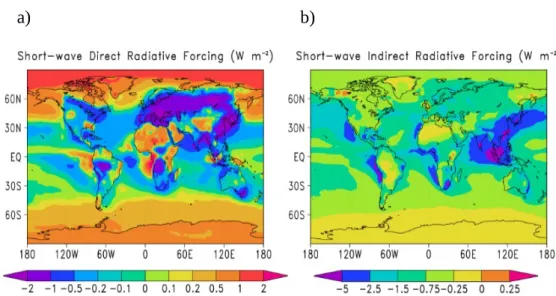
The best estimate of anthropogenic ARI RF between preindustrial and present-day is -0.35 +/- 0.5 W/m² (Boucher et al. 2013). As an example, Figure 4 a displays the estimate of the direct RF from 1850 to 2000 from changes in emissions of aerosols from fossil fuels and biomass burning using an Earth system model (NorESM; Kirkevåg et al., 2013). The effect of aerosols changes via BVOCs and aerosol formation through land-use and climate effects are not included in those calculations. a) b)
Figure 4: NorESM estimated annual a) ARI (direct) and b) ACI (indirect) top of the atmosphere SW RF. The global mean values are -0.08 W/m² and -1.2 W/m², respectively. Taken from Kirkevåg et al. (2013).
2.3.2 Estimates of anthropogenic RF through aerosol-cloud interactions (ACI)
The IPCC reports (IPCC, 2013) the RF from ACI from preindustrial to present-day to be -0.45 W/m² with a 90% uncertainty range between 0.0 to -1.2 W/m². For a constant cloud liquid water mass, an increase in soluble aerosol number causes a larger fraction of them to activate as CCN, resulting in more droplets of smaller sizes. This has two effects:
1) A larger number of smaller spherical droplets causes a larger surface area and larger optical thickness. This makes clouds brighter, reflecting more incoming solar radiation back to space and causing a net negative RF on TOA (Twomey, 1977). This is called the cloud albedo effect or first indirect effect.
2) A larger number of smaller droplets reduces the efficiency of the collision coalescence process between cloud droplets, delaying precipitation of rain drops and making the clouds more long-lived. This process also causes a net negative RF on TOA (Albrecht, 1989). This is called the cloud lifetime effect or second indirect effect.
The third indirect effect of aerosols on warm clouds is known as the semi-direct effect. Absorbing aerosol particles activated as cloud droplets cause evaporation and make the cloud lifetime and their brightness lower causing a net positive RF on TOA. Figure 4 b depicts a climate model estimate of the ACI RF (indirect effect) from 1850 to 2000 from changes in direct emissions of aerosols from fossil fuels and biomass burning.
3. Methods/Approach
This thesis is based on results from numerical models. In Paper I, the models MEGAN and LPJ-GUESS were driven by past millennium climatic conditions, carbon dioxide concentrations and land-use changes to study individual and total effects of changing drivers on isoprene, monoterpene and sesquiterpene emissions. Each model uses empirical emission factors at standard conditions for different types of vegetation. Land-use changes are represented in the models by forcing existing anthropogenic crops and pasture reconstructions that change with time, and directly replacing the standard emission factors of the replaced natural vegetation species with those of anthropogenic species. Variations in leaf temperature, downward solar radiation, soil moisture and leaf area index modulate the magnitude of emissions using empirical factors that multiply the standard emission factor and affect the emissions at each timestep. Due to contradicting findings regarding the effects of carbon dioxide concentrations on monoterpene and sesquiterpene emissions, carbon dioxide concentrations were allowed to inhibit only isoprene emissions in both models.
Using the estimates from paper I, a global chemical transport model is used to estimate the chemical processing of emitted BVOCs, their effect on SOA formation, and the RF through changes in ARI and ACI. The RF is estimated by forcing the same meteorology on each all runs. Therefore the changes in circulation or precipitation induced by changing BVOCs are not accounted for. The global chemical-transport model GEOS-Chem-TOMAS uses prescribed present day meteorology from reanalysis (GEOS5 - http://gmao.gsfc.nasa.gov) and has a 4º X 5º horizontal resolution with 47 vertical levels. The aerosol size distribution is described by 15 size sections raging from 3nm to 10μm. All aerosol and gas emissions except for terpenoid BVOCs were prescribed (van Donkelaar et al. 2008) and oxidant fields were kept fixed at present-day values. Decadally averaged terpenoid BVOC emissions at the beginning and end of past millennium from paper I were read as monthly files and were the only variables changing between different pairs of model runs (More details about all runs are found in Paper II). Isoprene, monoterpene and sesquiterpene oxidation products form non-volatile SOA at fixed yields of 3%, 10% and 20% respectively, based on findings by Pye et al. (2010). Particles are assumed to undergo kinetic, gas-phase, diffusion-limited growth where condensation of SOA is proportional to the aerosol surface area.
4. Presentation of papers
4.1 Paper I: Global emissions of terpenoid VOCs from terrestrial vegetation in the last millennium Between 30% and 50% of the land cover of the Earth has been modified by humans (Vitousek, 1997), making land-use change a clear signature of human influence on the planet. Although the majority of this change has happened during industrial times, about one third of natural vegetation loss between years 1000 and 2000 was caused by the replacement of natural vegetation by agricultural plant species and took place between year 1000 and 1800 (Kaplan et al. 2010). Typically, replaced forests have much higher emissions levels of isoprene, monoterpenes and sesquiterpenes (terpenoid BVOCs) than crops and pastures affecting directly the amount of these compounds released into the atmosphere. In addition to land-use, plant emissions are sensitive to leaf temperature, solar radiation, soil moisture and atmospheric carbon dioxide concentrations, all this variables have been altered by human activities.
The study's specific objective was to answer the following questions:
1) How did changes in land cover, meteorological conditions, and carbon dioxide concentrations affect the terpenoid BVOC emissions in the past millennium?
2) What caused the change in emissions of each compound group?
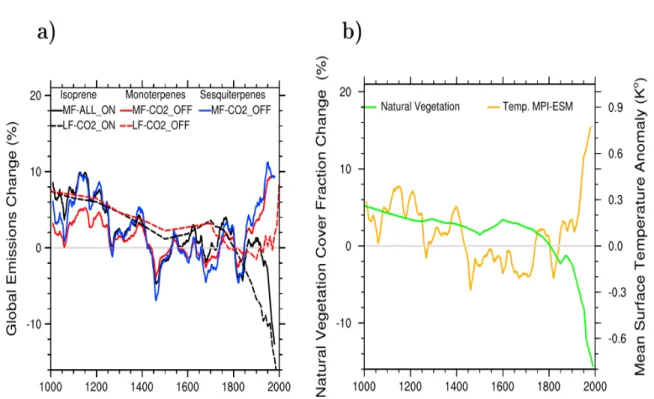
3) How well do estimates agree between the Model of Emissions of Gases and Aerosols from Nature (MEGAN) and The Lund-Potsdam-Jena-General Ecosystem Simulator (LPJ-GUESS)? Figure 5 a shows the best estimates of isoprene, monoterpene an sesquitepene emissions as deviations from the Little Ice Age mean (LIA, between 1750-1850), and Figure 5 b shows the same for two of the driving variables: surface temperature and natural vegetation cover. Isoprene emissions were higher during the Medieval Climate Anomaly (MCA, between 1000-1200) than during the LIA by 6.5% to 7.5% (depending on model), whereas during the end of the 20th century
(1970-1990), the emissions were lower by 12.6% to 15.1% than during the LIA. Deforestation and the inhibiting effect of carbon dioxide (in industrial times) were the main drivers of millennial isoprene emissions changes, whereas global cooling and deforestation were the main cause of isoprene emissions decrease before 1750. The case of monoterpene emissions changes is radically different than isoprene emissions after the industrialization. There is a decrease of 3.2% to 7.3% between the MCA and the LIA driven by deforestation and cooling similar to isoprene emissions, whereas monoterpene emissions increase from the LIA to the end of 20th century by 1.6% to 9.8%
with surface air temperature dominating over land-use changes. The sesquiterpene emission changes (estimated for MEGAN only) are similar qualitatively and quantitatively to monoterpene emissions.
Figure 5: a) Global emission deviation from mean (1750-1850) of isoprene in MEGAN (solid black line) and LPJ-GUESS (dashed black line), monoterpenes in MEGAN (solid red line) and LPJ-LPJ-GUESS (dashed red line), and sesquiterpenes in MEGAN (solid blue line). b) Deviation from mean (1750-1850) of natural vegetation cover fraction (green line), and modelled mean surface temperature (yellow line).
The relative changes in BVOC emissions are similar between both models. However, the global emissions were about twice and three times larger in MEGAN than in LPJ-GUESS for isoprene and monoterpenes, respectively. Such a large discrepancy reflects the uncertainty in emission models, presumably caused by a lack of long-term observations of BVOC emissions in different environments.
4.2 Paper II: Aerosol size distribution and radiative forcing response to anthropogenically driven historical changes in biogenic secondary organic aerosol formation
The millennial changes in terpenoid BVOCs estimated in paper I served as a starting point to evaluate the direct and indirect radiative forcing caused by changes in biogenic SOA, which was the main objective of paper II.
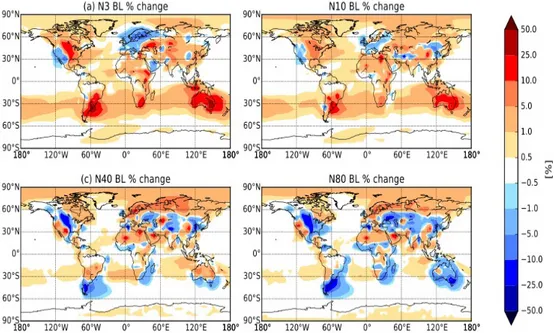
The chemical transport model GEOS-Chem-TOMAS was run with MEGAN emissions from 1000 and 2000, respectively and anthropogenic emissions off. Several changes in the aerosol size distribution are observed (Figure 6). Lower emissions of BVOCs (mostly over deforested areas) lead to an overall decrease (-0.6%) in CCN sized particles (particles larger than 80 nm, N80) between year 1000 and year 2000, due to less available condensing biogenic vapors. There is an increase of +3.2%, +1.9% and +0.4% in ultrafine (particles larger than 3 nm, N3), fine particles (larger than 10 nm, N10) and particles larger than 40 nm (N40), respectively. This is caused by lower condensation and coagulation losses of condensing vapors and small particles caused by fewer large (N80) particles. A net increase in BVOC emissions over the Boreal region, where less deforestation took place, leads to net increase in particles of all sizes due to larger available biogenic mass. When GEOS-Chem-TOMAS was driven with LPJ-GUESS emissions changing from year 1000 to year 2000 and anthropogenic emissions off, the relative changes in N3, N10, N40 and N80 were +5.9%, +3.5%, -0.1% and -1.8%, respectively. When MEGAN was run with emissions changing from year 1000 to year 2000 and anthropogenic emissions on and 100 Tg/year of additional SOA, the relative changes in N3, N10, N40 and N80 were +1.9%, +1.2%, 0.3% and -0.3%, respectively.
Figure 6: Annual mean percentage change from year 1000 to year 2000 in boundary layer concentration of particles larger than (a) 3 nm, b) 10 nm, c) 40 nm and d) 80 nm in diameter, respectively. Model run with MEGAN BVOC emissions and anthropogenic emissions off. Globally averaged, N3, N10 and N40 increase by 3.2%, 1.9% and 0.4%, respectively, while N80 decreases by 0.6%.
The optical properties of aerosols, including the effect of water uptake and hygroscopic growth are estimated from look-up tables. A radiative transfer model in GEOS-Chem-TOMAS is used to estimate the Aerosol-Radiation Interactions (ARI) and by comparing changes in ARI from a control and a perturbed run where only biogenic SOA is allowed to change, and the direct RF of millennial changes in terpenoid BVOCs is quantified (Figure 7 a, b).
Figure 7: Annual mean change from year 1000 to year 2000 in (a) direct RF with MEGAN BVOC emissions and anthropogenic emissions off, (b) direct RF with LPJ-GUESS BVOC emissions and anthropogenic emissions off, (c) cloud albedo RF with MEGAN BVOC emissions and anthropogenic emissions off, (d) cloud albedo RF with LPJ-GUESS BVOC emissions and anthropogenic emissions off, (e) combined radiative effect with MEGAN BVOC emissions and anthropogenic emissions off, and (f) combined radiative effect with LPJ-GUESS BVOC emissions and anthropogenic emissions off. Global mean changes are 0.065, 0.022, -0.020, -0.008, + 0.049 and +0.015 W/m², respectively.
Similarly, by directly estimating changes in the effective radii of cloud droplets as a function of changes in cloud droplet number concentration and fixed liquid water path, the radiative transfer model estimates the cloud-albedo aerosol indirect effect for low- and mid-level clouds assuming CCN activation at a global constant updraft velocity of 0.2 m/s (Figure 7 c, d). Generally, both ARI and ACI are larger when GEOS-Chem-TOMAS is driven with MEGAN emissions than when it is driven with LPJ-GUESS emissions due to larger changes in SOA mass and number, but many common features are still present. Lower BVOCs emissions lead to loss of SOA mass and CCN numbers over southeastern USA, southeastern South America, Central America, tropical Africa, central Eurasia in both models and causes positive direct RF over these regions. The indirect RF is less clear and, although negative, is smaller than the direct RF. Over oceans the indirect RF seems more robust using both models. The possible reason for having negative indirect RF over oceans is the increase in CCN sized particles above 800hPa due to larger amounts of fine particles that can grow to CCN sizes, despite of having a decrease of CCN numbers below that level. The combined direct and indirect RFs yield a clear pattern: deforested areas induce a positive RF above them due to less available SOA. However, this positive RF is small compared to other human-induced changes on aerosol emissions, globally it represents at most 13% of the anthropogenic RF in value, although opposite in sign.
5. Conclusions
This initial quantification of the anthropogenic effects on climate caused by changes in emissions of BVOCs in the past millennium reveals that regions with strong deforestation have the strongest impact on RF calculations when only aerosol properties are allowed to change. Furthermore, we obtain a larger direct than indirect aerosol effect, possibly as a result of the low solubility of organic aerosol. Lower BVOC emissions lead to lower aerosol formation and lower aerosol mass at climatically relevant sizes (particle diameter > 80 nm). This causes a reduction of aerosol optical depth and a positive direct RF. The effects on cloud albedo are less clear and contradictory between different emission sources (MEGAN or LPJ-GUESS) for many land regions. Over the ocean, the direct and indirect effects tend to cancel out each other. Both direct and indirect effects of biogenic SOA on climate in the past millennium are smaller than the RF caused by changes in fossil fuel and biomass burning emissions during industrial times. However, some regions could have a RF larger than +0.5 W/m². Our best estimate of total RF lies between +0.02 and +0.05 W/m². However, it would cancel only a fraction of the historical land-use surface albedo effect (-0.15 W/m², Myrhe et al. 2013). Hypothesis 1 defined in section 1 seems valid, but the effects are small.
There are small effects of land-use on global monoterpene (and sesquiterpene) emissions and a strong dependence on surface temperature changes. Isoprene on the other hand, presents a much larger dependence on land-use than on surface temperature during industrial times. Larger deforestation over low to mid latitude forests (isoprene emitters) than over high latitude forests (monoterpene emitters) are the main cause for this results. In LPJ-GUESS the isoprene emission reduction caused by higher carbon dioxide concentrations is significantly larger than in MEGAN and could also be an important driver in emissions changes in the last century of the past millennium. Thus, Hypothesis 2 seems to be valid only for monoterpene and sesquiterpene emissions, but not necessarily for isoprene emissions.
Despite of the increase in SOA over high latitude regions, the modeled RF is very small and positive in certain regions. For biogenic BVOC emissions to have a significant contribution on global climate via SOA formation, much larger emission changes must take place. Perhaps strong future warming over land could induce larger SOA formation, a significantly larger negative RF, and become a dominating natural negative feedback within the climate system. Our simulations do not allow us to fully answer whether Hypothesis 3 is true or not, because different environmental factors are changing simultaneously in our simulations. However, the regions with little deforestation, but temperature increase suggest that the feedback has little influence on the climate in the recent past.
6. Outlook
There are limitations in the results from the simulations with GEOS-Chem-TOMAS: 1) Organic compounds do not participate in the new particle formation process and only grow aerosols by irreversible condensation. Furthermore, isoprene and monoterpene oxidation products are treated in the same way. 2) Changes in BVOC emissions do not affect oxidant fields that could affect oxidation of other aerosol precursors (e.g DMS or SO2) or greenhouse gases (e.g. tropospheric
ozone and methane), making these feedbacks inexistent. 3) A fixed global updraft velocity is used to estimate the activation of CCN, giving supersaturation levels that are not necessarily realistic. 4) Additionally, only the first ACI effect (cloud albedo) is considered in GEOS-Chem-TOMAS and no aerosol-climate feedbacks are considered. Due to the limitations above, this thesis is a first approach towards understanding the radiative effects caused by changes in BVOC emissions. Robust regional responses, rather than absolute values are probably better indicators of the induced forcing.
In the future, the effects of biogenic SOA on climate will be further investigated in a more comprehensive model with isoprene and monoterpene chemistry (NorESM-MOZART) allowing changes of oxidants to feed back on changes in aerosol properties. Additionally, the formation of SOA will be refined to include the effect of ELVOCs on newly formed particles and the activation of CCN will depend on a modeled updraft velocity estimated from theory instead of a globally uniform updraft velocity. The model will also include the three ACI effects described in section 2.3.2, not only the cloud albedo effect, and the effects of BVOC changes will affect the meteorology in the model. The same model will be used to evaluate climate responses of past and future air quality control policies. By using the same model, this will allow us to evaluate more consistently the relative contribution of land-use effects on climate via SOA formation as compared to changes in aerosol emissions from biomass burning and fossil fuels.
Deeper understanding of the fundamental processes of biogenic plant emissions, their chemical processing and aerosol formation in the atmosphere, and their induced changes in ARI and ACI are necessary to improve numerical models and better understand the RF from changes in BVOC emissions. This requires future efforts from the experimental and theoretical communities in BVOC, aerosol, and climate research. Acknowledgements
I sincerely thank my main supervisor, Dr. Ilona Riipinen for her support, patience and for giving me the freedom to follow my “scientific instinct” during this last couple of years, but at the same the for giving me enough advice to not get lost in the process. Dr. Annica Ekman and Dr. Risto Makkonen, I thank You both for your time, guidance and valuable discussions that have allowed me to grow professionally. Professor H.C. Hansson, my unofficial supervisor, thanks for always having kind words and for the innumerable and motivating conversations on the science of climate and other interesting topics. Thanks to everyone at Luftlab, for making it a very special place to work at. Friends and colleagues at ACES, MISU and Helsinki University are also kindly remembered. Big thank You to my family, your support is the real fuel that keeps me going. I hope You get to read this part!
References
1. Albrecht, B. A.: Aerosols, Cloud Microphysics, and Fractional Cloudiness, Science (80-. )., 245(4923), 1227–1230, 1989.
2. Andreae M.O. and Rosenfeld D.:Aerosol–cloud–precipitation interactions. Part 1. The nature and sources of cloud-active aerosols. Earth-Science Reviews (2008).
3. Arrhenius S.: On the Influence of Carbonic Acid in the Air upon the Temperature of the Ground, Philosophical Magazine and Journal of Science. Series 5, Volume 41, April 1896, pages 237-276. 4. Boltzmann, L., "Ableitung des Stefan'schen Gesetzes, betreffend die Abhängigkeit der
Wärmestrahlung von der Temperatur aus der electromagnetischen Lichttheorie" [Derivation of Stefan's little law concerning the dependence of thermal radiation on the temperature of the electro-magnetic theory of light], Annalen der Physik und Chemie (in German) 258 (6): 291–294,
Bibcode:1884AnP...258..291B, doi:10.1002/andp.18842580616 (1884).
5. Boucher, O., D. Randall, P. Artaxo, C. Bretherton, G. Feingold, P. Forster, V.-M. Kerminen, Y. Kondo, H. Liao, U. Lohmann, P. Rasch, S.K. Satheesh, S. Sherwood, B. Stevens, and X.Y. Zhang, 2013: Clouds and aerosols. In Climate Change 2013: The Physical Science Basis. Contribution of Working Group I to the Fifth Assessment Report of the Intergovernmental Panel on Climate
Change. T.F. Stocker, D. Qin, G.-K. Plattner, M. Tignor, S.K. Allen, J. Doschung, A. Nauels, Y. Xia, V. Bex, and P.M. Midgley, Eds. Cambridge University Press, 571-657,
doi:10.1017/CBO9781107415324.016.
6. Buseck, P. R., & Adachi, K. (2008). Nanoparticles in the Atmosphere. Elements, 4(6), 389-394. 7.Ehn, M., Thornton, J. A., Kleist, E., Sipilä, M., Junninen, H., Pullinen, I., et al. & Mentel, T. F. (2014). A large source of low-volatility secondary organic aerosol. Nature, 506(7489), 476-479. 8. Guenther, A., et al. "Estimates of global terrestrial isoprene emissions using MEGAN (Model of Emissions of Gases and Aerosols from Nature)." Atmospheric Chemistry and Physics 6.11 (2006): 3181-3210.
9. Intergovernmental Panel on Climate Change (IPCC), Climate Change 2013: The Scientific Basis: Contribution of Working Group I to the Fifth Assessment Report of the Intergovernmental Panel on Climate Change, Cambridge Univ. Press, New York, 2013.
10. Jokinen, T, et al. "Production of extremely low volatile organic compounds from biogenic emissions: Measured yields and atmospheric implications." Proceedings of the National Academy of Sciences (2015): 201423977. 11. Kaplan, Jed O., et al. "Holocene carbon emissions as a result of anthropogenic land cover change." The Holocene (2010): 0959683610386983.
12. Kirkevåg, A., Iversen, T., Seland, Ø., Hoose, C., Kristjánsson, J. E., Struthers, H., Ekman, A. M. L., Ghan, S., Griesfeller, J., Nilsson, E. D., and Schulz, M.: Aerosol–climate interactions in the Norwegian Earth System Model – NorESM1-M, Geosci. Model Dev., 6, 207-244,
doi:10.5194/gmd-6-207-2013 (2013).
13. Merikanto, J., Spracklen, D. V., Mann, G. W., Pickering, S. J., and Carslaw, K. S.: Impact of nucleation on global CCN, Atmos. Chem. Phys., 9, 8601–8616, doi: 10.5194/acp-9-8601-2009 (2009).
14. Mie, Gustav (1908). "Beiträge zur Optik trüber Medien, speziell kolloidaler Metallösungen". Annalen der Physik 330 (3): 377–445. Bibcode:1908AnP...330..377M.
doi:10.1002/andp.19083300302
15. Myhre, G. et al. In Climate Change 2013: The Physical Science Basis (eds Stocker, T. F. et al.) Ch. 8 (IPCC, Cambridge Univ. Press, 2013).
16. Peñuelas, J., and M. Staudt: BVOCs and global change, Trends Plant Sci., 15(3), 133–144 (2010), doi:10.1016/j.tplants.2009.12.005, Issue: Induced biogenic volatile organic compounds from plants.
17. Pye, H. O. T., Chan, A. W. H., Barkley, M. P., & Seinfeld, J. H. (2010). Global modeling of organic aerosol: the importance of reactive nitrogen (NO x and NO 3). Atmospheric Chemistry and Physics, 10(22), 11261-11276.
18. Riipinen, I., et al. "Organic condensation: a vital link connecting aerosol formation to cloud condensation nuclei (CCN) concentrations." Atmos. Chem. Phys 11.8 (2011): 3865-3878.
19. Stefan, J., "Über die Beziehung zwischen der Wärmestrahlung und der Temperatur" [On the relationship between heat radiation and temperature] (PDF), Sitzungsberichte der mathematisch-naturwissenschaftlichen Classe der kaiserlichen Akademie der Wissenschaften (in German) (Vienna) 79: 391–428 (1879).
20. Trenberth, K. E., Fasullo, J. T., & Kiehl, J. (2009). Earth's global energy budget. Bulletin of the American Meteorological Society, 90(3), 311-323.
21. Twomey, S.: The Influence of Pollution on the Shortwave Albedo of Clouds, J. Atmos. Sci., 34(7), 1149–1152, doi:10.1175/1520-0469(1977)034<1149:TIOPOT>2.0.CO;2 (1977).
22. Unger, N. "Human land-use-driven reduction of forest volatiles cools global climate." Nature Climate Change 4.10 (2014): 907-910.
23. Van Donkelaar, A. , et al. "Analysis of aircraft and satellite measurements from the
Intercontinental Chemical Transport Experiment (INTEX-B) to quantify long-range transport of East Asian sulfur to Canada." Atmospheric Chemistry and Physics 8.11 (2008): 2999-3014.
24. Vehkamäki, Hanna, and Ilona Riipinen. "Thermodynamics and kinetics of atmospheric aerosol particle formation and growth." Chemical Society Reviews 41.15 (2012): 5160-5173.
25. Vitousek, P.M., et al. "Human domination of Earth's ecosystems." Science 277.5325 (1997): 494-499.
26. Yu, H., Y.J. Kaufman, M. Chin, G. Feingold, L.A. Remer, T.L. Anderson, Y. Balkanski, N. Bellouin, O. Boucher, S. Christopher, P. DeCola, R. Kahn, D. Koch, N. Loeb, M.S. Reddy, M. Schulz, T. Takemura, and M. Zhou, 2006: A review of measurement-based assessment of aerosol direct radiative effect and forcing. Atmos. Chem. Phys., 6, 613-666, doi:10.5194/acp-6-613-2006. 27. http://earthobservatory.nasa.gov/IOTD/view.php?id=1854