SGS LTER Annual Report 2011 (DEB 0823405)
Activities and Findings
The central research objective of the SGS LTER project continues to forecast potential impact of global climate change on the shortgrass steppe ecosystem in the western region of Great Plains of the United States. This system has exhibited remarkable persistence in a semi-arid temperate
environment characterized by high inter- and intra-annual variability in precipitation. The area is characterized by low-stature C4 grasses under a regime of grazing by large herbivores (e.g.
historically by bison, now primarily as rangeland for cattle). In eastern Colorado, the SGS ecosystem exists as a mosaic of land uses including native prairie, prairie recovering on abandoned farmlands (including lands enrolled in the Conservation Reserve Program (CRP)), ranchland, tilled and irrigated
farmland, and urban and exurban development. We work to forecast responses of the SGS ecosystem to global change, defined in the broadest sense to encompass multiple factors including climate, human land use, and invasive species. Our research incorporates historical perspectives on how ecosystem determinants acted in the past, and we work under a framework of an SGS that is experiencing change in the relative importance of determinants of ecosystem structure and function. In addition to completing measurement and data archiving from long-term experiments, we engage in scientific initiatives important to our region, and continue cross-LTER and global synthetic analyses of data.
Key to this work is a long-term and ongoing collaboration with scientists with the USDA-ARS Central Plains Experimental Range (CPER), the site where most SGS LTER work has been conducted. An additional memorandum of understanding with the Pawnee National Grassland in Weld Co. extends the SGS LTER site to include approximately 80,000 ha of public land under management by the USDA Forest Service. This annual report provides a summary of our A) Research Activities, B) Information Management, C) Education, Outreach and Training Activities, and D) Project Management.
This annual report is brief, since most of the activities are now supported on the newer SGS LTER grant from 2010 (DEB 1027319). This report mainly covers activities that have continued beyond the natural expiration date of the 2008 award, in part because funds have been received at inopportune times relative to the life of this particular award. The continuing aspects include a subcontract with the University of Wyoming and supplemental funding for i.) a cross-site social sciences initiative (MALS), ii.) a Research Opportunity Award (ROA) subcontract for vegetation mapping through the University of Northern Colorado, iii.) equipment (meteorological station upgrade), iv.) information management, v.) REU, vi.) RET, and vii) SLTER.
A. Research Activities
During the last year, we credited this project with 32 papers in refereed journals (published or in press), seven submitted refereed papers, one book in press, and eight book chapters published or in press and another submitted. Most of our publications involved multiple authors, reflecting the collaborative spirit and interdisciplinary nature of the SGS-LTER research program.
University of Wyoming: Ecosystem Phenology in the Shortgrass Steppe (Lynn M. Moore and William K. Lauenroth)
Introduction. Changing phenological patterns are one of the key signatures of climate change and for understanding how ecosystems respond to variable climates. In semiarid ecosystems such as the shortgrass steppe, the combination of surface reflectance measurements, derived vegetation indices, and climate data can be used to detail how the timing of plant growth is influenced by temperature and precipitation . This study aims to address how relationships between phenology, soil
temperature, and soil water influence the timing of springtime green-up and peak growth on the shortgrass steppe.
Methods. To identify community level patterns we calculated a greenness index from near-surface spectral reflectance measurements: Greenness = [(NIR-R/R+NIR)]
(Paruelo et al. 1997).
We acquired climatic data either on-site or from nearby weather stations, and include daily maximum, minimum, and mean temperatures (°C), daily precipitation (mm), and soil temperature
(°C). Soil water content was measured at three depths, (0-10 cm, 10-20 cm, and 20-30 cm), collected
hourly, averaged daily, and recorded as volumetric water content (VWC cm3/soil cm3).
We applied quadratic phenology models (de Beurs and Henebry 2004, 2005, Henebry 2005) to directly examine how thermal and moisture variables relate to greenness. We calculated accumulated soil growing degree days (ASGDD) by the Baskerville-Emin method (1969) with a base temperature of 0° C (Goodin and Henebry 1998). The basic quadratic regression model (Henebry 2005) for accumulated soil growing degree days is given as : GIgrow = α + βASGDD + λASGDD2 .
Peak growth as a function of soil temperature is determined by finding the maximum value of GIgrow. Greenup is defined as the number of soil growing degree-days required to reach peak growth and is calculated by:
To determine how phenology may be influenced by soil moisture, we calculated available soil water days (ASW) as follows:
ASW = 0, if SWC < Base; ASW = SWC – Base, if SWC > Base
The ASW per day is summed to arrive at accumulated soil water days (ASWD). The ASW base value used in this study is 87 mm water /30 cm of soil. The quadratic regression model for accumulated soil water content is given as: GIsoils = α + θASWD + δASWD2 .
Peak growth as a function of soil water is determined by finding the maximum value of GIsoils. Greenup as a function of soil water is defined as the number of available soil water days required to reach peak growth and is calculated by:
Results. Soil temperature was positively related to the greenness index (F2,297 =144.4; p<.001,
adj.R2=0.4895). Peak growth (GI
grow = 0.64) occurred on July 18, 2003 (DOY 199). The accumulated soil temperature required to reach peak is 1905 °C (Figure 1).
Soil water also had a positive relationship with GIsoils (F2,297 =104; p<.001, adj.R2=0.4079). Peak
growth (GIsoils = 0.62) occurred on May 15, 2003 (DOY 135). The accumulated soil water required to reach peak was 275 mm water/30 cm of soil (Figure 2).
Figure 2. Regression model of ASWD and GIsoils predicted values.
Discussion. Both the soil temperature and soil water data had statistically significant fits to
quadratic models. Considering the greenness index plotted across time (Figure 3), it is apparent that the fit of the quadratic models do not adequately represent the data across the entire year. The measured peak GI was 0.78 and occurred on June 16 (DOY 167). The quadratic models estimated the peak GI that is lower than the data and almost one month earlier (soil water quadratic model, DOY 135 ) and one month later (soil temperature model, DOY 198). The soil temperature quadratic model is parabolic in shape whereas the soil water quadratic line is not. The adj.R2 values
for each quadratic model was less than 50% suggesting the need for additional explanatory variables or an interaction effect.
Figure 3. Graph of GI values and the quadratic regression models for both the soil temperature (red) and soil water (blue) across one year. DOY = day of year.
Literature Cited
Baskerville, G. L. and P. Emin. 1969. Rapid Estimation of Heat Accumulation from Maximum and Minimum Temperatures. Ecology 50:514-517.
de Beurs, K. M. and G. M. Henebry. 2004. Land surface phenology, climatic variation, and institutional change: Analyzing agricultural land cover change in Kazakhstan. Remote Sensing of Environment 89:497-509. de Beurs, K. M. and G. M. Henebry. 2005. Land surface phenology and temperature variation in the International
Geosphere-Biosphere Program high-latitude transects. Global Change Biology 11:779-790.
Goodin, D. G. and G. M. Henebry. 1998. Seasonality of finely-resolved spatial structure of NDVI and its component reflectances in tallgrass prairie. International Journal of Remote Sensing 19:3213-3220.
Henebry, G. M. 2005. A statistical framework for the analysis of long image time series. International Journal of Remote Sensing.
Paruelo, J. M., H. E. Epstein, W. K. Lauenroth, and I. C. Burke. 1997. ANPP estimates from NDVI for the Central Grassland Region of the United States. Ecology 78:953-958.
Cross-site Analysis: Social Sciences
Maps and Locals (MALS): A Cross-Site LTER Comparative Study of Cover and Land-Use Change with Spatial Analysis and Local Ecological Knowledge
(Michael Brydge and Bill Parton)
Rationale. Understanding the dynamics of social–ecological interactions and organizing system-wide investigations through comparative analysis of LTER sites are key objectives of the ISSE Decadal Plan. These objectives address a grand challenge for both applied and theoretical ecology of discerning past human effects on ecological systems and distinguishing anthropogenic from non-anthropogenic drivers of change. Although most LTER sites have assembled historical data on land cover, climate,
vegetation, and other ecological attributes, less is known about historical resource management practices and other human influences. In many cases social data are available for human
communities of LTER regions, but are not well compiled. Local ecological knowledge (LEK) from long-time residents and users of landscapes provides an additional source of insight which has the potential to add to LTER studies, but methods for documenting and integrating such data into ecological research remain poorly developed and a subject of debate. The objective in this collaborative research project is to
develop methods and capacity for research into Social-Ecological Systems both at individual sites and at the network scale.
Interviews and Results. The MALS project at the SGS entails qualitative analysis of direct interviews with 25 farmers and ranchers in Weld County, Colorado, who are currently under
contract with the federal government to receive payments to neither farm nor ranch lands under the Conservation Reserve Program (CRP). The research was driven by the question: What will happen to the currently enlisted CRP land when the CRP contract expires? Responses from this question, along with
other questions asked during in person interviews, were used to more fully understand what will happen to CRP land in the future. More specifically, responses from the interviews led to understanding of factors that influence decision making among farmers and ranchers in Weld County in the region directly surrounding the site of the SGS LTER project.
The table summarizes typical data from those who agreed to interviews, in this case comparing how rancher/farmer age influences CRP enrollment (in acres) relative to dry land farming and grazing.
60 and Younger (n=9) 61 and Older (n=16)
Own Lease land Dry Ranch CRP Own Lease land Dry Ranch CRP Average 4,383 13,945 4,717 13,977 1,264 2,437 1,457 966 1,215 1,113
Median 2,500 3,000 2,200 1,801 900 2,630 820 320 1,060 1,125 Range
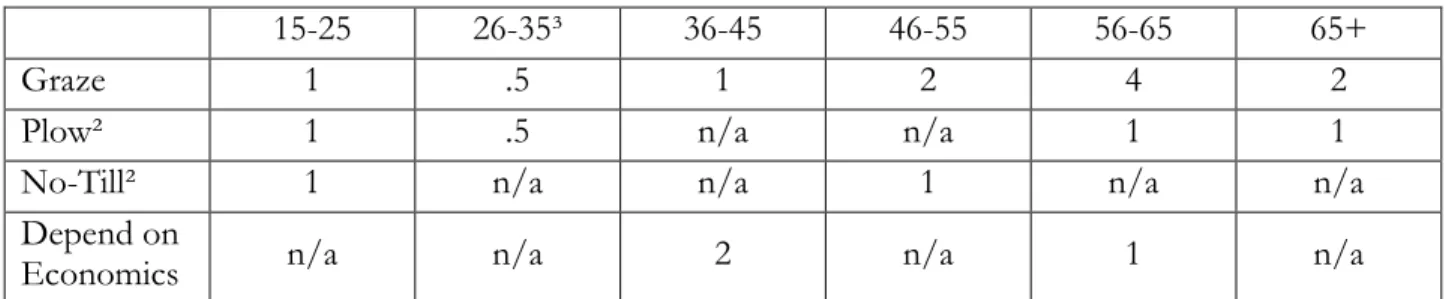
274-To the question of how would land use change after cessation of the CRP program, responses relative to the length of time that ranchers/farmers have continuously lived and worked at the same site were as follows:
Table 1.7 Plans for CRP Land after Program’s End, and Years Spent on the Land³
15-25 26-35³ 36-45 46-55 56-65 65+
Graze 1 .5 1 2 4 2
Plow² 1 .5 n/a n/a 1 1
No-Till² 1 n/a n/a 1 n/a n/a
Depend on
Economics n/a n/a 2 n/a 1 n/a
¹Plans were assessed by responses to the question: What are your plans when the [CRP] contract expires? Years spent on the land was assessed by responses to the questions: How many years in farming [or ranching], Have you farmed [or ranched] all your life, and On the same property?
²The terms plow and no-till should be considered long term land use practices. Even if farmers plan to run an operation on former CRP land, it must first be plowed to soften the soil for the no-till drill implement.
³The sole participant in this category would graze some land and plow some land.
This study exemplifies the growing importance of qualitative analysis and assessments of
communities to better understand the influences which dictate individual decision making within agricultural communities. Furthermore, ground truthing by interviews provides a community voice into future national, regional and local legislation processes that have lasting economic, social, and environmental effects on local populations.
The analysis of interviews provides information about several influencers that dictate land use and management practices in Weld County. It appears that academic education played no role in the adoption of certain land use practices or management plans (most with some university education, one with MS). However, at least 7 influencers emerged from this study. These influencers, in part dictate what will happen to CRP land when the contract expires, providing multiple answers to the original research question.
1.) Land productivity, including erosion and poor soils were reasons for farmers and ranchers to
originally enroll land in CRP.
2.) Farm programs, such as CRP, dictate decision making. Though many farmers commented on
the social and cultural devastation caused by CRP allotments in their communities, all participants had land in CRP. Additionally, CRP has contributed to keeping land in a permanent no-till state as illuminated by the farmers and ranchers who refuse to plow land coming out of CRP and prefer to graze the “good stand of grass” that CRP has rejuvenated. Thus CRP has social, economic, and environmental implications.
3.) Perhaps the greatest influencer was age, which was associated with several other influencers. The
interconnected aspects of age and economics provided insight into motivations. Participants in the 61 years and older category based decisions on their declining physical productivity (something we all must face), declining technological productivity as a result of outdated equipment, and environmental concerns. On the contrary the younger generation of farmers were driven more so by economics. Everyone in this world is involved with the accumulation and distribution of goods and or services. However, it appears that the younger farmers, possibly due to the burdens or blessings of loans, property, family, and growing a viable business, make decisions based on economic necessity or financial accumulation much more so than their older counterparts.
4.) Age and the different practices of dry land farming and grazing influenced decision making.
Younger farmers prefer to farm out coming CRP land while the older generation prefers to graze it. This could be due to several factors including but not limited to: younger famers already own
ample amounts of grazing land (they own much more ranch land than do the older generation farmers) and the aforementioned issue of age and the complications of farming.
5.) Similar to dry land farming or grazing, age was associated with tillage practices as well. Though
minimum till and less conventional methods were employed by almost all farmers in this study, no-till was utilized more so by the younger generation of farmers. Participants older than 61 were least likely to adopt practices such as no-till due to the financial burden associated with purchasing new and updated equipment and the physical burden of dry land farming.
6.) Also associated with age, was years to retirement. Several farmers and ranchers in this study
enrolled land in CRP solely so they could decrease their work load, maintain a guaranteed income, and prepare for retirement. Also, drawing closer to retirement, farmers and ranchers find it economically infeasible to upgrade technology or increase technological capacity.
7.) Perhaps more obvious is the role of experience as a decision making influencer. A lifestyle or
family heritage, which 20 participants signified as motivations for their operation, is not only an obligation, but an education, and often an enjoyable one. Time spent learning the ins and outs of growing food sources comes with the hard times, as lamented by one old timer who stated:
Your cattle and farming together, you might hit one year out of four or maybe five that you made a profit on both but otherwise one kind of offset the other. You get hailed out or the cattle market wasn't worth a darn. I can remember sellin’ cattle for 29 cents per pound. You bought ‘em for that and you sold ‘em for that. However, freedoms associated with the agricultural lifestyle, gained through experiential learning are a benefit as boasted by one participant from east of Grover who explained that he and his son would always run cattle because “that’s what we do.”
Other important information that would merit further research or may be vital in understanding areas which need to be researched include:
1. land tenure of farmers and ranchers in Weld County,
2. participant perceptions of bureaucratic CRP mismanagement and participant perceptions of inefficient use of the program by other farmers and ranchers, and 3. climate change and the discourse across different cultural, political and socio- economic groups.
Research Opportunity Award
(Scott Franklin, University of Northern Colorado)
Original Scope of Work. - Classification of vegetation provides an inventory to assess change, a common language to compare communities with other LTERs, and a baseline for land stewardship decisions. Several initial efforts toward mapping and vegetation data collection have already been started, but not a structured community analysis and subsequent mapping. The initial phase of this project would use the thousands of previously collected plot data to develop a vegetation
classification. Data will be analyzed using a variety of classification and ordination techniques to determine the most parsimonious classification system and subsequently compared to the National Vegetation Classification Standard (NVCS) at both the Alliance and Association levels. Any new Alliances or Associations will be proposed for modification of the NVCS. All plot data will be input into VEGBANK for anyone to use. The classification will be related to environmental factors on the landscape and mapped in GIS. We expect a gradient-driven distribution of vegetation that is related to a complex of environmental factors, including soil characteristics and topographic characteristics. Environmental data (soil type, aspect, slope position, disturbance history) will be related to vegetation classification groups.
Several questions linger in regard to transferring the NVCS to mapping units, including appropriate scale that often depends on the research or management question. We will map the vegetation at the Alliance, Association and Group levels to determine which is most appropriate and for what
questions. Despite previous efforts, parts of the area may have been missed by previous sampling, so mapping of plots will be used to determine further sampling efforts to fill in gaps. Subsequent sampling of additional plots will be the second phase of this study, and these plots will be used to examine the efficacy of the classified Associations and Alliances and their mapped units, thus validating the classification.
Progress on Scope of Work. We have compiled various abiotic GIS data sets (see maps below) and a land-type classification. We used this classification to develop a stratified sampling of areas, based on an east-west gradient in elevation and precipitation, parent geology, and soils. Within each land type, plots are being sampled along the range of topographic position and aspects. A total of 70 plots locations have been found and data from 17 plots has been collected using the Carolina Vegetation Sampling protocol. It is obvious that we will need another summer to complete data collection.
Nicole Kaplan forwarded previously-collected plot data from a plover study. We will lay the GPS coordinates of these plots on the GIS maps to determine where data collection is complete versus where additional plot data are needed for the classification.
In addition, we are now collaborating with David Augustine (USDA-ARS, CPER) in his efforts to classify aerial photographs of shrub cover for the CPER.
Meteorological Station Upgrade
(Mark Lindquist)
We upgraded and improve our aging weather station which has been in service for nearly 30 years. With our emphasis on responses to climate change, these improvements will allow us to continue our long-term research with a solid and reliable weather monitoring station in place. These upgrades will improve the reliability of our measurements and decrease the incidence of missing data due to instrument problems. New instrumentation improves our compatibility with data collection by the ARS on other parts of the CPER. We purchased the instruments listed below (some replacement parts for the future) as well as supports and cables to house them at our existing met station. Micrologger
Anemometers (3) Wind direction sensor Rain gage & wind screen Temperature probes (4) Long & short wave radiometer Pyronometer
Temperature/RH probe & solar shield Barometer
Evaporation gage and pan ML2x Theta probe (4)
B.) Information Management 2008-2011
(Nicole Kaplan, Information Manager and Bob Flynn, GIS and IT Manager)
Over the past few years, the work of SGS-LTER Information Management Team (IM Team) was focused on improving the quality of datasets for better integration and on enhancing spatial data layers for location of study sites and data analysis. We performed data aggregation and synthesis, and implemented LTER standards and best practices as we generated value-added data products as tabular data, databases, and metadata packages. We processed field data and samples, and
geographic spatial data to streamline research planning, data flow and metadata generation. Other IM goals focused on improving access to and linkages between information and data online and thus launched a new SGS-LTER website (http://sgslter.colostate.edu) in January 2009. We implemented collaboration technology that afforded us the opportunity to coordinate research activities, report findings, and conduct proposal writing among principal investigators located across the west, and in “nuts and bolts” meetings allowed field support staff and principal investigators to contribute to improvements in the quality of data and metadata content. We also participated in various LTER Network-wide and cross-site efforts and have contributed to the SGS-LTER 2010 Renewal Proposal, the LTER Strategic Plan, LTER Strategic Communications Plan and development of a Terms of Reference to address governance needs for the Information Management Committee. Our work on integrating datasets from the SGS-LTER and other sites across the Network supported analysis of long-term records of plant production, species composition, and
meteorological measurements in disturbed, grazed and burned areas to describe dynamics occurring at larger temporal and spatial scales. We extended existing GIS programs for analysis of SGS-LTER data, for example to study the movement of swift fox, visualize precipitation patterns across the greater region of the shortgrass steppe, model soil properties using satellite imagery, and summarize growth patterns of individual plants within a square meter over ten years.
We implemented a new SGS information management system that was redesigned to document, generate, and submit metadata in the Ecological Metadata Language to level 5. Over the past two years, we have successfully generated EML metadata packages and submitted them to the LTER Metacat, a metadata catalog accessible by the broader ecological community to facilitate data
discovery and access. On the frontend website, we created more links between related information. We integrated information on our proposed research areas with links to download associated core datasets that enabled understanding the SGS ecosystem as represented in our current conceptual framework.
The new design and behavior of the SGS-LTER website is the result of a collaborative effort between LTER staff, researchers, and web development professionals at the Colorado State University (CSU) Creative Services. Results from ease of use studies and recommendations
developed by the LTER Information Management committee were taken into consideration during the development process. Staff and researchers contribute content regularly to new sections of the website, which were designed to share current events, accomplishments, and images from the field. A new menu allows users to navigate through the rich content of the website and provides access to datasets and publications from various sections of the website.
The new maps section of the website contains various maps in PDF format that show physical features of all the research areas of the SGS-LTER. New PDF maps of historical grazing treatments of the Central Plains Experimental Range from 1991 to the present are available as well. The maps section also includes a new interactive mapping tool that allows users to view and print maps that
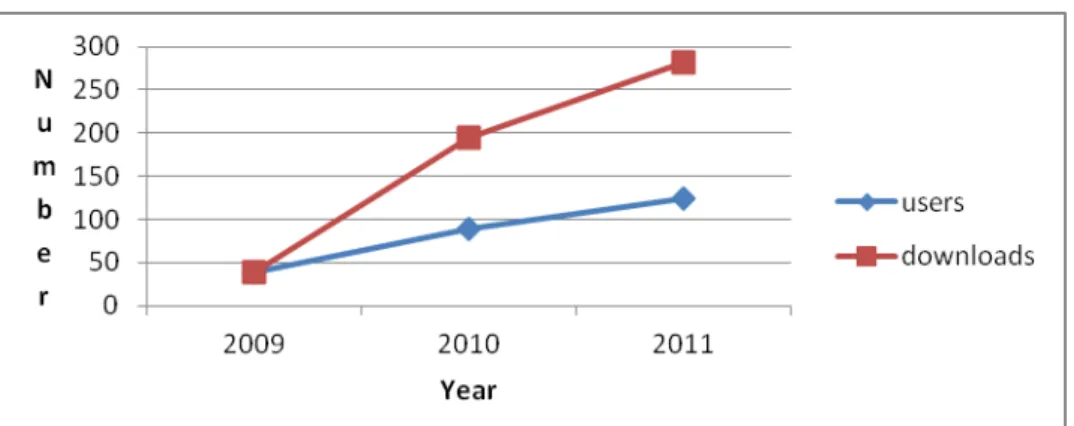
they customize by making different layers visible. It uses a standard map server tool called ArcGIS Server which simplifies map development and maintenance. We also implemented tools locally to collect and analyze information about end-users downloading specific datasets. Registered data users receive a thirty-day pass to download data from the website and data downloads were reported to the information managers in an email and inserted in the database. The data access tracking system was implemented in April 2009 and over time users registering with our site and the number of datasets that were downloaded increased significantly (Figure 1).
Figure 1. Registered end users of SGS-LTER data and the number of datasets they downloaded increased significantly between April 2009 and July 2011.
An installation of Google Analytics provided us with different information about visitors, including from where and how they are visiting the website. Most of our visitors are from Colorado, but we had visitors from every state in the United States, as well as from seventy-five other countries or territories. We also count hits from our home institution, CSU, and other institutions such as the US Forest Service, National Park Service and National Science Foundation. Google Analytical tools gave us the opportunity to learn about the characteristics and behaviors of our visitors. Other new technologies supported collaborations between SGS-LTER and network community members. Researchers planned and discussed progress of new experiments in a blog that we implemented with controlled access using WordPress. Four units of video teleconferencing allowed virtual meetings at the site and across the Network.
We contributed to cross-site efforts as well as network-wide projects and the development of community resources. We participated on the design team for the Grasslands Data Integration Project (GDI), resulting in an integrated database containing over one hundred thousand ANPP species level data from seven sites and lead an All Scientists Meeting workshop in 2009 on the GDI. Bob participated in cross-site working groups, including the MALS and Land Fragmentation
projects. Nicole served a three-year term as co-chair of the IM Committee (IMC), co-lead the governance working group for the IMC, participated in strategic planning activities for education and outreach, and communications for the LTER network, and attended the 2010 Science Council meeting.
C.)
Education, Outreach, and Training Activities (2010-2011) Research Experience for Undergraduates (REU):During the summer of 2010 we supported two REU students.
Leslie Herington, California State University – Fullerton, worked with Dr. Paul Stapp and graduate student Sean Hauser investigating the effects of herbicide application on small mammals on the shortgrass steppe in Colorado. Some of her findings were published this year: L. Herington and P. Stapp (2011) Effects of cactus removal on grassland rodents. Dimensions (CSUF Undergraduate Research Journal) 13:49-53. Leslie presented her work at the American Society of Mammologists
meeting in Portland, OR this summer.
Kristina Halliman (State University of New York at Fredonia) worked with Dr. William Lauenroth and graduate student Kerry Byrne investigating the effects of rainfall variability on the production and distribution of roots in two North American grassland ecosystems. Analysis of the samples collected is still underway.
Results from two previous REU student projects have been published in the past year.
Tyler Benton was an REU participant in 2008, as well as a SLTER student several years earlier. Information on his REU work can be found in: S.M. Munson, T.J. Benton, W.K. Lauenroth and I.C. Burke (2010) Soil carbon flux following pulse precipitation events in the shortgrass steppe. Ecological Research 25:205-211.
Christine Byrne was an REU in 2009. Results of her project are part of this report: Byrne, K.M., W.K. Lauenroth, P.B. Adler and C.M. Byrne (2011) Estimating aboveground net primary production in grasslands: A comparison of non-destructive methods. Rangeland Ecology and Management
64(5):498-505.
We are currently supporting several students in a cooperative project establishing a common garden on the Colorado shortgrass steppe. This summer’s collections went very well but results will not be available for some time.
Teacher Professional Development 2010-2011: The SGS-LTER has maintained strong
partnerships with K-12 schools in eastern plains and Front Range of northern Colorado. During 2010-2011 we continued the efforts reported in our 2010 annual report and we expanded our work to include efforts that are more teacher-centric in terms of professional development. These also will be reported on in the report for award DEB 1027319.
RET supplemental funding
Additional teachers will be in the field in 2012. More details on their projects will be provided in the 2012 report.
Zachary Sylvain, Effects of Soil Moisture on Soil Animal Communities Mary Jansen-Hedrick, Winograd School, 6th grade
While out in the field with Mary during summer of 2011, we repaired the infrastructure for one of my experiments and conducted field sampling for my project. The repairs entailed rebuilding a rain-exclusion shelter that had fallen due to high winds, as well as minor pre-emptive maintenance on the other shelters used in the experiment. Once repairs were finished, we collected 10 cm soil cores to extract mites and nematodes for identification and enumeration. During an additional field trip in
the autumn, we once again completed minor repairs to the shelters and disassembled them for the winter, and collected additional soil cores for mite and nematode extraction.
Kerry Byrne, Non-destructive ANPP and species composition techniques Jennifer Parrish, Union Colony Middle School
During late July, 2011, we conducted non-destructive ANPP measurements using the radiometer method, clipped some plots for calibration, and collected soil cores. We did species composition measurements as well. Samples were dried and weighed and then sorted in the lab providing Jennifer with experience in field sampling and lab processing.
Schoolyard LTER 2010-2011
The SGS Schoolyard LTER initiative is based on a partnership between the SGS-LTER, Colorado State University, The University of Northern Colorado, Greeley School District 6, and the Poudre School District. The partnership is supported by the SGS-LTER and coordinates several other grant initiatives. The projects listed below were designed by the teachers at our partner schools and supported through the SGS-LTER and our MSP program. The teachers and students developed proposals for the work over the summer of 2010. Funds from the Schoolyard supplement were used to support the efforts. The reports we presented below were prepared by teachers from each school.
Franklin Middle School
Teachers: Steve Linkous, Rebecca Ramirez, Aubrey Tate
Project goals this year are to provide opportunities for students to engage in lessons which will help them understand how to conduct investigations, independently and in groups/teams. We will also provide students with hands-on explorations with plants utilizing a greenhouse which was pre-fabricated last year at Maplewood Middle School and is ready to be installed at the school grounds of Franklin Middle School. As the schools merged, a decision was made not to put the greenhouse up and then have to take it down again, so it is new and ready to be made available to all of the science teachers and students in our building (6th -8th grade). We will also provide students with an
ecology unit through an after-school science enrichment program and provide students an opportunity to gain a better understanding of biodiversity of any given ecosystem and why it is important in our world.
Greeley West High School Teacher: Kelly Longacre
Students learned research techniques and practice them in authentic nature setting. The students also learned why Greeley West Park has been made into natural area and what features define natural area and watersheds. During this activity, students developed skills in recording, collecting and analyzing data, including the use of tables, graphs, and Microsoft Excel spreadsheets. They also learned basic concepts in plant taxonomy, mapping, surveying, soil nutrients, water quality, and invasive plant species. Finally the students completed an Agriscience Fair application and booth for the state contests.
John Evans Middle School Teacher: Donna Stevenson
The 7th grade Life Science students gathered phonological data on 3 plant species on the grounds of
John Evans Middle School. They will also gather daily weather data and recorded it using a wireless weather station. In addition to data gathering they also documented phenological changes using
cameras purchased from the grant. This will continue through the whole fall season. We then did the same thing starting in spring. Students made observations and documented phenological changes until the plant species fully leafed out. Students shared their data with the National Phenology Network and also created a web site to display the data and photographs that they have gathered.
Preston Middle School
Teachers: Erin Panozzo, Mary Hunter-Lazslo
The goal of this research project was to have students at Preston Junior High School engage in scientific discovery through field experimentation, where the steps of scientific inquiry are modeled and practiced. The project helped students explore the biological diversity of a riparian corridor, as well as make them aware of the factors that affect biological diversity, including human impact. The project will had three component parts, divided by grade level: Sixth grade explored decomposition of plant materials and the organisms involved. Seventh grade students investigated stream biological diversity and adaptation, while eighth grade students investigated plant diversity and invasive species in a restoration project. The project also has a long-term impact; both projects will study the
biodiversity of the same region, which will allow students to form connections between habitat type, environmental variables, and the diversity of the stream and the grasslands.
Seventh grade field research was conducted at the Environmental Learning Center (ELC) in Fort Collins, Colorado and at the Preston Pond, water retention and irrigation pond just south of Preston Middle School. The eighth grade field research is a restoration project at the Preston pond, and the sixth grade project looked at decomposition using leaf litter-bags at different microenvironment around the school.
Union Colony Middle School
Teachers: Cathy Hoyt, Jennifer Parrish
Our goal at Union Colony Schools was to initiate school-wide compost and recycling program. Through this program we wanted to educate staff and students about the benefits of composting and recycling. Students and staff had expressed interest in beginning a recycling program so we consulted with Clean Air Compost, a local company whose objective is to support our school and community efforts in sustainability by significantly lowering the amount of trash our school produces and diverting our waste to produce a valuable resource-compost. Clean Air Compost provides student and teacher education and awareness of what can be composted and how to properly divert compostable materials, the positive environmental impact of diverting waste from landfills, and the value of compostable waste as an important resource and crucial nutrient source for local agriculture, farming, and streamside restoration. Clean Air Compost also provided bins for recycling paper and other recyclable materials at no charge when we use their composting service. Clean Air Compost provided consultation and support regarding in-house collection of
compostables, including how to set up a system in our cafeteria that is conducive to composting for a large number of students. They also provided Union Colony with containers lined with
compostable liners to collect compost and picked up the bins on a weekly basis. Lastly, they
provided classroom teachers with a monthly report on Union Colony’s total compost production by the pound and what that equates to in greenhouse gas reduction from the landfill.
Union Colony Schools is the first school in Greeley to try to implement a school-wide composting program. Our hope is that the program will is able to be continued past the pilot program and
become an integral part of our school. As other schools in the community see the benefits and feasibility of composting they may also try to adopt a composting program in their schools.
Cross-LTER Site Education Initiatives
The SGS-LTER site has maintained the cross-site initiatives reported last year and expanded its cross-site initiatives to include other LTER sites and share its models with them. The SGS-LTER has initiated the following partnerships, some of which have been discussed above:
• NSF MSP 2008-present: Culturally relevant ecology, environmental literacy, and learning
progressions. (BES-LTER, KBS-LTER, LNO-LTER, SBC-LTER, SGS-LTER). Designed to
study the learning progression that students from different backgrounds undergo to understand of ecological concepts (see description presented above).
• USDA AFRI SPE 2009-present: Summer Soil Institute: Addressing Environmental Challenges with Current and Emerging Techniques from Microbial to Global Scales (SGS-LTER, MCD-LTER). Designed to develop modules with field and laboratory protocols that focus on soil chemistry, soil physics, and soil biology for undergraduate and graduate
instruction and for K-12 teachers in K-12 classrooms.
• NASA CCE 2010-present: The goals of the NASA Climate Change Education grant are to (1) improve the science content knowledge and preparedness of middle and high school teachers, (2) increase the science content knowledge of middle and high school students, (3) increase the awareness, opportunities and participation of middle and high teachers in content-based professional development activities, and (4) Broadly disseminate our model to districts across the country. NASA MODIS, Landsat, GIMMS, and Okinos or DigitalGlobe data sets will be used to develop modules that are aligned with science content standards for integration into K-12 courses. We will scale-up by providing training to PD providers from the 26 NSF LTER sites (www.lternet.edu) so that they can adapt the modules to their regions.
D. Project Management
Project management at SGS LTER continues as it has since it was changed in 2009. Central management of the project is by an Executive Committee (SGS-EC), Mike Antolin (lead PI until 11/1/2010), John Moore (lead PI since 11/1/2010, Justin Derner, Eugene Kelly, and Nicole Kaplan (Information Manager). The Executive committee works with the PI both to manage project budgets and to map out the general scientific directions of the project. Justin Derner is a scientist with the USDA ARS Rangeland Resource Research Unit (ARS-RRU) stationed in Cheyenne, WY, and represents our partners with the Central Plains Experimental Range where the majority of SGS LTER research has been conducted. We use video-conferencing to include members from several institutions at different locations.
The direction of scientific research is guided by Science Steering Group, comprised of active scientists on the project who provide specific advice about the scientific enterprise (e.g. design and implementation of research projects, data analyses, interpretation of results). Members of the Steering Committee are expected to attend monthly Science Meetings (second Wednesday of each month), with additional ad hoc meetings for more specific topics (also on Wednesdays, since this time is on the calendar for members). All of the SGS LTER community is invited to meetings, meeting provide videoconferencing for all remotely-based members, and meeting notes are made available to the community on our web page.
Currently the Science Steering Group includes: Amy Angert (CSU), Mike Antolin (CSU), David Augustine (USDA-ARS), Cynthia Broun (CSU), Indy Burke (UWyo), Justin Derner (USDA-ARS), Niall Hanan (CSU), Gene Kelly (CSU), Julia Klein (CSU), Alan Knapp (CSU), Bill Lauenroth (UWyo), Daniel Milchunas (CSU), John Moore (CSU), Jack Morgan (USDA-ARS), Bill Parton (CSU), Paul Stapp (Cal State Fullerton), Heidi Steltzer (now Fort Lewis College in Durango, CO), Joe von Fischer (CSU), Matt Wallenstein (CSU).
To coordinate the logistical aspects of the SGS LTER project (e.g. timing of field work, long-term climate monitoring, inputting metadata to the Information management system) also schedules monthly “Nut’ N’ Bolts” meetings. Again, members of the SGS LTER project are invited to attend the meetings, but all staff are expected to attend Nuts’ N’ Bolts meetings, we provide videoconferencing for all remotely-based members, and meeting notes are made available to the community on our web page.
Under this award the SGS LTER has one ongoing subcontract (two pervious subcontracts have been completed) for research activities with collaborators at the University of Wyoming (Drs. Indy Burke and William Lauenroth): continued work on long term ANPP and plant phenology, long-term biogeochemistry and climate manipulation experiments.