Comparison of Mineral- and Protein Content between Conventional, Organic and Biodynamic Swedish Winter Wheat with Atomic Absorption
Spectrophotometry and Elemental Combustion Analysis
Elise Palm
Chemistry 240 credits
University of Kalmar, School of Pure and Applied Natural Sciences Examination Project Work 30 credits
Supervisors:
Åsa Lindeblad Saltå Kvarn AB
153 91 JÄRNA SWEDEN
Boel Lindegård, Ph. D. School of Pure and Applied Natural Sciences
University of Kalmar 391 82 KALMAR SWEDEN
Exminer:
Kjell Edman, Ph. D. School of Pure and Applied Natural Sciences
University of Kalmar 391 82 KALMAR SWEDEN
Abstract
Correlation between production method and mineral-, cadmium- and protein content were sought for Swedish winter wheat. The wheat was grown according to conventional, organic or biodynamic principles. The minerals; iron, zinc, magnesium, copper and the heavy metal cadmium were analyzed with atomic absorption spectroscopy. Protein was analyzed with elemental combustion analysis. All together, 17 samples were analyzed; nine from the still ongoing Bollerup field trial in Skåne and eight from four different farm pairs in the midst of Sweden.
The Bollerup field trials showed that organic wheat had a higher concentration of iron than conventional. Both organic and biodynamic wheat had a higher concentration of zinc than conventional. Magnesium concentration was higher in biodynamic wheat than in conventional grown wheat. Differences between production methods were in the range of 7.5 and 17%. No unmistakable connections were found between any of the parameters and production method for the farm pairs. However, a tendency for more minerals in organic/biodynamic wheat was seen for all minerals but iron.
2
De senaste åren har någonting hänt. Det är inte längre bara miljöpartister och Djurens vänner som köper ekologiska och biodynamiska produkter. Alla gör det. För miljöns skull, för den goda sakens skull, för att det är godare eller för att det är nyttigare. Eller, är det verkligen det?
I Sverige är KRAV® och Demeter® de mest kända certifieringsorganisationerna för ekologiska respektive biodynamiska produkter. För att en produkt ska få bära någon av dessa stämplar krävs att flera kriterier uppfylls; exempelvis får produkten inte vara producerad eller odlad med hjälp av bekämpningsmedel, konstgödsel eller genmodifierade organismer och gårdarna ska sträva efter att vara självförsörjande vad gäller kompost, gödsel och djurfoder. Demeter har dock strängare regler än Krav och speciella kompost- och fältpreparat används även.
I arbetet har vete odlat enligt konventionella, ekologiska och biodynamiska principer jämförts. Samband mellan de olika produktionsmetoderna och vetets mineral- och proteininnehåll har sökts. Prov från fyra pargårdar i mellersta Sverige samt nio prov från Bollerup försöksgård i Skåne har använts i studien. Med pargårdar menas att proven kommer från två olika gårdar, där grödorna odlas enligt olika principer, men att gårdarna är från samma geografiska område och därför i teorin inte skiljer mycket åt vad gäller klimat, jord etc. Proven från Bollerup är alla odlade på samma fält vilket gör att det enda som i teorin skiljer dem åt är produktionsmetoderna.
Vetekornen har malts, torkats och förbrännts samt slutligen analyserats med hjälp av atomabsorptionsspektrometer och elementaranalysator. De metaller som undersöktes var järn, zink, magnesium, koppar och kadmium.
Det finns vetenskapliga artiklar som indikerar att proteininnehållet i ekologiskt vete är lägre än i konventionellt men att det ekologiska är av ett högre biologiskt värde, det vill säga har en aminosyrasammansättning som är bättre för människan. Det fanns ej utrymme i detta arbete att undersöka aminosyrasammansättningen men analyserna av proteininnehållet visade att det inte fanns någon statistiskt signifikant skillnad mellan de olika odlingsbetingelserna för Bollrupproven.
Då pargårdarnas resultat lades ihop, dvs alla konventionella värden lades ihop och jämfördes med alla ekologiska/biodynamiska kunde inga skillnader påvisas för varken mineral- eller proteininnehåll.
Gällandes Bollerupvetet visade järn sig finnas i högre mängd i ekologiskt vete än i konventionellt, zink i högre mängd i både ekologiskt och biodynamiskt än i konventionellt och magnesium i högre mängd i biodynamiskt än i konventionellt (koppar analyserades ej för Bollerupproverna). Skillnaderna låg mellan 7,5 och 17 %. Det viktigaste för att få i sig ordentligt med mineraler och protein från vete är dock att äta produkter gjorda av hela vetekärnan, dvs. fullkornsprodukter.
Askhalt, dvs återstoden av ett material efter fullständig förbränning, och zinkhalt sjönk över de fem år Bollerupproverna är tagna från för biodynamiskt och ekologiskt vete, men resultatet är mycket osäkert då det inte är samma veteart alla år, och olika vetesorter kan mycket väl variera i mineralhalt.
3
1 INTRODUCTION ……….….…….. 4
1.1 Organic farming ………..……….…. 4
1.2 Biodynamic farming ………..………….... 5
1.3 Nutrient uptake by crops ……….………... 6
1.4 Comparison between organic and conventional agriculture ………. 6
1.4.1 Theory ………. 6
1.4.2 Earlier research ………. 7
1.5 Wheat ……… 9
1.6 Minerals and the heavy metal cadmium ……….. 10
1.7 Atomic absorption spectroscopy ………... 11
1.7.1 Graphite furnace ……… 12
1.8 Elemental combustion analysis ………...….. 13
1.9 Wet ashing with microwave ………... 13
2 AIM ……….. 13
3 MATERIALS AND METHODS……….………..… 13
3.1 Materials ………..……… 14
3.2 Samples ………. 14
3.3 Method for determination of iron, zinc, magnesium and copper concentrations ……… 17
3.4 Method for determination of cadmium and copper concentrations ... 17
3.5 Method for determination of protein concentration ……….. 18
3.6 Statistics ………..………. 18
4 RESULTS AND DISCUSSION ……….… 19
4.1 Results of Bollerup samples ……….……….. 19
4.2 Ash results of Bollerup samples……… 20
4.3 Protein results of Bollerup samples ………. 21
4.4 Iron results of Bollerup samples ………..… 21
4.5 Zinc results of Bollerup samples ………. 21
4.6 Magnesium results of Bollerup samples ………. 22
4.7 Results of the farm pair samples ………...……… 22
4.8 Mineral content over time ………. 24
4.9 Cadmium and copper analysis with graphite furnace atomic ………. 25
4.10 Error of measurements ………..….. 26
4.11 Broader aspects of organic agriculture ……….…… 27
4.12 Further studies ………..……… 27 5 CONCLUSIONS ………..…….. 28 6 ACKNOWLEDGEMENTS ……….. 29 7 REFERENCES ……….. 30 Appendix I ………...……….. 34 Appendix II ……… 35 Appendix III ……….. 36 Appendix IV ……….. 37 Appendix V ……… 38 Appendix VI ……….. 39 Appendix VII ……….... 40
4
INTRODUCTION
Some of the basic principles for both organic and biodynamic farming are to respect the crops’ and animals’ different requirements, the use of compost and crop rotation to vitalize the soil, the use of different crops on the same field to not deplete the soil, to treat the soil not as dead materia but as a living unit and the conviction that humans, animals and plants are dependent on each other in order to exist. As much as possible of the animal feed, and hence manure, of a farm should be produced on the very same farm, i.e. the aim is an agricultural cycle
(KRAV 2008 a and Dominé 2000).
1.1 Organic farming
For a product to be called organic there are several criteria to be achieved (KRAV 2008 a). The biggest organization in Sweden responsible for setting up these criteria is KRAV, see figure 1 (a) (KRAV 2009). Areas that are included in the work of KRAV are environment, animal care, health and social responsibility (KRAV 2008 a). Products with the KRAV brand are not produced using pesticides, artificial fertilizers or gene modified organisms. Artificial fertilizers are not used because it is easily soluble and rapidly taken up by the crops and one of the foundations in organic farming is to vitalize the soil, not the crops (Dominé 2002, KRAV without year a). To vitalize the soil, e.g. clay minerals and stone dust, manure, crop rotation and growing of plants with deep root systems are used (Ascard 2009; Lindeblad 20091 and Watson et al. 2002). The organic material is decomposed by worms, bacteria and fungus and so the crops can utilize it (Dominé 2002, KRAV without year a). This way of farming gives a soil with rich animal- and bacterial life. Nitrogen input to the soil is mainly secured by the use of ley. Ley is for example clover and leguminous plants that have nitrogen fixing bacteria on their roots which binds nitrogen from the air. The ley becomes food for the animals and the roots, and hence a lot of nitrogen, are ploughed into the soil where it will be building blocks to new crops.
KRAV does not allow synthetic color- or aroma food additives, though natural aroma food additives are allowed; in July 2008, 34 of the little more than 300 food additives used in Sweden were legitimate to use in KRAV products (KRAV 2008 b, Swedish National Food Administration 2009 a).
KRAV is an economic association, consisting of 27 members, e.g. Scandic Hotels®, Djurens Rätt® and Arla® (KRAV 2008 c).
Another labeling of organic products is the European Unions’ which logotype is called “EU organic farming” (European Commission without year). KRAVs criteria of what can be called organic are stricter (KRAV without year b).
1
5
1.2 Biodynamic farming
Biodynamic farming can be viewed as the earliest – and most strict – version of organic farming (Lüthi 20092; Lotter 2003 and Dominé 2000). This means that what is true for organic agriculture is also in general true for biodynamic agriculture, although biodynamic farmers have stricter rules to live up to.
The organization responsible for the standards that count for biodynamically grown foods in Sweden is the Swedish Demeter Association®, member of Demeter International® (Demeter 2009 a), see figure 1 (b) and (c).
(a) (b)
(c)
Figure 1. The label used by KRAV for labeling of organic products (a). Used with permission from Krav Ekonomisk Förening®. The two labels used by Demeter for labeling of biodynamic products (b) and (c). Used with permission from the Swedish Demeter Association.
Biodynamic farming started in Germany in the 1920’s and is based on discourses held by Rudolf Steiner at the same time (Lotter 2003 and Dominé 2000). Steiner is also grounder of the antroposophic movement which biodynamic farming is based on (Demeter 2009 b). The goal for a biodynamic farmer is to have a farm that is self supporting in terms of compost, manure and animal feed. This is for the
minimization of transports and for having a circular flow of plant nutrients. There are certain preparations used in biodynamic farming which were first presented by Rudolf Steiner in 1924 (Kjellenberg 2005 and Steiner 1924). Two of them are called field preparations and are made of quartz and cow manure. The six manure
preparations are made of nettle, chamomile, yarrow, dandelion, valeriana and oak bark, respectively. They are used in very small amounts and are supposed to stimulate the humus in the soil and to vitalize the crops.
According to Demeters homepage, foods labeled with their brand are not only a “foundation for the bodys’ nutrition but also for spiritual life” (Demeter 2009 c). Demeter too allows some food additives, but far less than KRAV. For example, agar-agar, some pectines and gelatin are allowed.
Demeter is a non-profit consumer association (Demeter 2009 a).
2
6
1.3 Nutrient uptake by crops
There are several parameters affecting the micro- and trace element concentrations in crops;
composition of parent material, i.e. the rock type from where the soil is originating. This parameter has the largest impact on nutrient composition (Kirchmann 20093)
soil condition (pH, redox potential, mycorrhizae etc.) atmospheric deposition
application of trace metals with fertilizer (impurities or addition) or manure crop cultivar
weather conditions
state of plant maturity (Kirchmann et al. 2009)
Zinc (Zn), iron (Fe) and copper (Cu) are not taken up by the crop passively; it needs mobilization by the roots. Because of this, the size of the root system in relation to above-ground biomass can affect concentration of these minerals in the crop. High yielding crops may therefore have lower micronutrient levels than low yielding ones if the root system is not capable of increasing at the same rate as the above-ground biomass.
1.4 Comparison between conventional and organic agriculture
1.4.1 Theory
Today most farms are specialized in their production; there are e.g. farms specialized in producing grains (Granstedt 2008 and 2000 and Kirchmann & Thorvaldsson 2000). The conventional fields are artificially manured which means that a lot of nitrogen (N), phosphorus (P) and potassium (K) are spread on them. Although, artificial fertilizer are often poor in essential minerals (K not included) making the fields depleted on these minerals (Granstedt 20094). The grains are transported to a farm specialized in animal breeding and used as fodder (Granstedt 2008 and 2000). This means that the animals will have too little of essential minerals in there feed and that the N, P, and K will be accumulated in the animal’s feces, yet with too little essential minerals to make it a full worthy manure and that all the accumulated manure contributes to over-fertilization. The biodynamic farm has both grain cultivation and animal breeding which means that the natural manure from the animals, which are fed with the grains from the farm, is used to fertilize the farms’
3
Holger Krichmann Prof. Dr. Swedish University of Agricultural Sciences, department of Soil and Environment, e-mail 090515
4
Arthur Granstedt Assoc. Prof. Ph. D. Swedish University of Agricultural Sciences and University of Helsinki, e-mail 090505
7
fields. The idea of this way of farming is that the minerals come back to the very same field.
About 80 % of the arable land in Sweden is used for producing animal fodder, which was also the case in the 1950’s (Granstedt 2000). The number of animal breeding farms have decreased while the number of animals per farm have increased. This contributes to over-fertilization and the uneven distribution of nutrients on different farms. For a more even distribution of plant nutrients in Sweden, Artur Granstedt (2000) claims that animal breeding needs to be decreased in the south of Sweden and a corresponding increase is needed in the midst of Sweden. Furthermore, animal breeding farms needs to be better at using the manure produced on the farm instead of buying artificial fertilizers.
Artificial fertilizers are industrial produced; air nitrogen is fixed in by energy consuming processes and the phosphorus comes from fossil deposits (Lindeblad 20095).
There are no Swedish laws demanding that artificial fertilizers have to contain certain minerals (Eskilsson 20096). Although, fertilizer producing companies have to be able to specify what their fertilizers contains, including unwanted substances and metals, e.g. cadmium (Cd) and lead (Pb) (Swedish Code of Statues 1998:808).
1.4.2 Earlier research
In a Swedish experiment, mineral concentrations in winter wheat were analyzed (Kirchmann et al. 2009). Samples were taken between 1967 and 2003.
Differences in mineral concentrations over time and differences in mineral
concentrations between wheat grown with NPK fertilizer or manure were sought. In general, a correlation between soil treated with NPK fertilizer and depletion of trace elements in the soil and a correlation between soil treated with manure and
enrichment of trace elements in the soil were found.
The concentration of Zn were significantly higher in wheat grown with NPK
fertilizer when compared to wheat grown with manure, or untreated wheat (p<0.01) which was explained with an eventual contamination of Zn in the NPK fertilizer. Higher concentrations of Fe (p<0.05) (just the final years, 1995-2003), and Cu (p<0.01) was found in the wheat grown with manure compared to NPK fertilized or untreated wheat. A significant decline of Cu (p=0.008) and Fe (p=0.034) over time in wheat grown with NPK fertilizer were also found, and a trend for the same
phenomena for Zn (p=0.06), which were not found for the untreated or manure treated wheat.
Conventionally and organically grown wheat from four farm pairs in Australia were examined on their mineral contents (Ryan et al. 2004). Small variations occurred in grain N, K, magnesium (Mg), calcium (Ca), sulphur (S) and Fe. Conventionally
5
Åsa Lindeblad Quality Manager Saltå Kvarn AB, e-mail 090505
6
8
grown wheat had lower Zn and Ca but higher manganese (Mn) and P. However, farms that grow crops under conventional principles in Australia uses methods not so far from the way organic farmers grow crops in Europe which means that the results could have been different if the experiment was done in Europe.
A study showed that the minerals Fe, Cu, Zn and Mn have decreased in winter wheat grown on a field in Rothamsted, UK (Fan et al. 2008). Archive samples from 1845 to present were examined. The mineral concentrations were stable until the mid 1960’s but started to decrease after that. At the same time, semi-dwarf, high yielding
cultivars started to be used on the field. The mineral contents in the soil of the field have been stable or increasing through the years. The experiment was done using a lot of different fertilizers including artificial fertilizer and natural manure, though all wheat was grown on the very same field. The trends in mineral content of the wheat were similar, although, organically grown wheat had higher concentrations of Zn and Cu which is explained with the natural manure containing more of these minerals than the artificial manure.
When investigating conventionally, organically and biodynamically grown wheat in Switzerland 2003 on their metabolite contents e.g. amino acids and sugars no or small differences were discovered (Zrb et al. 2006). All together, 52 metabolites were investigated which of eight showed (usually small) statistical significant differences on production methods. Mineral contents were not investigated. When comparing conventionally and organically grown wheat in a 21 year long Swiss experiment there were no differences in either amino acid composition or mineral concentrations (P, K, Ca, Zn, molybdenum (Mo) and cobalt (Co)) (Mäder et al. 2007). Protein content in conventional wheat was higher than in organic wheat. Results about differences between organic and conventional wheat in protein content and amino acid constitution are contradictory. There are studies indicating that conventional wheat contains more protein than organic wheat and studies where no differences have been found (Nikita 2008; Anette et al 2007; Ryan et al. 2004 and Woese et al. 1997). Further, there are studies indicating that protein from wheat grown organically have a, for humans, higher biological value while other studies have not found these differences (Nitika 2008; Mäder et al. 2007 and Zrb et al. 2006).
A study that evaluated 29 different reports of the yields of organically and non-organically grown wheat showed that the yield of organic wheat was 92 % of that of conventional (Bagdley et al. 2006). Data were taken from studies with fields in the developed world only. Despite this, in Europe, the profits for organic farms are similar to the conventional farms (Offerman & Nieberg 2000).
When making preference tests with animals between conventionally and organically grown crops, organic crops are in most cases preferred (Mäder et al. 2007, Swedish National Food Administration 2007). Scientists do not know why.
A literature examination made by Kjellenberg 2005 found that “the effects of the biodynamic preparations are complex and sometimes contradictory”. In one article
9
the relationship between these preparations and the composting processes are described as “not fully understood” (Zaller & Köpke 2004).
There are no clear differences in cadmium (Cd) content between organic and conventional foods (Swedish National Food Administration 2009 b).
There are, obviously, contradictory results from articles concerning whether there are nutritional differences between conventional and organic crops or not.
1.5 Wheat
Wheat started to be cultivated 12000 to 17000 years ago (Karel & Ponte 2000). The most common species cultivated today is Triticum Aestivum, though about 4000 different species of wheat are grown all over the world. Wheat belongs to the grass family and can be grown in a very wide range of conditions (National Encyclopedia 2009 a). Wheat can be sown both in spring and fall and are called summer- and winter wheat, respectively (Dominé 2000). Winter wheat has a slightly higher yield than summer wheat but on the other hand, it contains less gluten. They are both harvested in fall. For pictures of wheat, see figure 2.
(a) (b) Figure 2. Wheat (a). Photo: Ragnhild Möller. Cross section of a wheat kernel with the most important parts written (b). Shown and modified with permission from Wasabröd.
Grains, including wheat, are an important source of starch in Sweden (Swedish National Food Administration 2008 a). Grains also contain proteins, minerals, vitamins and fibers. The little fat it contains is mostly unsaturated. Wheat flour is not made from the whole kernel; everything but the endosperm is removed i.e. the wheat flour is sifted (National Encyclopedia 2009 a and Griswold 1962). Whole-grain wheat flour is also called graham flour. Sifted flour contains less minerals, fibers and B vitamins than graham flour since most of the minerals are found in the outer layers and the least concentration of minerals are found in the endosperm (Swedish
10
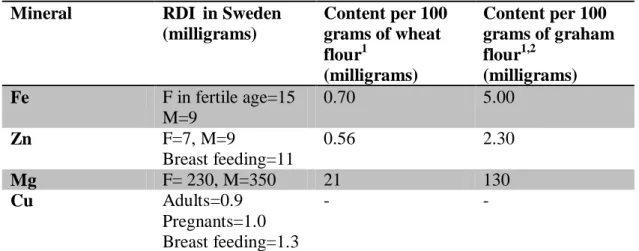
National Food Administration 2008 a and Karel & Ponte 2000). To compensate for the loss of B vitamins in sifted flour it can be enriched, although, it is not regulated by law (Abramsson Zetterberg 20097). For a comparison between wheat- and graham flour on Fe, Zn and Mg contents, see table I.
Until 1994 sifted flour was enriched with Fe in Sweden (Swedish National Food Administration 2004). This is no longer the case and a study on Fe status for nine graders in Sweden showed that the intake of Fe had decreased from 16 mg per day in 1994 to 10 mg per day 2000.
Kirchmann et al. wrote in an article from 2009 that:
“In perspective to other reported data, trace metal density in Swedish wheat seems to be low.”
Table I. The Swedish recommended daily intake (RDI) of Fe, Zn, Mg and Cu and comparison between wheat- and graham flour on its mineral contents. All figures are taken from the Swedish National Food Administration (2009 d).
Mineral RDI in Sweden
(milligrams) Content per 100 grams of wheat flour1 (milligrams) Content per 100 grams of graham flour1,2 (milligrams) Fe F in fertile age=15 M=9 0.70 5.00 Zn F=7, M=9 Breast feeding=11 0.56 2.30 Mg F= 230, M=350 21 130 Cu Adults=0.9 Pregnants=1.0 Breast feeding=1.3 - - 1
Note that this flour is not dried at 130°C for 80 minutes as the flour used in the experiment is
2
Whole-grain flour F=females M=males
1.6 Minerals and the heavy metal cadmium
There are about 22 minerals that are known to be essential for humans (Fennema 1996). Fe, Zn, Mg and Cu are all essential. Fe is involved in oxygen transportation in the blood; it is part of the protein hemoglobin which binds oxygen molecules from the respiration (Swedish National Food Administration 2009 c). Mg and Zn are part of many enzyme systems and Cu is part of many oxidizing enzymes and it is
7
11
important for the turnover of Fe. The recommended daily intake of Fe, Zn, Mg and Cu are listed in table I.
Cd is a heavy metal that is carcinogenic to humans and associated with kidney dysfunction and osteoporosis (Swedish National Food Administration 2008 b, Kazantziz 2004 and Waalkes 2003). In the European Union, the Cd content of wheat is not allowed to be over 200 ppb (parts per billion, µg/kg) in fresh weight (European Parliament 1881:2006). This is also the limit for rice, germs and brans. For all other grains the limit is 100 ppb. The Cd limits in foods are most often in the range of 50-200 ppb, but is up to 1000 ppb for shell fish, liver and kidney (Swedish National Food Administration 2008 b). The average Swedish persons’ daily intake of Cd is 10-20 µg for nonsmokers but much higher for smokers since they get a lot of Cd from tobacco.
1.7 Atomic absorption spectroscopy
Atomic absorption spectroscopy (AAS) is a method that can determine low
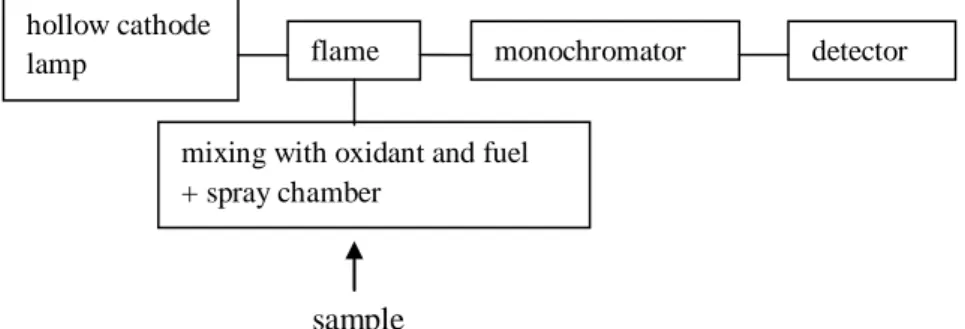
concentrations, sometimes ppb, of many elements (Nielsen 2003). For a schematic picture of the instrument, with flame, see figure 3.
sample
Figure 3.Schematic, simplified picture of a flame atomic absorption spectrophotometer.
To be able to measure the analyte in the sample it has to be atomized (Holler et al. 2007). This means that the sample is converted into gas-phase atoms and elementary ions in a hot flame. Before entering the flame it has to be suspended into an aerosol which is done in a so called spray chamber where also most of the droplets are removed leaving just the smallest one. The sample is also mixed with an oxidizing gas and a fuel, the most common oxidant/fuel mixtures are air/acetylene and nitrogen oxide/acetylene (Holler et al. 2007 and Nielsen 2003). The mixture is then
introduced into the flame. The sample evaporates immediately. Through the flame a light beam is focused, which usually comes from a hollow-cathode lamp, se below. The wavelength of the radiation is exactly the same as of the wavelength needed to excite the atoms being investigated, i.e. the difference in energy between a certain valence electrons’ excited and unexcited stage. Radiation that is absorbed by the
hollow cathode
lamp flame monochromator detector
mixing with oxidant and fuel + spray chamber
12
atoms cannot be registered by the detector. By subtracting the radiation registered by the detector from the radiation emitted from the radiation source, the concentration of the analyte in the sample can be calculated (presumed that standard solutions are measured), i.e. the method follows Beers law (Holler et al. 2007; Simonsen 2005 and Christian 1994):
where A is the absorbance (logI0/I, where I0 is the light intensity for the blank sample and I the light intensity for a sample containing the sought mineral), is the
absorptivity, c is the concentration of the sample analyzed and l is the cuvette length, i.e. the length of the flame (Simonsen 2005). Hence, the more concentrated the sample is of the analyte, the more of the radiation from the lamp will be absorbed by the atoms in the flame and the less will be registered by the detector.
One of the best radiation sources used together with AAS is the hollow-cathode lamp (Holler et al. 2007). It has an anode made of tungsten and a cathode covered with the analyte. The anode and cathode are sealed in a glass tube filled with neon or argon. If a sufficiently large voltage is applied, atoms from the cathode will be dislodged and an atom cloud will form. This is called sputtering. Some of the atoms will take up energy and excite and when they go back to the ground state they emit the energy again. This energy, or radiation, is passed through the flame making analytes in the sample to excite (Christian 1994). Then the remaining radiation is passed through a monochromator and registered by a detector (Simonsen 2005).
1.7.1 Graphite furnace
By using a graphite furnace instead of a flame to atomize the sample, the detection limit is lowered considerably (Simonsen 2005). The atomization is accomplished by electrical heating of a small graphite tube. Graphite is a good leader and the
temperature in the tube can reach over 3000° C. The sensitivity is better than when using a flame due to injection procedure; when using a flame it is continuous, with graphite furnace a fixed weight is used.
The atomization of the sample follows four steps; drying, pyrolysis to destroy
organic matter, atomization and rinsing to get rid of sample traces that are left. When the sample atomizes, a vapor cloud of atoms is formed. The radiation from a hollow-cathode lamp, just as with flame spectroscopy, is passed through the cloud and a detector measures the radiation that has passed. (Christian 1994).
13
1.8 Elemental combustion analysis
For measuring the total content of organic nitrogen in an organic sample, Kjeldahl is a common method (Nielsen 2003). This is a wet analysis involving sulfuric acid. Elemental combustion analysis is in many aspects a better method for measuring the nitrogen content of a sample (Harris 2005). As with Kjeldahl, it is not the protein content that is analyzed, but the total nitrogen content. This value is then multiplied with a factor that is different from compound to compound. Very simplified, in combustion analysis, the sample is burned in excess oxygen and the products are measured. The method can be used for determination of N, C, H, S and halogens in organic compounds.
The method of which the samples in this project work were analyzed is called the Dumas method (Kasviki et al. 2007). The sample introduced to the machine is first purged from atmospheric gases (Leco 2004). It is then completely combusted in a hot furnace with pure oxygen (Shriner et al. 1998). The combustion products are mainly CO2, H2O, NOX and N2 (Leco 2004). The gases pass through a furnace filter and a thermoelectric cooler. The sample gases are homogenized by turbulent mixing and a fraction of the sample is collected for further analysis. This small sample is then, by inert helium, swept through hot copper where the gases are reduced (Leco 2004 and Shriner et al. 1998). The amount of N2 is measured with thermal conductivity (i.e. the compounds ability to transport heat) (Harris 2005; Leco 2004 and Shriner et al. 1998). If many compounds are to be investigated they are separated before detection with gas chromatography.
1.9 Wet ashing with microwave
By combusting an organic sample in acid, less minerals are lost than when using dry ashing thanks to the lower temperature used (Nielsen 2003). The procedure takes less than an hour and can be done in closed vessels. When using closed vessels acids can be heated past their boiling points because of the high pressures reached. This means that nitric acid can be used to samples that normally require a more harsh acid, such as sulfuric or perchloric acid.
2 AIM
The aim of this project was to investigate if there are any differences in
concentrations between conventional, organic and biodynamic winter wheat in Fe, Zn, Mg and Cu and ash which is the residue remaining after complete combustion (Considine 2005). These minerals were chosen for their nutritional importance, their relatively high concentration in whole grain wheat, because some groups in the population are at risk for consuming too little of some of the minerals or because
14
there are indications of concentration differences between some of the minerals and production methods.
Protein contents were also investigated because of its nutritional importance. Cd concentrations were also investigated because it is a carcinogen to humans and associated with kidney dysfunction and osteoporosis (Kazantziz 2004).
3 MATERIALS AND METHODS
The procedures of the experiments are based on NMKL 139 (1999), ”Determination of ash content and analysis of the ash with atomic absorption spectrophotometer” from Kalmar University (without year), the standard working procedures at Kalmar Lantmän, Kalmar and “Analytical Methods for Atomic Absorption
Spectrophotometry” by Perklin Elmer (1990).
3.1 Materials
Spectrophotometers: Perklin Elmer Atomic Absorption Spectrometer 4100 was used for all minerals but Cd where Perkin Elmer AAnalyst 800 autosampler was used. The conditions for each element, Cd not included, are shown in table IV.
Muffeloven: Carbolite CWF 1200. Increase of temperature from room temperature to 550°C in approximately 30 minutes.
Elemental combustion analyzer: Leco FP 528. Wet ashing machine: Perkin Elmer Multiwave.
Chemicals used: Hydrochloric acid (HCl) 36%, nitric acid (HNO3) 65%, Fe-, Zn-, Mg-, Cu-, and Cd standards 1000 ppm and lanthan oxide. For specifications and precautions over chemicals used, see appendix VII.
Filter paper: Munktell, grade “00K”, size Ø 125 mm.
All glass- and porcelain equipment used were acid washed with 1 M HCl over night, washed two times with deionized water and one time with MQ water.
Minerals examined were Fe, Zn, Mg, Cu and Cd.
3.2 Samples
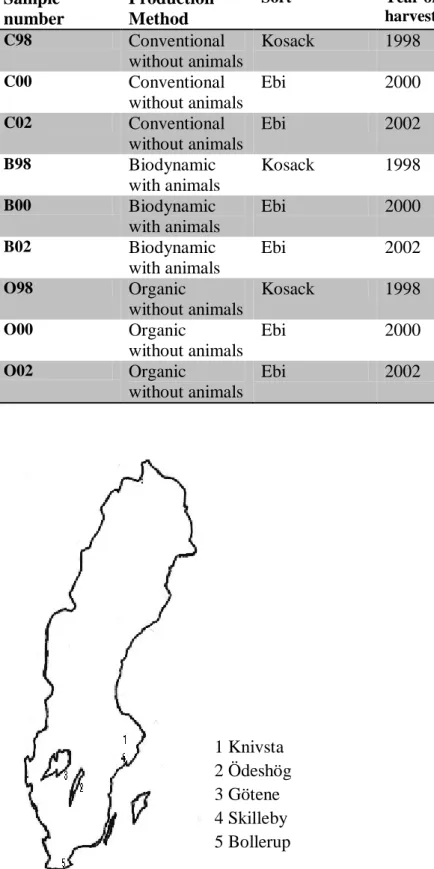
17 winter wheat samples were used in the project. Eight were from four different farm pairs in the midst of Sweden, harvested 2008, and nine from the field trial at Bollerup, Skåne, harvested 1998, 2000 and 2002, see table II and III and figure 4. The farm trial at Bollerup has been going on since 1987 and is driven by the Agricultural Society in Kristianstad. The soil has been cultivated since the mid 1970’s. All samples analyzed were of dried, milled whole-grain wheat.
All samples and standard solutions were prepared in 0,5 M HCl. To Mg solutions and standards one volume% of 0,14 M lanthan oxide were added.
15
Standard curves for the minerals investigated are shown in appendix VI. All curves with an r2 value over 0.9995 were accepted as linear. Standard curves were set up with five concentrations, blank included. Many of the curves diverged from linearity in the highest concentrations and when possible, i.e. when no sample had
concentrations in that area, these data points were excluded.
Table II. Production methods, sorts and geographic areas for the winter wheat from the farm pairs. Sample number Production
method
Sort Geographic area
1A Organic with animals Stava Knivsta 2A Conventional without animals Olivin Knivsta 1B Biodynamic with animals Stava Ödeshög 2B Conventional without animals Olivin Ödeshög 1C Organic with spreading contract1
Jacoby Borst Götene
2C Conventional
without animals
Harnesk Götene
1D Biodynamic with
animals
Not specified Skilleby
2D Conventional
without animals
Harnesk Skilleby
16
Table III. Production methods, sorts and years of harvest for the winter wheat from the field trial at Bollerup, Skåne.
Sample number Production Method Sort Year of harvest C98 Conventional without animals Kosack 1998 C00 Conventional without animals Ebi 2000 C02 Conventional without animals Ebi 2002 B98 Biodynamic with animals Kosack 1998 B00 Biodynamic with animals Ebi 2000 B02 Biodynamic with animals Ebi 2002 O98 Organic without animals Kosack 1998 O00 Organic without animals Ebi 2000 O02 Organic without animals Ebi 2002 1 Knivsta 2 Ödeshög 3 Götene 4 Skilleby 5 Bollerup
17
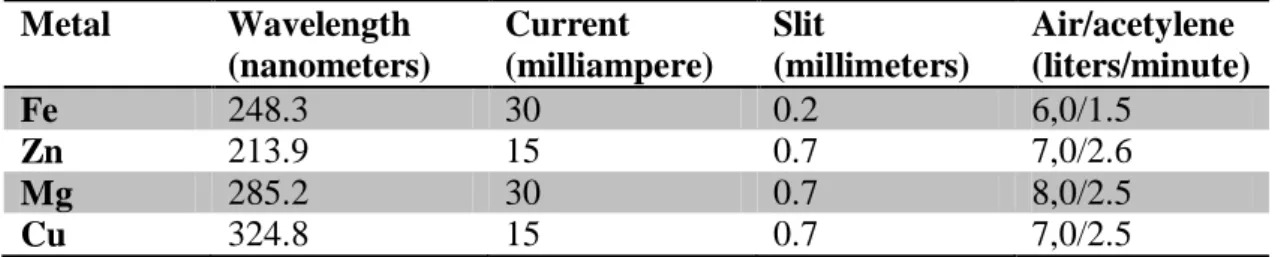
Table IV. AAS conditions for elements analyzed (Cd not included).
Metal Wavelength (nanometers) Current (milliampere) Slit (millimeters) Air/acetylene (liters/minute) Fe 248.3 30 0.2 6,0/1.5 Zn 213.9 15 0.7 7,0/2.6 Mg 285.2 30 0.7 8,0/2.5 Cu 324.8 15 0.7 7,0/2.5
3.3 Method for determination of iron, zinc, magnesium and copper concentrations
In porcelain crucibles, about five grams of wheat were weighted and dried 80 minutes at 130°C. Just one crucible per sample where used due to low sample volume. The samples were cooled in an excicator and then weighted again. The samples were then combusted in a muffel oven at 550°C over night. Again, the samples were cooled in an excicator and the ashes were weighted. Then the samples were set on a boiling water bath and five ml 6 M HCl was poured in the crucibles. After evaporation the crucibles were removed from the water bath and 15 ml of 0.5 M HCl was added to each crucible. Then the solutions were filtered through 00K-filters into flasks of 50 ml. The crucibles were rinsed with five ml 0.5 M HCl three times. The flasks were filled up with 0.5 M HCl. To analyze Zn (n=2) and Fe (n=2), sample solutions were diluted twice. To analyze Mg (n=6) sample solutions a dilution factor of eight was needed. Samples were then analyzed in a flame atomic absorption spectrophotometer (FAAS). All samples were then measured two times in the FAAS. Bollerup samples were not analyzed for Cu with FAAS because of
dilution mistakes.
The concentrations of minerals in the wheat were then calculated using the equation
ppm in wheat =
where X is the concentration of mineral in the sample analyzed in the FAAS in ppm, V is the volume of the first flask used in each dilution series in liters, S is the dilution factor and A is the weigh-in of the sample in kilos.
3.4 Method for determination of cadmium and copper concentrations
About 0.25 grams of sample were weighted and placed in wet-ashing flasks. 2.5 ml of each concentrated HNO3 and concentrated HCl were added to the flasks. The wet ashing machine was set on program “flour” and runned. After every run a cleaning step were followed with 6 ml of concentrated HNO3 in every flask. This was also done before the first run. The combusted samples were filtered through 00K-filter
18
into flasks of 50 ml, MQ water was used to fill the flasks and then the samples were analyzed in a graphite furnace atomic absorption spectrophotometer (GAAS) together with standards. Finally, the concentrations of Cd and Cu were calculated. For every sample three replicates were made. Analysis of Cd by GAAS was made by David Hjortenkrans, Ph. D. in Environmental Sciences, former at Kalmar University.
3.5 Method for determination of protein concentration
About 0.3 grams of flour were weight on nitrogen free paper. The samples were then introduced to the elemental combustion apparatus which calculated the nitrogen content. The protein content of each sample was then calculated by multiplying the percent of nitrogen with a factor; 5.7 were used). Two replicates of each sample were made and one extra for the samples that were not acceptably similar.
3.6 Statistics
When analyzing data where more than three groups were to be compared, one-way analysis of variance (ANOVA) was used. Tukey’s test was used as post-hoc test and when comparing just two groups two-tailed t-tests were carried out. Statistics were performed in GraphPad Prism®, 5th ed. Simpler statistics (confidence intervals, standard deviations and means) were calculated by hand or by Microsoft Office Excel 2007®.
The t-test is a common method when analyzing if there is a statistically significant difference between two groups (Hassmén & Koivula 1996). The result of a t-test depends on the standard deviations and the number of measurements of the groups (National Encyclopedia 2009 b). If the data contains more than two groups it is possible to make many t-tests although it is not recommended because the risk of making type-I errors, i.e. to incorrectly reject the null hypothesis, increases dramatically (Hassmén & Koivula 1996). Instead, ANOVA is performed which consists of only one F-test which divides between-groups variances with within-groups variances. If the quota is big enough, there is a statistically significant difference between groups. Although, F-test does not tell between which groups the difference or differences are. Because of this, a post-hoc test is usually performed after ANOVA. There are several different post-hoc tests to use. In this experiment, Tukey’s test was used which is based on the t-test.
When testing possible outliers Grubb’s test was used, which is the method
recommended by ISO (Miller & Miller 2005). According to Grubb’s test, only one measured value could be considered as an outlier and was discarded.
95% confidence intervals were used; results with p<0.05 were considered statistically significant. The null hypothesis was that the independent variables (conventional, biodynamic and organic production methods) do not cause differences in dependent variables (Fe, Zn, Mg, Cu, Cd, ash and protein)
19
4 RESULTS AND DISCUSSION
4.1 Results of Bollerup samples
Data from the Bollerup samples were put together according to their production method so that all three samples of conventional wheat, C98, C00 and C02, made up one group, all biodynamic wheat, B98, B00 and B02, a second group and all organic wheat, O98, O00 and O02, a third. Results are shown in figure 5. Data were also arranged to compare sample by sample, see appendix III.
When analyzing if there was a time dependent difference, C98, B98 and O98 were put together as one group, C00, B00 and O00 as a second and C02, B02 and O02 as a third. Appendix IV shows diagrams of these results. The data were also compared individually and diagrams of the results are shown in appendix III (for Zn, results are shown in figure 6). Data over mineral- and protein contents are shown in appendix I and II.
All figures shows mineral- and protein contents of dried, whole – grain flour. Typical FAAS absorbance values were 0.05 for Fe, 0.16 for Zn, 0.13 for Mg and 0.05 for Cu.
20
(c) (d)
(e)
Figure 5. Results of Bollerup samples when all conventional samples were put together as one group, all biodynamic samples as another and all organic as a third. Organic wheat contained more iron than both biodynamic and conventional wheat (p<0.01) (a). Both organic and biodynamic wheat contained more Zn than conventional, (p<0,001) and (p<0.01) respectively (b). Biodynamic wheat contained more Mg than conventional wheat (p<0.05) according to Tukey’s test, but not to ANOVA (c). No statistically significant differences were found when comparing the production methods on ash (d) and protein (e).
4.2 Ash results of Bollerup samples
The data were analyzed as described above. The production methods did not cause differences in ash content, see figure 5 (d). Neither was a declining ash content over time detected.
21
4.3 Protein results of Bollerup samples
The data were analyzed as described above. The production methods did not cause differences in protein content, see figure 5 (e).
4.4 Iron results of Bollerup samples
The data were analyzed as described above. According to ANOVA, there was a difference between samples (p=0.0005), see figure 5. Tukey’s test showed that organic wheat contained more Fe than both biodynamic and conventional wheat (p<0.01), 8.5 % and 7.6 %, respectively.
According to ANOVA, there was also a difference between samples (p=0.0025) when analyzing them for differences over time, see appendix IV. According to Tukey’s test, there was a higher concentration of Fe in wheat in year 2000 than 2002 (p<0.01).
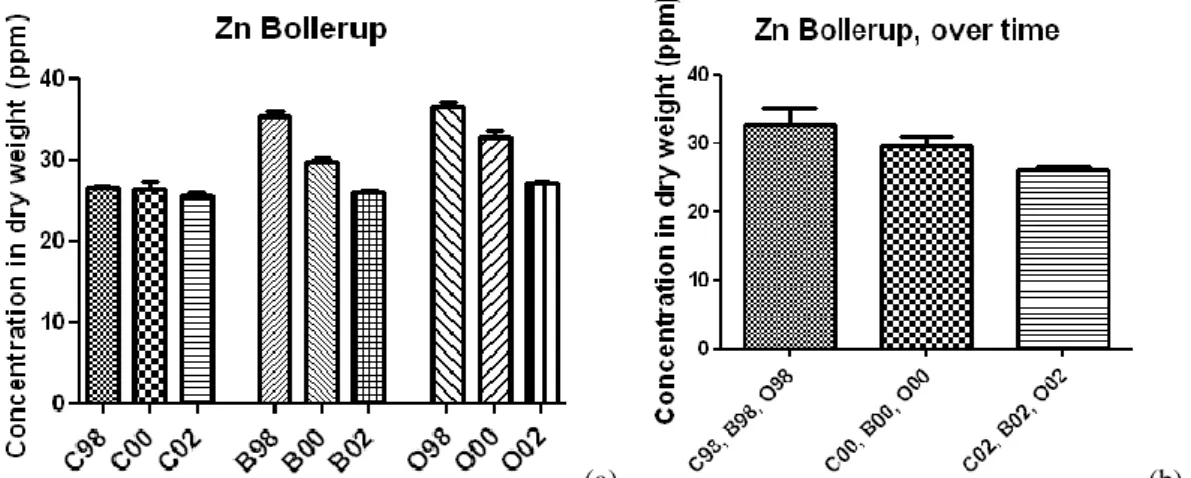
4.5 Zinc results of Bollerup samples
The data were analyzed as described above. According to ANOVA there was a difference between samples (p<0.0001), see figure 5. Tukey’s test showed that both organic and biodynamic wheat contained more Zn than conventional (p<0.001 and 0.01, respectively), 17 % and 11 %, respectively.
When analyzing samples over time, there was a difference according to ANOVA (p<0.0001), see figure 6. According to Tukeys’s test, there was 3.2 ppm more Zn in the wheat from 1998 compared to the wheat from 2000 (p<0.05) and 3.4 ppm more Zn in the wheat from 2000 compared to the wheat from 2002 (p<0.01).
The Zn content of the conventional wheat were not declining over time, see figure 6. However, the biodynamic and organic wheat were, (p<0.001) for all comparisons. Zn content in both biodynamic and organic wheat decreased 9.4 ppm between 1998 and 2002. For discussion about this result, see section 4.8.
22
(a) (b)
Figure 6. Zn concentrations over time for the Bollerup samples shown individually (a). The Zn content of the conventional wheat is not declining over time, although the Zn content in biodynamic and organic wheat is (p<0.001 for all comparisons); for both production methods, it sunk 9.4 ppm
between 1998 and 2002.Zn concentrations for the Bollerup samples over time (b). There was 3.2 ppm
more Zn in the wheat from 1998 compared to the wheat from 2000 (p<0.05) and 3.4 ppm more Zn in the wheat from 2000 compared to the wheat from 2002 (p<0.01).
4.6 Magnesium results of Bollerup samples
The data were analyzed as described above. According to ANOVA there was no difference between samples (p<0,056), see figure 5. However, Tukey’s test showed that biodynamic wheat contained 8.8 % more Mg than conventional wheat (p<0.05). According to ANOVA, there was a difference between samples when analyzing them for differences over time (p<0.0001), see appendix IV. According to Tukey’s test, there was a higher concentration of Mg in wheat in year 2000 than 2002 (p<0.001) but more Mg in wheat in year 2000 than 1998 (p<0.01).
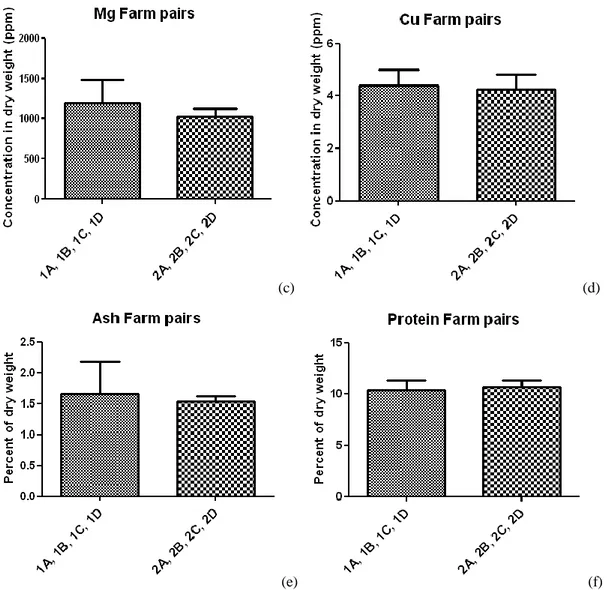
4.7 Results of the farm pairs samples
When analyzing all four farms that grow organic/biodynamic wheat as one group (1A, 1B, 1C and 1D) with all four farms that grow conventional wheat as another (2A, 2B, 2C and 2D), no statistically significant differences were seen between the groups for any of the dependent variables (Fe, Zn, Mg, Cu, ash and protein) when performing t-tests, see figure 7. Because the concentrations of minerals differed from farm pair to farm pair, the data were very spread in the group when all
organic/biodynamic data of a mineral were put together in one group and all conventional data of the same mineral were put together in another. When t-tests were done, it was therefore hard to find a statistically significant difference between the production methods.
However, a tendency for more mineral content in organic/biodynamic samples was seen for all minerals but iron. Differences between the farm pairs were often found
23
when analyzing the data pair per pair, i.e. 1A to 2A, 1B to 2B etc, but these results were contradictory; e.g. in one pair there were more iron in the conventional wheat and the opposite for another pair (data not shown), see appendix V.
Even though farm pairs are situated near each other the soil are hardly identical which is an important aspect to bear in mind when interpreting the data.
The wheat sorts of conventional and organic/biodynamic wheat from the farm pairs are not the same; farmers choose different sorts of wheat depending on if they grow according to conventional or organic/biodynamic principles. When comparing the farm pairs, it was not important what wheat sort that contained the most minerals but what sort of production method (where wheat sort is included) gives wheat with the highest mineral- and protein content.
Data over mineral- and protein contents are shown in appendix I and II.
24
(c) (d)
(e) (f)
Figure 7. Results from the farm pairs when all conventional samples, 2A, 2B, 2C and 2A were put together and compared with all organic/biodynamic samples; 1A, 1B, 1C and 1D. Concentrations of Fe (a), Zn (b), Mg (c), Cu (d), ash (e) and protein (f). No statistically significant differences were found.
4.8 Mineral content over time
There are theories about a declining mineral content over time in wheat (Kirchmann et al. 2009 and Fan et al. 2008). Therefore, data from the Bollerup samples were arranged as described above, to reveal eventual differences over time, see appendix IV and figure 6. The samples are from 1998, 2000 and 2002, a span over five years. The Bollerup field trial has been going on since 1987 and if samples had been taken from some of the early years and up until today it may had been easier to see a declining trend in mineral content. Also, samples from more years had been preferably. Further, it is very unfortunate that the wheat sort from the Bollerup samples of 1998 is not the same as of 2000 and 2002. This makes it very uncertain to
25
draw conclusions about a declining mineral content in the wheat; different sorts of wheat can contain different amounts of minerals and protein. Also, the wheater could possibly influence the mineral content.
The Zn samples are interesting in the time aspect. The Zn content of the conventional wheat is not declining over time. However, the biodynamic and organic wheat is (p<0.001 for all comparisons). The reason for this is unclear. As Kirchmann et al. (2009) writes, the NPK fertilizer could have been contaminated with Zn. The NPK fertilizer could also have been enriched with Zn, but artificial fertilizers are seldom enriched (Granstedt 20094).
4.9 Cadmium and copper analysis with graphite furnace atomic absorption spectroscopy
After preparing samples for Cd and Cu analysis by wet ashing it was discovered that the glass crucibles in which the samples were combusted were not clean; for every run in the micro wave the concentration of Cu and Cd sank when analyzing them in the GAAS (data not shown). This was the case both for the samples and the blank samples. To decide at what micro wave run the glass crucibles were clean three runs of just blank samples were done. These were then analyzed for Cu in the GAAS and showed to have a Cu concentration of nearly zero, not dropping in concentration with every run. It was therefore decided to use data from the samples which had been combusted at the same run with a blank sample showing a Cu concentration of nearly zero and not dropping, which was the last two runs and included all samples but two. The farm pairs were hence analyzed for Cu both with flame and graphite furnace and the results were compared (data not shown). Six of eight samples were lower in Cu when analyzing with graphite furnace compared to analyzing with flame.
More trust is put to the results from the flame since the sample sizes were bigger (five grams compared to 0.25 grams) and the sample concentrations showed more stability when analyzing with flame, i.e. did not vary within the same sample as much as for the graphite furnace. Further, it was discovered that the rinsing fluid to the GAAS, consisting of approximately 30% isopropanol, had just run out when all the samples were analyzed which means that the samples could have been affected by each other if the sample collector tube was not totally clean.
When taking samples for analyzing Cu and Cd with GAAS there was not much flour left for many of the samples and hence uneven samples could have been taken, since the concentrations of minerals are not evenly distributed in the wheat kernel (see section 1.5). Since the endosperm is milled to smaller pieces than the bran, uneven distribution will occur in the receptacle if it is not shaken enough or if it is just a very small amount left, which was the case for many of the samples. Hence, lower
concentrations of both Cu and Cd can be expected for the GAAS results in comparison to the FAAS results.
26
Another possible scenario is that there can be systematic errors that are very hard to detect. E.g., the flame can measure too high concentrations or the graphite furnace can measure too low concentrations.
When analyzing Cd concentrations it was discovered that the glass crucibles were presumably more contaminated with Cd than Cu; some blank samples had higher concentrations of Cd than the samples, including the last runs (data not shown). The results are therefore useless and it was decided not to run the extra three replicates of blank samples prepared for Cd. The only conclusion that can be drawn is that all samples have Cd concentrations under highest value allowed which is 200 ppb in fresh weight (European Parliament 1881:2006). The highest concentration of Cd measured was 141 ppb in fresh weight but this value is hence presumably much too high because of unclean crucibles.
4.10 Error of measurements
There are a lot of systematic and random errors that can occur in a large experiment. Obvious ones are for examples random errors when making the standard series or when transferring the flour from the weighing cups to the crucibles. Examples of systematic errors are if the flour is not totally combusted in the muffle oven or micro wave or if the AAS is measuring too low absorbance of the samples.
One error that is hard for the laboratory worker to have control over is how the samples are collected. In this experiment, 17 different samples of wheat were collected by many different people. A satisfying sample is representative of the whole population. This can be hard to achieve. It is reasonable to presume that not all wheat kernels contain exactly the same amounts of nutrients just because it has been grown on the same field. Hence, it is important not to take the sample from e.g. just a corner of the field. In reality, it can be presumed that samples are taken when the wheat is already harvested and stored in storage places and so some mixing of the wheat have occurred. Still, it is important to take a sample not from one site of the stored wheat but from many sites trying to get a representative sample.
Another possible error is if the sample is contaminated with for example weeds or with contaminants in the plastic bags in which the samples were collected. Another possible scenario is that some samples can have been collected by using metal tools which could have contaminated the samples.
The state of the plants’ maturity is affecting its nutrient status (Kirchmann et al. 2009). The Bollerup samples are all from the same field and can be assumed to have been harvested the same day. They are also of the same wheat sort so the maturity of all wheat is presumably the same. The farm pairs, on the other hand, are not of the same sort so it is very hard to harvest the wheat at the same stage of maturity.
27
4.11 Broader aspects of organic agriculture
Even if there are no today known big, unequivocal differences between the production methods of wheat (conventional, biodynamic and organic) and their mineral contents there can be differences that scientists yet do not know enough about.
Another aspect is if it is better for the environment to eat organic and biodynamic food instead of conventional. This opinion is often accepted in the society, both by consumers and professionals of the field but there are scientists with a different opinion. Professor Lars Bergström, Swedish University of Agricultural Sciences, claims that organic food is not better for the environment than conventional food (Olsson, Dagens Nyheter 2009). In the same article, Johanna Björklund, reasearcher at CUL, Center for Sustainable Agriculture (financiered by for example the
government) says that organic agriculture is necessary because conventional
agriculture uses too much oil and fossil phosphorus and that we one day will run out of this.
The government has a goal that in 2010, at least 20% of the Swedish agricultural land shall be organic (Swedish Code of Statues 2005/06:88). This will be hard to reach since this figure today is eight percent (Olsson, Dagens Nyheter 2009). Except for the nutritional and environmental point of views it can be claimed that organic and biodynamic food is better for other reasons, for example that animals breeded after organic or biodynamic principles live a better life than conventional ones and that people working on the fields do not have to handle pesticides. Farmers in poor countries do often lack appropriate protection for pesticides (KRAV 2005). According to this study there are indications that organic and biodynamic wheat contains more minerals than conventional which means that people would benefit from eating more of this wheat instead of conventional. Even though most of the minerals in the wheat are situated in the bran, people eat a lot of sifted flour. So, people that do not eat a lot of whole grain may have the biggest gain of switching from conventional to organic wheat- and grain products. This, as mentioned, includes a great part of the Swedish population.
4.12 Further studies
When making preference tests between conventional and organic food, animals most often prefer organic (Mäder et al. 2007 and Swedish National Food Administration 2007). This means that differences between organic and conventional food do exists, which scientists already know, and that it presumably exists differences that are yet to be discovered.
It would be interesting to make further studies on antioxidant content in conventional and organic wheat, e.g. if the use of pesticides decreases the amount of antioxidants in conventional wheat. On KRAVs home page, it is written that organic vegetables
28
contain more antioxidants, but this has not been investigated enough for wheat (KRAV without year b). Second metabolites would also be interesting to further compare between conventional and organic wheat. Studies are already done showing that there are more second metabolites in organic foods, but research about how much more and what types are desirable (Swedish National Food Administration 2007). Amino acid measurements are another area that would be interesting to further explore to see if organic wheat contains protein with a higher biological value compared to conventional. More human – studies on preferences for organic and conventional food would also be of great interest.
5 CONCLUSIONS
Biodynamic and organic wheat from Bollerup contained on average more minerals (Fe, Zn and Mg) than conventional. A tendency for more minerals in
organic/biodynamic wheat was seen for the farm pair samples for all minerals but Fe. However, in respect to mineral density, there are bigger differences between whole-grain- and sifted wheat flour than between production methods investigated in this project (Swedish National Food Administration 2008 a and Karel & Ponte 2000). No differences between production methods were seen in respect to protein content. In the future research about conventional, biodynamic and organic wheat, and food in general, is believed to include amino acid-, antioxidant- and second metabolites measurements and sensory aspects, i.e. what kind of food that tastes best.
29
6 ACKNOWLEDGEMENTS
I would like to thank Saltå Kvarn for making this project possible. Special thanks to my head supervisor Åsa Lindeblad for text examination, answering of questions and nice meetings in Järna.
Thanks to my supervisor at Kalmar University, Boel Lindegård, for all good advices, text examination and answering of plenty of e-mails.
Thanks to biomedical analyst Sara Gunnarsson for A LOT of questions about the practical work with the AAS.
Thanks to Artur Granstedt, Assoc. Prof. Ph. D. at Swedish University of Agricultural Sciences and University of Helsinki, for providing me with samples and knowledge. Thanks to David Hjortenkrans for analyzing Cd contents in all samples.
Thanks to Kalmar Lantmän Laboratory personnel for help with determination of the method and for letting me use your elemental combustion apparatus for protein analysis.
30
7 REFERENCES
Annett L.E., Spaner D. & Wismer W.V. (2007) Sensory profiles of bread made from paired samples of organic and conventionally grown wheat grain. Journal of
Food Science. 4, 254-260.
Ascard J. (2009) Gödselmedel för ekologisk odling 2009. Specialgödselmedel och stallgödsel. Swedish Board of Agriculture. Publication that until further notice
replaces the book: Fertilizers for Organic Agriculture from Swedish Board of Agriculture’s file folder: Organic Agriculture of Vegetables on Open Land, 2008.
Badgley C., Moghtader J., Quintero E., Zakem E., Chapell M., Avilés-Vásques K., Samulon A. & Perfecto I. (2006) Organic agriculture and the global food supply. Renewable Agriculture and Food Systems. 22(2), 86-108
Christian Gary D. (1994) Analytical Chemistry. 5th ed. p. 467-474. USA: John Wiley & Sons Inc.
Considine, G. D. (2005) Van Nostrand’s Encyclopedia of Chemistry. 5th ed. p. 153. Search word: ash. USA: John Wiley & Sons Inc.
Dominé A. (2000) Naturkost – En kulinarisk upptäcktresa.1st ed. p. 13, 14, 402, 405. Frankrike: Könemann Verlagsgesellschaft mbH.
Demeter Association (2009) a Electronic. Available: <http://www.demeter.se> (09-03-11).
Demeter Association (2009) b Electronic. Pdf-format. 46 pages. P. 4, 8. Available: <http://www.demeter.se> Växtodling och djurhållning/Demeterregler (09-01-20).
Demeter Association (2009) c Electronic. Pdf-format. 31 pages. Available: <http://www.demeter.se> Förädling/Regler (09-01-29).
European Commission (without year) Electronic. Available:
<http://www.ec.europa.eu/agriculture/organic> Svenska/Ekologiskt jordbruk (09-05-20).
European Parliament 1881:2006. EU limits for cadmium in foods.
Fan M-S., Zhao F-J., Fairweather-Tait S. J., Poulton P. R., Dunham S. J. & McGrath P. S. (2008) Evidence of decreasing mineral density in wheat grain over the last 160 years. Journal of Trace Elements in Medicine and Biology. 22, 315-324
Fennema O. R. (1996) Food Chemistry. 3rd ed. p. 618. USA: CRC Press.
Granstedt A. (2008) Mineralämnesförsörjning i biodynamisk odling. Biodynamic
Research Institute Foundation. artur.granstedt@jdb.se
Granstedt A. (2000) Increasing the efficiency of plant. Nutrient recycling within the agricultural system as a way of reducing the load to the environment –
experience from Sweden and Finland. Agriculture, Ecosystems and
Environment. 80, 169-185.
Griswold R. M. (1962) The Experimental Study of Foods. p. 299 USA: Houghton Mifflin Company.
31
Harris D. C. (2005) Exploring Chemical Analysis. 3rd. p. 131. USA: W. H. Freeman Company.
Hassmén & Koivula (1996) Variansanalys. p. 10-11, 21. Sweden: Abacus Concepts Inc.
Holler F. J., Skoog D. A. and Crouch S. R. (2007) Principles of Instrumental
Analysis. 6th ed. p230-233, 238. USA: Thomson Brooks Cole.
Kalmar University (without year) Determination of ash content and analysis of the
ash with atomic absorption spectrophotometer. Laboratory instruction.
Laboration nr 9, coarse Food Chemistry.
Kasviki K, Stamatelatos I. E., Yannakopoulou E., Papadopoulou P & Kalef-Ezra J. (2007) On the accuracy of protein determination in large biological samples by prompt gamma neutron activation analysis. Nuclear Instruments and Methods
in Physics Research. 263, 132-135.
Kirchmann H., Mattson L. & Eriksson J. (2009) Trace element concentration in wheat grain: results from the Swedish long-term soil fertility experiments and national monitoring program. Environmental Geochemistry and Health. Without pagination.
Kirchmann, H. & Thorvaldsson, G. (2000) Challenging targets for future agriculture.
European Journal of Agriculture. 12, 145-161.
Kjellenberg L. (2005) De biodynamiska preparaten – I forskning och försök. 2nd ed. Krav Ekonomisk Förening (2009) Electronic. Available: <http://www.krav.se> Om
krav/Fakta om krav (09-03-11).
Krav Ekonomisk Förening (2008) a Electronic. Available: <http://www.krav.se > Om krav (09-01-20).
Krav Ekonomisk Förening (2008) b Electronic. Available: <http://www.krav.se> Konsument/Om kravmärkningen/Fördjupande läsning/Vad är det du äter? Om tillsatser och bekämpningsmedel/Krav godänner bara ett fåtal tillsatser/Kravs lista över tillsatser (09-01-21).
Krav Ekonomisk Förening (2008) c Electronic. Available: <http://www.krav.se> Om krav/Fakta om krav/Organisation/Medlemmar (09-01-20).
Krav Ekonomisk Förening (2005) Electronic. Available: <http://www.krav.se> Konsument/Om KRAV-märkningen/Fördjupande läsning/Miljö/Kemikalierna är ett smygande hot (09-05-27).
Krav Ekonomisk Förening (without year) a Electronic. Available:
<http://www.krav.se> Konsument/Frågor och Svar/Mark och Växt/Varför inte Konstgödsel?
Krav Ekonomisk Förening (without year) b Electronic. Available: <http://www.krav.se> Konsument/Frågor och svar/KRAV och
märkningen/Vad är skillnaden mellan KRAV-märkt och EU-ekologiskt? (09-05-20).
Kulp Karel & Ponte Jr Joseph P. (2000) Handbook of Cereal Science and
32
Leco (2004) Specification Sheet Leco FP-528 Nitrogen/Protein Determinator.
Electronic. 1 page. Available: <http://www.leco.com> Products/Organic/F-528 Nitrogen/Brochure (09-03-16).
Lotter D. W. (2003) Organic agriculture. Journal of Sustainable Agriculture. 21, 1-63.
Miller N. M. & Miller J. C. (2005) Statistics and Chemometrics for Analytical
Chemistry. 5th ed. p. 51. Great Britain: Pearson Education Limited. Mäder P., Diana H., Dubois D., Gunst L., Alföldi T., Bergmann H., Oehme M.,
Amadò R., Schneider H., Graf U., Velimirov A., Flieβbach A. & Niggli U. (2007) Wheat quality in organic and conventional farming: results of a 21-year field experiment. Journal of the Science of Food and Agriculture.
87, 1826-1835.
National Encyclopedia (2009) a Electronic. Available: <http://www.ne.se> Search word: vete. (09-01-25 and 09-04-29).
National Encyclopedia (2009) b. Electronic Available: <http://www.ne.se> Search word: t – test. (09-04-29).
Nielsen S. S. (2003). Food Analysis. 3rd ed. p. 134-135, 403-409. USA: Springer Science, Business Media.
Nitika, Punia D. & N. Khetarpaul (2008) Physio-chemical characteristics, nutrient composition and consumer acceptability of wheat varieties grown under organic and inorganic conditions. International Journal of Food Sciences and
Nutrition. 59, 224-245
Nordic committee on food analysis (1991) No. 139. Metals. Determination by atomic
absorption spectrophotometry in foodstuffs.
Olsson, H. (2009) Ekomat till varje pris? Dagens Nyheter, June 12.
Offerman F. & Nieberg H (2000) Economic performance of organic farms in Europe. Organic Farming in Europe. Economics and policy. 5th ed.
Perkin Elmer (1990) Analytical Methods for Atomic Absorption Spectrophotometry. Publication B353. Germany: Bodenseewerk Perkin-Elmer GmbH.
Ryan M. H., Derrick J.W. & Dann P.R. (2004) Grain mineral concentrations and yield of wheat grown under organic and conventional management. Journal of
Science of Food Agriculture. 84, 207-216
Shriner R. L., Hermann C. K. F., Morill T. C., Curtin D. Y. & Fuson R. C. (1998)
The Systematic Identification of Organic Compounds. 7th ed. p. 91. USA: John Wiley & Sons, Inc.
Simonsen F. (2005) Analysteknik. Instrument och metoder. 1th ed. p. 205, 210. Denmark: Ingeniøren/bøger.
Swedish Code of Statutes (2005) Organic Production and Consumption – Goals and Direction 2010 (2005/06:88).
Swedish Code of Statutes (1998) Environmental Code (1998:808). Swedish National Food Administration (2009) a Electronic. Available:
33
Swedish National Food Administration (2009) b Electronic. Available: <http://www.sle.se> Märkning av mat/Ekologisk mat/Är ekologisk mat nyttigare än annan mat? (09-05-05).
Swedish National Food Administration (2009) c Electronic. Available:
<http://www.slv.se> Märkning och näring/Vad innehåller maten?/Salt och mineraler/Koppar, Järn, Magnesium and Zink, respectively (09-01-26). Swedish National Food Administration (2009) d Electronic. Available:
<http://www.slv.se> Mat och näring/Vad innehåller maten?/Sök
näringsinnehåll i mat/Vetemjöl oberikat and Grahamsmjöl vete, respectively (09-01-28).
Swedish National Food Administration (2008) a Electronic. Available:
<http://www.slv.se> Mat och näring/Vad innehåller maten?/Bröd, mjöl och gryn (09-01-26).
Swedish National Food Administration (2008) b Electronic. Available: <http://www.sle.se> Risker med mat/Metaller/Kadmium (09-04-20).
Swedish National Food Administration (2007) Electronic. Available: Märkning av mat/Ekologisk mat/Är ekologisk mat nyttigare än annan mat?/Ytterligare information och referenser till uppgifter på sidan/Mår vi bättre av ekologiska livsmedel? (09-05-20).
Swedish National Food Administration (2004) Electronic. Available:
<http://www.slv.se> Seek: Järnstudien/Protokoll nr 23/04 (09-04-20).
Steiner, R. (1924) The Agriculture Coarse. Lecture 4 and 5, 12th and 13th June, 1924, Koberwitz, Poland.
Waalkes M. P. (2003) Cadmium carcinogenesis. Mutation Research. 533, 107-120 Watson C.A., Atkinson D., Gosling P., Jackson L.R., and Rayns F.W. (2002)
Managing soil fertility in organic farming systems. Electronic. Pdf-format. 35 pages. Available: <http://orgprints.org/8060> (09-05-15).
Woese K., Lange D., Boess C. and Bögl K. (1997) A comparion of organically and conventionally grown foods – results of a review of the relevant literature.
Journal of the Science of Food and Agriculture. 74, 281-293.
Zaller, J.G. & Köpke, U. (2004) Effects of traditional and biodynamic farmyard manure amendment on yields, soil chemical, biochemical and biological properties in a long-term field experiment. Biology and Fertility of Soils. 40, 222-229
Zrb C., Langenkmper G., Betsche T., Niehaus K. & Barsch A. (2006) Metabolite profiling of wheat grains (Triticum aestivum L.) from organic and conventional agriculture. Journal of Agricultural and Food Chemistry. 54 (21), 8301-8306
34
Appendix I
Table I. Fe, Zn, Mg and Cu contents in ppm of dry weight.
Sample Fe Zn Mg Cu Bollerup C98 26±1.2 26.5±0.35 1051±24 C00 32±0.81 26.4±1.0 1362±260 C02 30±0.76 25.5±0.43 1089±19 B98 31 35.3±0.7 1335±25 B00 30 29.7±0.45 1401±41 B02 27±1.2 25.9±0.22 1072±24 O98 33±1.1 36.6±0.6 1197±42 O00 34±1.1 32.8±0.75 1270±63 O02 30 27.2±0.18 1182±26 Farm pairs 1A 33±4.7 22.2±1.3 1081±19 5.5 2A 40±7.0 24.0±3.9 1085±19 4.9±1.1 1B 27±4.7 14.7±2.0 997.1±19 3.8 2B 28±2.3 19.6±0.61 1163±25 3.6±0.56 1C 35±3.7 38.1 1762±40 4.2±0.54 2C 27±0.5 16.9±1.9 975.0±14 3.7±0.54 1D 29±4.6 20.6±0.65 921.3±12 4.1±0.56 2D 32±2.3 17.1±0.64 884.8±12 4.8±0.55