Radon in Estonian dwellings
Results from a National Radon Survey
2003:16 LIA PAHAPILL, ANNE RULKOV, RAIVO RAJAMÄESSI rapport: 2003:16 oktober 2003 ISSN 0282-4434 AUTHOR/ FÖRFATTARE: Lia Pahapill1, Anne Rulkov1, Raivo Rajamäe1
and Gustav Åkerblom
1.Estonian Radiation Protection Centre (Kiirguskeskus)
DEPARTMENT/ AVDELNING: International Development Cooperation (SIUS)/ Inter-nationellt utvecklingssamarbete (SIUS).
TITLE/ TITEL: Radon in Estonian dwellings - Results from a National Radon Survey/ Radon i estniska bostäder. Resultat från en landsomfattande undersökning.
SUMMARY: A countrywide survey of radon concentrations in Estonian dwellings was carried out during the period 1998-2001. The survey formed a part of the coope-ration program on radiation protection between the Estonian Radiation Protection (Kiirguskeskus) Centre and the Swedish Radiation Protection Authority (SSI). The Estonian Environmental Foundation and the Swedish Ministry for Foreign Affairs have given financial support for the survey.
The survey included measurements in a number of dwellings representative for Es-tonia in detached houses and multifamily buildings (only dwellings on the bottom floor were included in the survey). Altogether, radon concentrations were measured in 515 dwellings, a number large enough to be statistically significant.
All measurements were made with alphatrack film detectors of the same type that SSI uses in Sweden. The measurements were made during a 2-3 month period during the winter halfyear. Two detectors were used in each dwelling. In Estonia there are 0.17 dwellings in detached houses and 0.45 million in multiapartment buildings. Of the 1.26 million inhabitants in Estonia. 0.36 million live in detached houses and 0.90 million in multiapartment buildings. Most of the latter were built during the Soviet occupation. Of the dwellings in multifamily buildings 30 % are assumed to be situa-ted on the first floor. The mean radon concentration in dwellings in detached hoses, according to the survey results, is 103 Bq/m3, in dwellings on the bottom floor in multiapartment buildings it is 78 Bq/m3. In 1% of the dwellings the radon concentra-tion exceeded 400 Bq/m3. The highest radon concentration found in the study was 1040 Bq/m3.
Approximately 70% of the Estonian population lives in apartments in multiapartment buildings. Based on the assumption that the average radon concentration in the dwel-lings in multi-apartment buildings that are not situated on the bottom floor is 30 Bqm3, and that these dwellings constitute 70% of all dwellings in multiapartment buildings, the mean radon concentration in dwellings in multiapartment buildings is calculated to be 44 Bq/m3. The mean value for all Estonia dwellings is calculated to be 60 Bqm3. Using the detriment factor given by ICRP, annually about 90 Estonians are expec-ted to develop lung cancer due to exposure to radon in their homes. Most of them, about 75, are smokers, which are affected by the synergetic effect of the two carcino-gens, smoking and radon. In Estonia the source of indoor radon is radoncontaining soil air that is transported into the buildings from the ground. Building materials with enhanced radium concentrations are not known in Estonia. In this survey, the highest indoor radon concentrations have been found in the northern part of Estonia where uraniumrich Dictyonema shale and uraniumcontaining phosphorous Glauco-nite sandstone exist in the bedrock and as fragments in the soils. Radon concentra-tions higher than 400 Bqm3 have also been measured in buildings situated in areas with karst formations. Areas with Dictyonema shale, Glauconite sandstone and karst are areas with a special risk for radon.
SAMMANFATTNING: En landsomfattande studie av radonhalter i estniska bostäder utfördes under åren 1998-2001. Studien utfördes inom ett samarbetsprojekt mel-lan Esti Kiirguskeskus (Estoninan Radiation Protection Centre, RPC) och Statens strålskyddsinstitut (SSI). Den finansierades via anslag från Estlands Miljöfond och Sveriges Utrikesdepartement. Studien omfattade mätningar av radonhalten i ett för Estland representativt urval av slumpvis utvalda bostäder, såväl i småhus som i
fler-Totalt mättes radonhalten i 515 bostäder. Mätningarna utfördes med samma typ av spårfilm i dosa som SSI använder och vidareutvecklat. I varje bostad mättes med två spårfilmsdosor.
I Estland finns ca 0,17 miljoner bostäder i småhus och ca 0,45 miljoner bostäder flerbostadshus. Av Estlands 1,26 miljoner invånare bor 0,36 miljoner i småhus och 0,90 i flerbostadshus, flertalet av de senare i stora bostadskomplex byggda under sovjetoccupationen. Uppskattningsvis bor 70% av befolkningen i lägenheter på bottenplanet om dessa lägenheterna på bottenplanet antas utgöra 30% av alla lä-genheter i flerbostadshusen. Den uppmätta genomsnittliga radonhalten i estniska småhus är enligt studien 103 Bqm-3 och i bottenvåningarna på flerbostadshusen 78 Bq/m3. I 1% av de mätta lägenheterna översteg radonhalten 400 Bq/m3. I den-na studie var den högsta uppmätta halten 1040 Bq/m3.
Baserat på antagandet att de lägenheter som inte ligger på bottenplanet har en genomsnittlig radon halt på 30 Bq/m3 och att dessa utgör 70% av alla lägenheter i flerbostadshusen skulle den genomsnittliga radonhalten i estniska bostäder i flerfamiljshus vara 44 Bq/m3. Den genomsnittliga radonhalten för alla estniska bostäder beräknas till 60 Bq/m3. Baserat på ICRP:s riksfaktor för lungcancer och exponering för radon beräknas att ca 90 fall av lungcancer per år orsakas av ra-don i hemmen. Av dessa fall antas att de flesta är rökare, ca 75 fall, vilka drabbas av den synergetiska effekten av exponering för både rökning och radon. Källa till radonet i husen är radon som transporteras med jordluft från marken.
Byggnadsmaterial med förhöjda radiumhalter har inte påträffats i Estland. I denna och tidigare undersökningar har de högsta radonhalterna inomhus uppmätts i den norra delen av Estland där uranrik Dictyonemaskiffer och uranförande fosfo-ritsandsten förekommer i berggrunden och som fragment i jordlagret. Halter över 400 Bq/m3 har också uppmätts i hus belägna inom områden med karstformatio-ner. Områdena med Dictyonemaskiffer, uranförande fosforitsandsten och karst utgör områden medsärkskild risk för radon.
Radon in Estonian dwellings - Results from a National
Radon Survey
Introduction
1
Background and objectives
1
The Estonia dwelling stock
2
The source of the radon – the ground
3
The design of the National Survey
6
Radon measurements
7
Results
7
Discussion
14
The exposure to the Estonian population due to indoor radon
14
Conclusions
16
Acknowledgments
17
References
17
1
INTRODUCTION
Background and objectives
In this report, the results of the National Radon Survey of radon concentrations in Estonia dwellings are given. This survey was performed during the period 1998-2001 and it included radon measurements in 515 randomly chosen dwellings. The Estoninan Radiation Protection Centre (ERPC) carried out the survey with the help of local and regional health authorities. The survey forms part of the cooperation program between Estoninan Radiation Protection Centre (Kiirguskeskus) and the Swedish Radiation Protection Authority (SSI). The Estonian Environmental Foundation and the Swedish Ministry for Foreign Affairs have given financial support to the survey.
The studies of indoor radon in Estonia started at the end of the 1980s, when it was recognized that elevated indoor radon concentration could be a risk factor for human health. At that time information about radon problems was mostly acquired through Swedish and Finnish publica-tions. The first radon survey in Estonia was carried out by The Department of Building Physics at the Estonian Building Research Institute (EBRI) during the years 1989-1991 [1]. In that sur-vey, radon levels in dwellings were measured as well as concentrations of natural radioactive elements in the soils and in the building materials produced in the country. Radon concentra-tions were measured in more than 400 houses using grab-sampling techniques with Lucas cells. Ninety percent of the measurements were made in dwellings and 10% in kindergartens, schools and hospitals. The highest measured radon level was 6,700 Bqm-3; in 72% of the houses the ra-don concentration was below 100 Bqm-3, and in 4% it exceeded 800 Bqm-3. These results showed that the main source of indoor radon is the soil under the buildings. In Estonia no building materials with elevated radium concentrations have been found so far.
The first Estonian-Swedish Radon Project (EST 6-01), a part of the Swedish East European co-operation program in the field of radiation protection, made it possible to start a radon-moni-toring program within the Estonian Environmental Moniradon-moni-toring Program in 1994. The main ob-jectives of this program were to investigate the radon levels in dwellings, to identify the coun-try’s radon risk areas, and the housing construction types that tend to be associated with high indoor radon levels.
The first part of the Estonian-Swedish Radon Project (EST 6-01) was completed in 1996 and it included measurements from randomly selected dwellings in areas considered to be radon risk areas [2]. During the five years of the radon-monitoring program (1994-1998), the indoor radon concentrations were measured in 700 dwellings located in areas expected to be radon-prone ar-eas. The measurements were made with passive alpha-track detectors; the measuring period was three months during the heating season.
The highest radon concentration found indoors was 12,000 Bqm-3. The arithmetic mean of these measurements was 102 Bqm-3. Approximately 65% of the measured dwellings had radon levels below 100 Bqm-3. In 3% of the houses the radon concentration exceeded 800 Bqm-3 [3]. In all areas the average radon levels were higher in single-family houses than in apartment buildings. A summary of these measurements is given in Appendix 1 (Table 1).
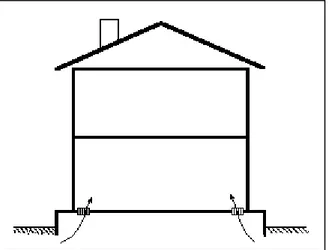
The results of the radon measurements showed that the type of building which has the greatest risk for high indoor radon concentration is a special type of two-storey apartment house with crawl spaces. These buildings were built in the 1950s. The crawl spaces of these buildings lack
external ventilation outlets. However, the floors on the first storey have indoor ventilation out-lets that lead to the crawl spaces, creating excellent conditions for the influx of radon-containing soil air (Figure 1). The highest indoor radon level, 12,000 Bqm-3, had a flat in one of these two-story apartment houses. Wherever such types of dwellings were measured they had the highest radon levels of the dwellings that were measured in that area.
In 1997, the National Survey of Radon in Estonia started. This survey constitut a second part of the Estonian-Swedish Radon Project (ES605A).
In this survey, radon has been measured in 550 randomly selected dwellings among the 617,400 dwellings in Estonia. The survey includes dwellings across the entire country (i.e. not only in radon risk areas).
The main aims of the survey were:
1. To estimate the countrywide radon situation for calculation of the public health risk due to indoor radon;
2. To provide a basis for work on protective measures against radon.
The Estonian dwelling stock
In Estonia, 70% of the population live in apartment houses, but about 80% of the dwellings are single-family houses. The population distribution by counties and types of houses is shown in Table 1. The locations of the different counties are shown in Figure 5.
The present-day dwelling stock consists of three major types of houses: concrete panel build-ings, brick-built and wooden. The use of concrete panel buildings became common in the early 1960s. Most of the urban residents live in apartment houses built after 1950, 50% were built even after 1970. These are typically two- or three-room flats including a kitchen, a hall, a bath-room and a toilet. The average floor space per capita is about 21 m2. The houses are mostly pro-vided with district central heating, a water supply, and natural draft ventilation. The estimated average ventilation rate in the heating season is about 0.8 - 1.2 air changes per hour. A ventila-tion rate of 1.0 change per hour was established in the construcventila-tion rules (SNiP) for dwellings in the former Soviet Union.
Figure 1. Two-story apartment house with crawl space ventilated via
openings in the lowest floor. As built in Estonia in the 1950s.
3
In rural areas and small towns, single-family houses are the most common type. Most of them are one or two-storied wooden or brick houses, with 3 or 4 rooms, a kitchen, a hall and a toilet. The average floor space is about 31 m_ per capita. In towns there is public tap water and drain-age. They have stove heating or their own heating system and natural draught ventilation; sau-nas are more common in single-family houses in rural areas. Private houses built in 1950-1990 are often “owner-built” – i.e. built by the people living in them. The insulation standard of these houses is often a lot better than in the standard houses, but the ventilation rates may be lower.
Table 1. Distribution of the Estonian population shown by counties and types of houses (from
the 2000 Population and Housing Census)1.
All dwellings Apartments Single-family houses
Counties No. of dwellings Residents No. of flats % Residents % No. of houses % Residents % All Estonia 617,400 1,335,000 450,600 73 903600 68 166,800 27 354,600 27 HARJUMAA 224,800 512,000 195,000 87 414,200 81 29,800 13 74,000 14 HIIUMAA 5,000 10,000 2,000 40 3,700 36 3,000 60 5,800 56 IDA-VIRUMAA 86,000 176,000 75,400 88 155,000 88 10,500 12 17,400 10 JÕGEVAMAA 17,900 37,000 8,800 49 15,800 43 9,100 51 18,800 51 JÄRVAMAA 18,600 38,000 10,900 58 19,700 53 7,800 42 15,500 41 LÄÄNEMAA 15,100 28,000 8,700 57 15,300 55 6,500 43 10,600 38 LÄÄNE-VIRUMAA 33,300 66,000 20,500 62 36,000 54 12,800 38 25,800 39 PÕLVAMAA 15,700 32,000 6,800 43 13,000 41 8,900 57 17,000 53 PÄRNUMAA 40,100 90,000 24,800 62 46,400 52 15,100 38 35,700 40 RAPLAMAA 17,600 37,000 9,000 51 17,000 47 8,600 49 17,200 47 SAAREMAA 16,400 35,000 6,900 42 13,900 40 9,500 58 18,800 54 TARTUMAA 64,700 144,000 47,600 73 92,800 65 17,700 27 38,100 27 VALGA MAA 17,400 35,000 9,800 56 17,100 49 7.600 44 15,600 45 VILJANDIMAA 26,000 56,000 14,700 57 25,800 46 11,300 43 25,700 46 VÕRUMAA 18,900 39,000 9,700 51 18,000 46 9,200 49 18,600 48 1)
The number of residents in apartments and single-family homes (1,258,200) does not correspond with
the number of residents in all Estonia (1,335,000), because about 77,000 persons are not registered at any address.
THE SOURCE OF THE RADON - THE GROUND
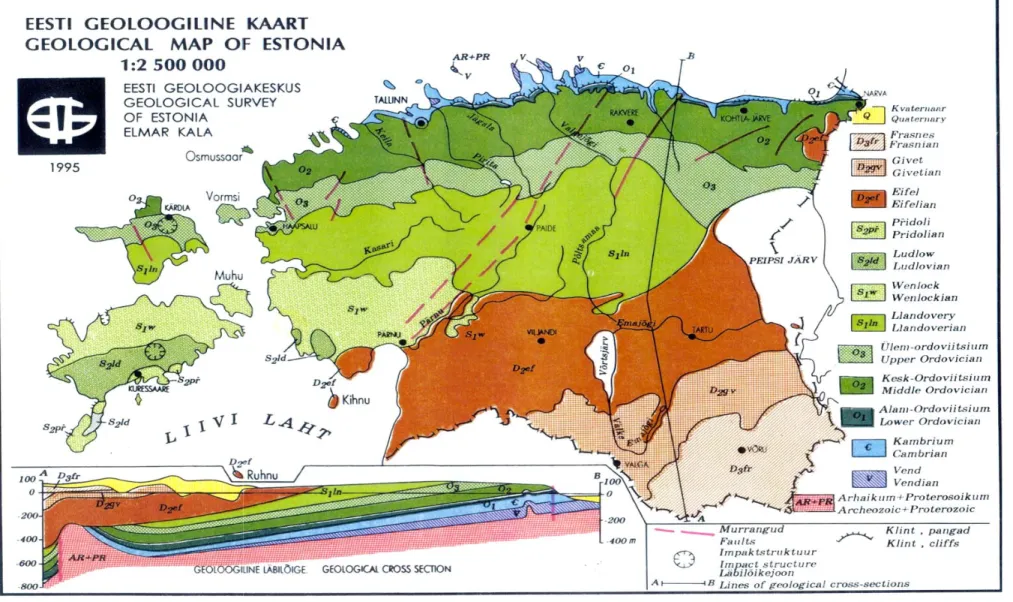
Radon transported by soil air is the main source of indoor radon in Estonia. As far as is known, no building materials with elevated radium concentrations have been used in the construction of Estonian dwellings. Water used in households generally has a low radon concentration [4]. The bedrock in Estonia consists of sediments of Cambrian to Devonian ages, underlain by the Precambrian basement, which consists of crystalline rocks belonging to the Baltic shield [5]. The basement rocks are not exposed anywhere in Estonia. Figure 2 shows a simplified map of the bedrock of Estonia and Figure 3 shows a profile of the bedrock from north to south. The sediment rock sequence has been investigated by drilling numerous boreholes, which penetrate the sediments down to the basement. The sedimentary rocks mainly consist of sandstones, shales, limestones, siltstones and clays. These sediments dip gently southward. Thus, the oldest
sediments (of Precambrian age, 590 m.y.) are exposed on the north coast of Estonia. The thick-ness of the sediment rock sequence is 100-600 m. The sediments are often unconsolidated, and layers of clay and sand exist.
The sedimentary rocks have low to normal uranium concentrations, usually less than 2.5 ppm uranium (30 Bq U-238 kg -1), with the exceptions of the Ordovician Dictyonema black shale and phosphorous-rich Glauconite sandstone in northern Estonia. The Dictyonema shale is 2-6 m thick and is from the Lower Ordovician period (490 m.y.). It is a kerogrich shale with en-hanced uranium contents; on average, the uranium concentration is 30 ppm (about 400 Bq U-238 kg-1), but the concentration in the most uranium-rich layers is 100-300 ppm (1200-3600 Bq U-238 kg-1). The Dictyonema shale is similar to the Upper Cambrian black uranium-rich alum shale found in Sweden and Norway. Directly above the Dictyonema shale lays the phosphorous-rich Glauconite sandstone that forms a layer of varying thickness, from just a few centimetres to more than 5 meters. The Glauconite sandstone also has an enhanced uranium concentration, but this is much lower than in the Dictyonema shale. The Glauconite sandstone has been exten-sively mined for its phosphorous, especially east of Tallinn where there are large excavations. The Dictyonema shale and the Glauconite sandstone are only exposed in the klint (a steep cliff along the northern coast of Estonia) and in a few other areas along the north coast of Estonia, e.g. in the eastern districts of Tallinn and the towns of Toila, Kunda and Sillamäe, where many houses have been built on the Dictyonema shale.
Glacial ice covered Estonia during the last glacial period. Thus, the soil in large parts of the country consists of moraine and glacial deposits of gravel, sand, silt and clay. The glacial soils consist mainly of material from the underlying rock units but also, to a large extent, of Precam-brian rocks transported by the glacial ice from the bottom of the Baltic Sea and from Finland. Some of this rock material contains stones and fragments of uranium-rich granites. In some parts of northern Estonia, the glacial soils contain fragments of Dictyonema shale and Glauco-nite sandstone.
As a complement to the radon measurement in houses, reconnaissance surveys were made in the northern regions of Estonia to study the geology and to locate areas with special geological features which may promote the risk of radon in buildings. In these surveys, measurements were made with portable gamma-ray spectrometers and emanometers to determine the concentration of radium-226, thorium-232 and potassium-40 in soils, as well as the radon concentration in the soil air. These measurements were made at depths of 70-100 cm. A compilation of the results is given in Table 2.
Table 2. Range of activity concentrations of 226Ra, 232Th, 40K in soil and 222Rn in soil air in Northern Estonia.
226
Ra, Bqkg-1 232Th, Bqkg-1 40K, Bqkg-1 222Rn, kBqm-3
Northern Estonia
Sand
Thin layer of till above karst Till in phosphorous-rich area Till with Dictyonema fragments shale 9 –13 175 130-820 17-32 40 40-80 360-800 440 600-16,000 4-13 49-149 270-283 380-2,500
5
Radon risk areas in Estonia, where indoor radon could create a health detriment, are found pre-dominantly along northern coast, and are connected to soils containing fragments of Dictyo-nema shale and Glauconite sandstone.
Within the parts of Estonian where the bedrock consists of limestone, there exist several regions where karst formation has developed. In these regions there are frequent fractures in the lime-stone bedrock, and underground streams and caves formed by the weathering of the limelime-stone. When atmospheric pressure changes occur, air is forced in and out of these underground cavi-ties. Although the radon concentration in the air in the cavities is not more than 1,000-10,000 Bqm-3, the large volumes of air that can be transported into buildings from these cavities can result in high indoor radon concentrations. The relatively high radon concentrations found in Raplamaa County may be connected with the karst in this county.
Figur 3. N-S cross-section from the Gulf of Finland through Estonia to north Latvia along a pro-file of boreholes. PR1, Paleoproterozoic crystalline basement, V3, Upper Vendian, _, Cambrian,
O1-2, Lower and Middle Ordovician, O3, Upper Ordovician, S1, Silurian, D1-2, Lower and Middle
Devonian, D3, Upper Devonian, Q, Quaternary [5].
THE DESIGN OF THE NATIONAL SURVEY
In the National Survey, it was planned to carry out measurements in 550 dwellings randomly selected from the 617,400 dwellings in the whole of the Estonian housing stock. Since the sur-vey was focused on the geographical distribution of indoor radon, only 2 or 3 houses were measured in the larger towns (Tallinn, where 1/3 of the Estonian population lives, Tartu, Narva etc.). The State Housing Register was used for selecting how many dwellings should be meas-ured in each of the counties and in the municipalities in these counties. Lists were made giving the numbers of single-family houses and multi-apartment buildings to be investigated in each municipality. The number of the dwellings to be measured in each municipality was usually 1-3. From these lists the local public-health authorities randomly selected the houses to be measured. The local public-health authorities visited each of the selected dwellings to put in the radon de-tectors. During the visit a questionnaire containing data on address, housing type, year of con-struction, building materials etc. was filled in by the householders. Results were obtained from 515 dwellings. For 45 dwellings, results were not received for various reasons (the detectors
7
RADON MEASUREMENTS
All indoor radon measurements in the Estonian-Swedish Radon Projects were made with pas-sive alpha-track film detectors (Figure 4). The measurements were made using CR-39 (polyallyl diglycol carbonate) alpha-track film detector material from TASL Ltd, Bristol, UK. For the measurements, the film is placed in a closed cup holder of electrically conductive plastic. These detectors were originally designed by the National Radiological Protection Board (NRPB), UK and they have been further developed by the Swedish Radiation Protection Institute (SSI) [6]. After chemical etching in a 20% NaOH solution (17 hours, etching temperature 68°C), the films were evaluated by an image analysis system using the GIPSRAD software developed by Image House a/s in Denmark. Etching and analysis of the films was done at the Estonian Radiation Protection Centre. Sensitivity calibration of the detectors was performed at SSI. The uncertainty in this method ranges from 5–10 %, the detection limit is 10 Bqm-_.
The detectors were exposed during two or three month in the winter heating season. Two de-tectors were placed in each dwelling, usually, one in a bedroom and one in the living room. In two-storey single-family houses, one detector was placed on each level. In multi-apartment buildings the measurements were made in flats on the ground floor.
RESULTS
The indoor radon measurements made within the National Radon Survey were carried out during the heating-seasons 1998-1999; 1999-2000 and 2000-2001. A survey form was used to collect data on each dwelling measured and to form the database. Summaries of the measure-ments and results are presented in Tables 3 and 4.
In this survey, results were obtained from 515 randomly selected dwellings. In 67% of them, the radon level was below 100 Bqm-3 and in 1% of the dwellings it they exceeded 400 Bqm-3. The arithmetic mean of all measurements was 95 Bqm-3.
Figure 4. The alpha-track film detector used in the Estonian National Radon Survey. The detector holder on the right is open to show the plastic film used. The detector holder is closed during the measurement. Radon gas seeps into the detector through a thin slot between the lid and the bottom of the detector holder.
The geographical distribution of measured indoor radon levels by county and municipality is given in Figures 5, 6 and 7.
Three types of influencing factors for indoor radon levels can be seen: geogenic, house-type and life-style related factors. As mentioned above, geogenic factors dominate in Estonia, the main source of indoor radon being radon transported by soil air from the ground under the buildings. In the northern part of the country, some houses are built on ground containing Dic-tyonema shale or phosphorous-rich Glauconite sandstone, either in the bedrock or as fragments in the soil. As the previous investigations have shown, there are high-radon areas in northern Estonia – thus the higher-than-average radon levels in Lääne-Virumaa and Harjumaa were expected. In the National Radon Survey, the maximum value found in Lääne-Virumaa was 1,044 Bqm-3. For this county the arithmetic mean level was 130 Bqm-3. In Harjumaa, the maxi-mum value was 475 Bqm-3 and the mean for the county was 115 Bqm-3.
In Raplamaa, the maximum value found was 558 Bqm-3 and the arithmetic mean for the county was 203 Bqm-3. These results indicate that there exist radon-prone areas in this county. The en-hanced indoor radon concentrations may be due to the karst formations.
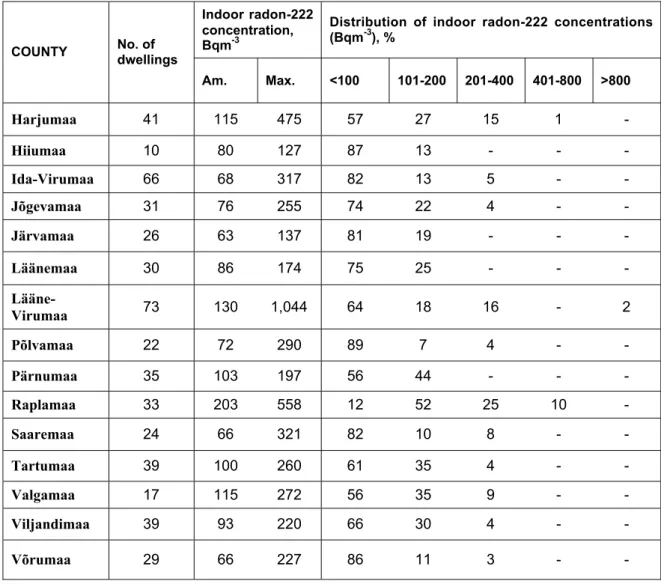
Table 3. Indoor radon concentrations in the dwellings measured in the National Radon Survey,
1998-2001. Arithmetic mean (Am), Maximum values (Max) of radon levels indoor and distribution of the indoor radon activity concentrations (%) are shown. The distributions of data in five activity concentration intervals are shown (%).
Indoor radon-222 concentration, Bqm-3
Distribution of indoor radon-222 concentrations (Bqm-3), % COUNTY No. of dwellings Am. Max. <100 101-200 201-400 401-800 >800 Harjumaa 41 115 475 57 27 15 1 -Hiiumaa 10 80 127 87 13 - - -Ida-Virumaa 66 68 317 82 13 5 - -Jõgevamaa 31 76 255 74 22 4 - -Järvamaa 26 63 137 81 19 - - -Läänemaa 30 86 174 75 25 - - - Lääne-Virumaa 73 130 1,044 64 18 16 - 2 Põlvamaa 22 72 290 89 7 4 - -Pärnumaa 35 103 197 56 44 - - -Raplamaa 33 203 558 12 52 25 10 -Saaremaa 24 66 321 82 10 8 - -Tartumaa 39 100 260 61 35 4 - -Valgamaa 17 115 272 56 35 9 - -Viljandimaa 39 93 220 66 30 4 - -Võrumaa 29 66 227 86 11 3 -
From the results of this survey, the conclusion can be drawn that Hiiumaa, Läänemaa and
Pärnumaa counties are low-radon-risk areas, since all values found were below 200 Bqm-3. These counties are situated on the west coast of Estonia where the sedimentary bedrock is cov-ered with deposits of clay, silt and loam formed during the Baltic Glacial Lake stage. The thick-ness of these sediments varies from several meters to 27 meters.
Two counties: Saaremaa, the largest Estonian island in the Baltic Sea (2671 km2), and
Järvamaa, a rural area located in the central part of the country, are not considered as radon
risk areas since Dictyonema shale and phosphorous-rich Glauconite sandstone are absent or occur very deep in the bedrock. The soils in these counties consist of moraine and glacial de-posits of gravel, sand and clay. The thickness of the Quaternary dede-posits is usually 5-10 meters. However, a moderate radon risk cannot be excluded, as karst formations exist in these counties. The mean indoor radon level found in these counties were 66 respectively 63 Bqm-3; the maxi-mum value measured in Järvamaa was 137 Bqm-3, and in Saaremaa 321 Bqm-3.
Jõgevamaa, Põlvamaa, Tartumaa, Valgamaa, Viljandimaa and Võrumaa counties may,
from their geological situations, be classified as normal radon risk areas.
According to previous investigations Ida-Virumaa county, especially the northern part, has been classified as a radon risk region. In the measurements made by EBRI in 1990, a radon gas activity concentration of 6,700 Bqm-3 was found in a house in Sillamäe [1], and in the first joint indoor survey (1994-1998) high levels were found in Toila (see Appendix 1). Measurements of radon in soil air were carried out in connection with the indoor radon survey in these towns. In Toila, radon concentrations as high as 140 kBqm-3 and in Sillamäe 2,500 kBqm-3 were measured in soils containing fragments of Dictyonema shale.
There are several geogenic factors, which can lead to an enhanced radon risk in the
Ida-Virumaa county:
- Dictyonema shale in bedrock and fragments of this shale in soil. Just in this region the Dictyonema shale layers are more uranium-rich than elsewhere in Estonia. The mean ura-nium concentration in the most uraura-nium-rich layers of the shale layers is 300 g/t (3.7 kBq
238
U kg-1), and the maximum concentration is 1,038 g/t (12.8 kBq 238U kg-1) [7];
- Phosphate-containing glauconitic sandstone with enhanced uranium concentrations in bed-rock and in soil;
- Karst in some areas;
- Deep-seated fault zones in sedimentary rocks;
As is shown in Table 3, the new measurements made in the Ida-Virumaa county in the frame of the National Radon Survey gave comparatively low radon values. Too low for any region to be classified as a radon risk area. These measurements were made in 66 dwellings selected ran-domly over the entire county, not only in the northern part, and this may have influenced the re-sults. The results may also be connected with the types of building in which the measurements were made. Ida-Virumaa is an industrial area where 88% of the population lives in multi-apart-ment buildings.
The influence of the house type on the indoor radon level is shown in Table 4, where dwellings in two different house types are compared: single-family houses and multi-apartment buildings. The type of building, which is most affected by radon in all the counties, is the single-family house. The lowest levels were found in dwellings in blocks of flats.
13
Factors related to the life-style were not specifically studied in this survey. However, in one case in Raplamaa, in a flat in a multi-apartment building, 540 Bqm-3 was found in the living room and 230 Bqm-3 in the bedroom. This difference was due to the life-style of the single resi-dent – the living room was not in use.
Table 4. Indoor radon concentrations in single-family houses and in flats on the ground floor in multi-apartment buildings shown by county. Results from the Estonian National Radon Survey 1998-2001 (Am = arithmetic mean, Max = maximum value).
Type of dwelling No. of
residents No. of dwellings measured Am, Bq/m-3 Max, Bq/m-3 All of Estonia Single-family houses 354,600 343 103 1,044
Flats on ground floor 903,600 172 78 538
Harjumaa
Single-family houses 74,000 30 120 475
Flats on ground floor 414,200 11 100 249
Hiiumaa
Single-family houses 5,800 8 70 127
Flats on ground floor 3,700 2 70 57
Ida-Virumaa
Single-family houses 17,400 31 83 320
Flats on ground floor 155,000 35 58 200
Jõgevamaa
Single-family houses 18,800 10 110 255
Flats on ground floor 15,800 21 60 126
Järvamaa
Single-family houses 15,500 16 71 137
Flats on ground floor 19,700 10 50 115
Läänemaa
Single-family houses 10,600 27 87 174
Flats on ground floor 15,300 3 73 89
Lääne-Virumaa
Single-family houses 25,800 58 130 1,044
Flats on ground floor 36,000 15 80 284
Põlvamaa
Single-family houses 17,000 8 93 290
Flats on ground floor 13,000 14 60 103
Pärnumaa
Single-family houses 35,700 26 105 197
Flats on ground floor 46,400 9 98 170
Raplamaa
Single-family houses 17,200 24 210 558
Flats on ground floor 17,000 9 183 538
Saaremaa
Single-family houses 18,800 19 72 321
Flats on ground floor 13,900 5 40 129
Tartumaa
Single-family houses 38,100 22 108 260
Flats on ground floor 92,800 17 90 218
Valgamaa
Single-family houses 15,600 12 130 272
Flats on ground floor 17,100 5 80 124
Viljandimaa
Single-family houses 25,700 26 100 215
Flats on ground floor 25,800 13 80 145
Võrumaa
Single-family houses 18,000 26 63 227
DISCUSSION
About 80% of Estonian dwelling houses are single-family houses, but only 30% of the popula-tion live in single-family houses. Since the State Housing Register, which was used for the ran-dom choice of dwellings to be measured, reflects the number of houses in the different counties (not the number of people living there), more measurements were made in single-family houses (66%) than in multi-apartment buildings. If the dwellings had been selected on the basis of the population distribution, most of the measurements would have been carried out in large towns and few in rural areas. However, one of the aims of the survey was to obtain data across the en-tire country. Thus the selection of the houses was made randomly among the dwelling houses in the different counties. It should be emphasized that the measured houses in each county were completely randomly distributed, and that the measurements were not especially directed to known radon risk areas.
In all, radon measurements were made in 515 dwellings. 172 of these dwellings were flats on the ground floor in multi-apartment buildings.
The exposure to the Estonian population due to indoor radon
The indoor radon concentrations (arithmetic mean and maximum values shown by county, type of dwelling and number of residents living in these dwellings) are given in Table 4. This Table has been compiled using the results from the 515 radon measurements that were made during the National Radon Survey.
For radon gas the arithmetic mean in single-family houses was 103 Bqm-3. The activity concentration distribution is shown in Figure 8. All measurements in multi-apartment buildings in this survey were made in flats on the ground floor. Thus, the radon concentrations in multi-apartment buildings are only representative for the flats on the ground floor. In those dwellings, the average arithmetic mean value was 78 Bqm-3. Figure 9 shows the activity concentration distribution in these dwellings. In flats above the ground floor, radon concentrations are much lower, normally less than 30 Bqm-3. Assuming that, on average, the Estonian apartment houses have 3 storeys, 20 - 30% of the population living in multi-apartment buildings live in flats on the first floor. On this assumption, the arithmetic mean for the radon concentration in dwellings in multi-apartment buildings would be 44 Bqm-3. The mean radon activity concentration for all Estonian dwellings (in single family houses and in flats in multi-apartment buildings) will be 60 Bqm-3, given that the assumptions above are correct.
Using the results of the measurements performed within the National Radon Survey the radia-tion dose to the Estonian popularadia-tion due to exposure to radon was calculated. The number of residents in dwellings in single-family houses is 354,600 and in multi-apartment buildings 903,600. Assuming that the average time spent indoors is 7,000 hours per year and applying the conversion factor given by the International Commission on Radiation Protection in ICRP pub-lication 65 [8], 0.021 millisievert (mSv) per year per Bqm-3 (average over 8.760 hours, equilib-rium factor 0.4) the mean annual effective dose for the residents living in single-family houses is 1.7 mSv.
The mean annual effective dose due to radon for the residents in dwellings on the ground floor in multi-apartment buildings is 1.3 mSv. If we assume that the mean radon level for all flats in multi-apartment buildings is 44 Bqm-3, the mean annual effective dose for persons living in multi-apartment buildings will be 0.7 mSv.
15
Annually, 700 new lung cancer cases are recorded in the Estonian Cancer Registry. Of all the cancer cases in the country, the majority, 21 %, are lung cancers. The health statistics show that 32% of Estonians are smokers. Smokers who are exposed to enhanced concentrations of radon have a larger risk of developing lung cancer than non-smokers.
SIngle-family houses
0 5 10 15 20 0-2021-4041-6061-8081-100 101-120121-140141-160161-180181-200201-220221-240241-260261-280281-300301-320 Bq/m3%
Figure 8. Distribution of radon activity concentration in single-family houses in Estonia. (The percentage of values indicated in the interval 301-320 reflects the total number of values exceeding 300Bqm-3.) Multi-apartment buildings 0 2 4 6 8 10 12 14 16 18 20 0-20 21-40 41-60 61-80 81-100 101-120 121-140 141-160 161-180 181-200 201-220 221-240 241-260 261-280 281-300 301-320 Bq/m3
%
Figure 9. Distribution of radon activity concentration in ground floor flats in Estonian multi-apartment buildings. (The percentage of values indicated in the interval 301-320 reflects the total number of values exceeding 300Bqm-3.)
Using the detriment factor 7.3 · 10-5 per mSvgiven by the ICRP [8], our calculations indicate that about 90 Estonians (smokers and non-smokers) can be expected to develop lung cancer an-nually due to radon in their homes. Radon-related lung cancer cases thus would represent 13% of the total number of lung cancer cases, 700 cases, recorded annually in the Estonian Cancer
Registry. Of these radon-related lung cancer cases about 50% would live in single-family houses and 50% in multi-apartment buildings.
The ICRP based its risk assessment on studies on miners. Data from the miner studies indicate a higher excess relative risk from radon exposure for smokers than for non-smokers, but the as-sessment of risk for non-smoking miners is based on too small a number of cases for reliable conclusions to be drawn.
In Sweden, two large residential case-control studies have been made: The Swedish national epidemiological radon study presented in 1993 [9] and Residential radon and lung cancer among never-smokers in Sweden [10] presented in 2000. The increase of the relative risk in both studies is 0.16 per 100 Bq/m-3. The studies also demonstrate a synergistic effect between to-bacco smoking and radon.
In the Swedish studies the lifetime risk for radon-related lung cancer for persons who have never smoked (never-smokers) is 0.007 and for smokers 0.1 [11]. Based on these results and using the statistical distribution of indoor radon concentrations in dwellings found in the Esto-nian National Survey, we have calculated the number of radon-related lung cancer cases for smokers and non-smokers.
Using the Swedish results the total annual number of the radon-related lung cancers would be about 90, of which about 10 cases would be never smokers. Thus, although the health statistics give the percentage of smokers in Estonia as 32%, almost 90% of the radon-related lung cancer cases will be smokers.
Due to uncertainties in the underlying data and in the assumptions, the uncertainty in the esti-mated annu
al number of radon-related lung cancer cases is judged to be about
± 30%.
CONCLUSIONS
“Exposure to radon poses not only an important individual health risk for people exposed to elevated levels of radon, but also an important collective risk for the population. Radon expo-sure in dwellings is an important collective risk in comparison with many other collective risks in society, and the national radon policy should also include general recommendations to reduce the average level and thereby the collective risk of radon exposure to the population.” (ICRP Publication 65) [8].
To reduce the present and future exposure to radon gas in dwellings and at workplaces, and thus the number of radon-related lung cancers, the following two actions are needed:
1) Dwellings and workplaces with radon levels in excess of the action level are to be located and remedial action against in-leakage of radon containing soil air from the ground taken. 2) In new buildings radon problems should be avoided by applying building techniques that
prevent in-leakage of radon containing soil air from the ground.
Usually, intervention measures for existing dwellings are much more expensive than preventive measures taken during the construction of new dwellings. Estonian recommendations for radon in houses were issued in 1999 in the Estonian Building Code (EPN 12.2) [12], with the aim of achieving indoor radon concentrations below 200 Bqm-3 in all buildings (dwellings and work-places). Estonian recommendations exist for the planning and building of radon-safe houses (EPN 12.3) [13]. However, so far the investigation and action levels have not been adopted for
17
The aim of the present national survey was to provide information about indoor radon levels from the whole of Estonia using measurements in randomly chosen dwellings. The results show that there are radon problems in several parts of the country. Thus, there is a need for more in-formation on radon-risk areas. Further surveys should be directed to the location of af-fected dwellings. The first and most important task is to carry out radon measurements in radon-risk areas.
Radon risk mapping, or classification of radon-prone areas, based on measurements in a repre-sentative sample of the building stock combined with the use of information on geology and building construction, has been made in many countries. The results of this mapping are used in the planning of preventive action for new buildings and in the radon surveys in existing buildings to search for radon-affected houses for remedial action.
A new Estonian-Swedish Radon Project (ES605B) was started in 2002. The aim of this project is to continue the radon program in Estonia and to provide information on indoor radon for radon risk mapping. It is important for the prevention of radon-related lung cancers and for the future work on limitation of radon exposure to have more data on indoor radon levels in karst areas, in mining areas and in other regions expected be radon-prone on the basis of geological information.
ACKNOWLEDGEMENTS
This work was supported by the Estonian Environmental Foundation and by the Swedish Ministry for Foreign Affairs . Special thanks are due to Rolf Falk from SSI for his help in the calculation of expected lung cancer cases for smokers and non-smokers in Estonia.
REFERENCES
1. Pahapill, L., Jõgioja, E., Rohumäe, T.: Indoor radon in Estonia. Proc. of the 6th Int. Conf. on Indoor Air Quality and Climate, Vol. 4, pp 471-474. 1993.
2. Pahapill, L., Rulkov, A., Swedjemark, G.A.: Radon in Estonian Buildings. Establishment of a measurements system and obtained results. Swedish Radiation Protection Institute. SSI-report 1996:13. Stockholm .1996.
3. Pahapill, L., Dambis, M., Morkunas, G., Åkerblom, G.: Radon in the Baltic States. In (Edi-tors Søgaard-Hansen J., Damkjær A.): Radiation Protection Issues in the Baltic Region with Emphasis on Co-operative Projects with Estonia, Latvia and Lithuania. Proc. of the Regional IRPA Congress held in Stockholm June 12-13, 1998. Risø National Laboratory. Denmark. 1998.
4 Savitskaja, L.: Radionukliidid Eesti põhjavees. (in Estonian). Keskkonnatehnika 3/99, 1999. 5. Geology and mineral resources of Estonia. Ed. Raukas A. and Teedumäe A. Estonian Acad-emy Publications. 1997.
6. Mellander H., Enflo A.: The alpha track method used in the Swedish radon epidemiological study. Radiation Protection Dosimetry. Vol. 45, No. 1/4, pp 65-71. 1992.
7. Pukkonen, E.: Baltoscandia Dictyonemakiltade võrdlus. Geology and mineral resources of Estonia. Symposium materials (in Estonian). Tallinn. 1991.
8. ICRP: Protection against Radon-222 at Home and at Work. A Report of the International Commission on Radiological Protection. ICRP Publication 65. Pergamon Press. 1993.
9. Pershagen, G., Åkerblom, G., Axelson, O., Clavensjö, B.,Damber, L., Desai, G., Enflo, A., Lagarde, F., Mellander, H., Svartengren, M., Swedjemark, G.A. Residential Radon Exposure and Lung Cancer in Sweden. New England Journal of Medicine, 330: 159-164, 1994.
10. Lagarde, F., Axelsson, G., Damber, L., Mellander, H., Nyberg, F., Pershagen, G.: Residen-tial Radon and Lung Cancer among Never-smokers in Sweden. Epidemiology, Vol. 12, No. 4, 2001.
11. Mjönes, L., Falk, R. Cancers Risks from Radon in Indoor Air and Drinking Water in Sweden. Risk assessment of the Swedish Radiation Protection Authority. Paper presented at the Seventh International Symposium on Natural Radiation Environment (NRE-VII), 220-24 May 2002, Rhodes, Greece. Paper accepted for publication in Elsevier “Radioactivity in the Envi-ronment” Book Series.
12. Sisekliima. Eesti projekteerimisnormid, EPN 12.2. (in Estonian)Eesti Ehitusteave, 1999. 13. Radooniohutu hoone projekteerimine. Eesti projekteerimisnormid, EPN 12.3.(in Estonian). Eesti Ehitusteave, 2000.
19
APPENDIX 1
Table 1. Indoor radon concentrations in the dwellings measured 1994-1997.
Arithmetic mean (Am), geometric mean (Gm) and maximum values (Max) of indoor radon concentrations, and the distribution (%) of indoor radon activity concentrations
(Bqm-3) are shown.
Indoor 222Rn, Bqm-3 Distribution of indoor
222
Rn concentrations (Bqm-3), %
Area No. offlats
Am Gm Max <100 101-200 201-400 401-800 >801 Tallinn 161 63 30 630 90 7 2 1 -Kunda-94 50 151 91 1,223 54 28 8 8 2 Kunda-95* 28 234 142 1,392 43 21 14 18 4 Kunda-96* 12 3,983 1,364 12,421 12 13 - 8 67 Kunda-97* 10 973 474 3,500 20 5 15 15 45 Aseri 42 91 57 526 62 31 2 5 -Rakvere 78 68 47 499 69 21 9 1 -Toila 46 361 260 878 11 17 35 35 2 Paldiski 14 163 85 769 43 29 14 14 -Vooremaa 28 97 80 263 57 41 3 - -Raasiku 29 106 76 471 64 21 12 3 -Narva 51 95 68 466 73 13 12 2 -Kuusalu 10 46 44 69 100 - - -
2003:01 Avfall och miljö vid de kärntekniska anläggningarna; tillsynsrapport 2001
Avdelningen för avfall och miljö. Monica Persson et.al.
2003:02 Stråldoser vid användning av torv-bränsle i stora anläggningar
Avdelning för beredskap och miljöövervakning.
Hans Möre och Lynn Marie Hubbard. 80 SEK 2003:03 UV-strålning och underlag för be-dömning av befolkningsdos från solarier i en storstadsregion
Avdelning för beredskap och miljöövervakning.
Björn Nilsson, Björn Närlundh och Ulf Wester. 70 SEK 2003:04 Enkätundersökning av entreprenörers inställning till strålning och strålskyddsutbildning vid de svenska kärnkraftverken
Avdelning för personal- och patientstrålskydd
Ingela Thimgren 60 SEK 2003:05 Radiofarmakaterapier i Sverige
– kartläggning över metoder
Avdelning för personal- och patientstrålskydd
Helene Jönsson 60 SEK 2003:06 Säkerhets och strålskyddsläget vid de svenska kärnkraftverken 2002
2003:07 Mätning av naturlig radioaktivitet i dricksvatten. Test av mätmetoder och resultat av en pilotundersökning
Avdelning för beredskap och miljöövervakning.
Inger Östergren, Rolf Falk, Lars Mjönes och Britt-Marie Ek 70 SEK 2003:08 Optisk strålning strålskydd
Avdelning för beredskap och miljöövervakning.
Anders Glansholm 70 SEK 2003:09 Årlig kontroll av diagnostisk röntgenut-rustning för medicinskt bruk – en utredning av kontrollverksamheten
Avdelning för personal- och patientstrålskydd
Anja Almén och Torsten Cederlund 70 SEK 2003:10 Förändring av stråldoser till patienter vid övergång från konventionell till digital, filmlös teknik vid röntgenundersökning av grovtarm och njurar Slutrapport SSI-projekt P 933
Avdelning för personal- och patientstrålskydd
Börje Sjöholm och Jan Persliden 60 SEK 2003:11 AMBER and Ecolego Intercomparisons Using Calculations from SR97
Avdelningen för avfall och miljö Gemensam SKI och SSI rapport
SSI-rapporter 2003
SSI reports 2003
2003:12 Analysis of Critical Issues in Biosphere Assessment Modelling and Site Investigation Avdelningen för avfall och miljö
M. J. Egan, M. C. Thorne, R.H. Little and
R.F. Pasco 60 SEK 2003:13 Personalstrålskydd inom kärnkraft-industrin under 2002
Avdelning för personal- och patientstrålskydd
Stig Erixon, Peter Hofvander, Ingemar Lund, Lars Malmqvist, Ingela Thimgren, Hanna Ölander Gür 60 SEK 2003:14 Exchange processes at
geosphere-biosphere interface. Current SKB approach and ex-ample of coupled hydrological-ecological approach Avdelningen för avfall och miljö
Anders Wörman 60 SEK 2003:15 Föreskrifter om planering inför och un-der avveckling av kärntekniska anläggningar Avdelningen för avfall och miljö och Avdelning för perso-nal- och patientstrålskydd.
Henrik Efraimsson och Ingemar Lund 60 SEK 2003:16 Radon in Estonian dwellings - Results from a National Radon Survey
Internationellt utvecklingssamarbete (SIUS) Lia Pahapill, Anne Rulkov, Raivo Rajamäe och
Adress: Statens strålskyddsinstitut; S-17116 Stockholm; Besöksadress: Karolinska sjukhusets område, Hus Z 5. Telefon: 08-729 71 00, Fax: 08-729 71 08
Address: Swedish Radiation Protection Authority; SE-17116 Stockholm; Sweden
Telephone: + 46 8-729 71 00, Fax: + 46 8-729 71 08 www.ssi.se
tatens strålskyddsinstitut, ssi, är central tillsynsmyndig-het på strålskyddsområdet. Myndigtillsynsmyndig-hetens verksamtillsynsmyndig-hetsidé är att verka för ett gott strålskydd för människor och miljö nu och i framtiden. SSI är ansvarig myndighet för det av riksdagen beslutade miljö-målet Säker strålmiljö.
SSI sätter gränser för stråldoser till allmänheten och för dem som arbetar med strålning, utfärdar föreskrifter och kontrollerar att de efterlevs. Myndigheten inspekterar, informerar, utbildar och ger råd för att öka kunskaperna om strålning. SSI bedriver också egen forskning och stöder forskning vid universitet och högskolor.
SSI håller beredskap dygnet runt mot olyckor med strålning. En tidig varning om olyckor fås genom svenska och utländska mät-stationer och genom internationella varnings- och informationssystem. SSI medverkar i det internationella strålskyddssamarbetet och bidrar därigenom till förbättringar av strålskyddet i främst Baltikum och Ryssland.
Myndigheten har idag ca 110 anställda och är beläget i Stockholm. the swedish radiation protection authority (ssi) is the government regulatory authority for radiation protection. Its task is to secure good radiation protection for people and the environment both today and in the future.
The Swedish parliament has appointed SSI to be in charge of the implementation of its environmental quality objective Säker strålmiljö (“A Safe Radiation Environment”).
SSI sets radiation dose limits for the public and for workers exposed to radiation and regulates many other matters dealing with radiation. Compliance with the regulations is ensured through inspections.
SSI also provides information, education, and advice, carries out its own research and administers external research projects.
SSI maintains an around-the-clock preparedness for radiation accidents. Early warning is provided by Swedish and foreign monitoring stations and by international alarm and information systems. The Authority collaborates with many national and international radiation protection endeavours. It actively supports the on-going improvements of radiation protection in Estonia, Latvia, Lithuania, and Russia.
SSI has about 110 employees and is located in Stockholm.