Validation of dose calculation
programmes for recycling
2002:23 SHANKAR MENON, CHRISTINE BRUN-YABA, CHARLEY YU, JING-JY CHENG, JAN BJERLER AND ALEXANDER WILLIAMS
SSI rapport : 2002:23 december 2002 ISSN 0282-4434 AUTHOR/ FÖRFATTARE: Shankar Menon, Christine Brun-Yaba, Charley Yu, Jing-Jy
Cheng, Jan Bjerler and Alexander Williams.
DIVISION/ AVDELNING: Department of Waste Management and Environmental Protection/ Avdelningen för avfall och miljö.
TITLE/ TITEL: Validation of dose calculation programmes for recycling/ Validering av datorprogram för uppskattning av stråldoser vid återvinning av metaller. SUMMARY: This report describes a validation of the computer codes RESRAD-RE-CYCLE and CERISE, which are used to estimate radiation doses due to the recycling of scrap metal. Calculated external radiation doses to individuals are compared with measured data from different steps of the processing of slightly contaminated mate-rial, mainly in Studsvik, Sweden.
SAMMANFATTNING: Rapporten beskriver en validering av datorprogrammen RES-RAD-RECYCLE och CERISE, vilka används för att uppskatta av stråldoser vid åter-vinning av metaller. Beräknade externa stråldoser jämförs med mätdata från olika hanteringssteg vid behandlingen av kontaminerat skrot, främst i Studsvik.
Författarna svarar själva för innehållet i rapporten.
The conclusions and viewpoints presented in the report are those of the author an do not necessarily coincide with those of the SSI.
Preface
This report contains the results from an international project initiated by the SSI in 1999. The primary purpose of the project was to validate some of the computer codes that are used to esti-mate radiation doses due to the recycling of scrap metal. The secondary purpose of the valida-tion project was to give a quantificavalida-tion of the level of conservatism in clearance levels based on these codes. Specifically, the computer codes RESRAD-RECYCLE and CERISE were used to calculate radiation doses to individuals during the processing of slightly contaminated material, mainly in Studsvik, Sweden. Calculated external doses were compared with measured data from different steps of the process.
The conclusions and viewpoints presented in the report are those of the authors and do not nec-essarily coincide with those of the SSI or any other of the participating organisations. The par-ticipants, both individual and organisational, do not make any warranty, expressed or implied, or assume any legal liability or responsibility for any third party’s use, or the results of such use, of any information, apparatus, product, or progress disclosed or discussed in this report, or rep-resent that its use by such third party would not infringe privately owned rights.
The comparison of calculations and measurements shows that the computer code calculations resulted in both overestimations and underestimations of the external doses for different recy-cling activities. The SSI draws the conclusion that the accuracy is within one order of magnitude when experienced modellers use their programmes to calculate external radiation doses for a recycling process involving material that is mainly contaminated with cobalt-60. No errors in the codes themselves were found. Instead, the inaccuracy seems to depend mainly on the choice of some modelling parameters related to the receptor (e.g., distance, time, etc.) and simplifica-tions made to facilitate modelling with the codes (e.g., object geometry).
Clearance levels are often based on studies on enveloping scenarios that are designed to cover all realistic exposure pathways. It is obvious that for most practical cases, this gives a margin to the individual dose constraint (in the order of 10 microsievert per year within the EC). This may be accentuated by the use of conservative assumptions when modelling the enveloping scenar-ios. Since there can obviously be a fairly large inaccuracy in the calculations, it seems reason-able to consider some degree of conservatism when establishing clearance levels based on cal-culations. The parameters used in enveloping scenarios have however not been specifically studied in this report.
Contents
EXECUTIVE SUMMARY ... 3
1 INTRODUCTION ... 13
2 OVERVIEW OF THE VALIDATION PROJECT... 14
2.1 AIM OF THE PROJECT ...14
2.2 PARTICIPANTS IN THE PROJECT ...14
2.3 EXECUTION OF THE PROJECT ...15
3 PHASE 1 ACTIVITIES ... 17
3.1 MEASUREMENTS...17
3.1.1 Background measurements at Åkers...17
3.1.2 Measurement at Åkers with addition of Studsvik ingots...17
3.1.3 Measurement of dose rate during transport of ingots ...18
3.1.4 Background measurements/measurements during melting at Studsvik...18
3.2 CALCULATIONS...18
3.2.1 Scenario description ...19
3.2.2 Mass partitioning factors...19
3.2.3 Radionuclide partitioning factors...19
3.2.4 Exposure pathways ...19
3.2.5 Source geometries and exposure parameters...20
3.2.6 Dose conversion factors ...20
3.2.7 Results and comparisons ...20
3.3 CONCLUSIONS OF PHASE 1...28
4 PHASE 2 ACTIVITIES ... 29
4.1 OBJECT...29
4.2 MELTING OPERATIONS ...29
4.3 DOSE RATE/DOSE/ACTIVITY MEASUREMENTS ...30
4.4 CALCULATION OF PHASE 2 MELTING...30
4.4.1 Scenario description ...31
4.4.2 Mass partitioning factors...31
4.4.3 Radionuclide partitioning factors...32
4.4.4 Exposure pathways ...32
4.4.5 Source geometries and exposure parameters...32
4.4.6 Dose conversion factors ...32
4.4.7 Results and comparisons ...33
5 COMPARISON OF CALCULATIONS WITH MEASUREMENTS ... 39
5.1 POSSIBLE EXPLANATIONS AND THEIR SIGNIFICANCE ...39
5.1.1 Fuel rack cutting scenario ...39
5.1.2 Furnace scenario...41
ATTACHMENTS 1 Project team
2 Brief descriptions of companies/programmes 3 Details of measurements, Phase 1
4 Details of measurements, Phase 2
5 Sectional view of Studsvik melting furnace 6 Some photographs from Phase 2 operations
7 Technical description of electronic dosimeter RAD-100 8 Benchmarking calculations
Executive summary
Introduction
For the nuclear industry, the minimisation of the volumes of radioactive waste arising from the refurbishment or decommissioning of nuclear facilities has been a high priority goal. The recy-cling of very low level radioactive material (or its reuse or disposal) without radiological restric-tions, instead of disposal as radioactive waste, has long been identified as a significant means of achieving this aim. For regulators, it is important to develop guidance for recycling that ade-quately protects human health and the environment. Various international and national bodies such as the International Atomic Energy Agency, the European Commission, the US Nuclear Regulatory Commission have put forward proposals or guidance documents to regulate the ‘clearance’ of this surplus material from regulatory control, in order to allow its recycling as a material management practice.
All these proposals are based on predicted scenarios for subsequent utilisation of the released materials. The calculation models used in these scenarios tend to utilise conservative data re-garding exposure times and dose uptake as well as other assumptions as a safeguard against uncertainties.
Another aspect is common to all these calculation models and codes: none of them has ever been validated by comparison with the actual real life practice of recycling. The Swedish Radia-tion ProtecRadia-tion Institute initiated the ValidaRadia-tion Project in order to validate some of the assump-tions made in these calculation models, and, thereby, better assess the radiological consequences of recycling on a practical large scale.
The validation was proposed to be carried out by the following chain of operations:
• Two consignments of contaminated scrap, each of about 30 tons, were to be melted at Studs-vik RadWaste, Sweden.
• Ingots resulting from this melting, which have decayed to activity concentrations below re-lease levels established by Swedish authorities, were to be transported to Åkers AB, Sweden. At Åkers AB, the ingots were to be remelted in the Åkers commercial foundries, along with uncontaminated scrap, for future use in the manufacture of rolls.
• The radiation doses to workers and other parameters were to be measured (1) during the operations at Studsvik, (2) during transport of the released ingots to Åkers, and (3) during the remelting of the ingots (along with other scrap) and manufacture of rolls from the resulting steel.
• The doses were also to be estimated using the RESRAD-RECYCLE and the CERISE pro-grammes.
• A report was to be prepared comparing the measured radiation doses with those predicted by the calculations.
Participants in the project
The project was a co-operation between the following organisations:
• Swedish Radiation Protection Institute (SSI) initiated the project and is responsible for the central project management and for work not normally within the operational scope of the other partners. SSI constitutes the radiation protection and regulatory authority in Sweden. • Studsvik RadWaste AB (Sweden) has a facility, in a radiologically controlled area, for
melt-ing contaminated metal scrap. The resultmelt-ing melt-ingots are allowed to decay. Afterwards, the in-gots are used as feed material and mixed with uncontaminated scrap by remelting at com-mercial foundries.
• Åkers AB (Sweden) is a major manufacturer of rolls for both hot and cold rolling in the in-ternational steel and non-ferrous metal industries. It is a customer of ingots produced at Studsvik RadWaste AB.
• The United States Department of Energy (USDOE), which has a large number of surplus nuclear facilities, the decommissioning of which will result in a considerable amount of re-cyclable material. The Department is therefore interested in validating calculation pro-grammes used in connection with the clearance of material from regulatory control.
• Argonne National Laboratory (USA) developed the RESRAD-RECYCLE code under the sponsorship of the United States Department of Energy (USDOE). The code assesses the ra-diological doses for workers and the public, resulting from exposure to radionuclides in re-cycled metal with residual radioactivity.
• Institute de Radioprotection et Securité Nucléaire, IRSN, (France) has developed the CE-RISE code for the dose uptake through different pathways when an individual is exposed to ionising radiation. IRSN is an advisor to the radiation protection authorities in France. The name of IRSN has been changed to Institut de Radioprotection et Securité Nucléaire (IRSN) in Feb 2002.
• Belgoprocess (Belgium) is developing a process of milling very low level contaminated con-crete, with a view to recycling it without radiological restrictions. The company is participat-ing as an observer in order to study the possibility of a validation project for the RESRAD-RECYCLE and CERISE codes for concrete.
• Studsvik Stensand AB is a nuclear and other services company within the Studsvik group. Among the services it provides are health physics supervision as well as radiological meas-urements and analysis.
• Menon Consulting AB, which has been responsible for the project management and co-ordination of the various activities within the project.
Execution of the project
The actual execution of the project was slightly different from that originally planned. The first phase (melting of contaminated scrap at Studsvik, release of ingots and transport to Åkers) was carried out. The ingots were re-melted along with other (uncontaminated) scrap at Åkers to be used for manufacturing rolls. The doses to workers were measured at Studsvik, Åkers and dur-ing dur-ingot transport.
Dose calculations were made in parallel with these operations using the RESRAD-RECYCLE and CERISE programmes. However, the results of these calculations could not be compared with the corresponding values of doses taken by workers, because all of the doses were below the limit of detection.
Originally, it was not the aim of the project to make a comparison between the two calculations programmes as such. However, as both programmes were used on the same input basis, it was possible to make certain comparisons.
Due to the fact that there were no detectable doses during the execution of the first phase of the project, it was decided that Phase 2 of the project should involve the melting of scrap with sig-nificantly higher levels of activity, instead of being a repetition of Phase 1. This was achieved by studying the melting of a stainless steel fuel rack for the purpose of volume reduction. The activity concentration was about 160 Bq/g, mostly Co-60. The occurrence of detectable doses enabled a comparison between calculated and measured doses.
The fuel rack was melted in the Studsvik facility in the middle of January 2001, in the presence of project team including the dose modellers. Their presence and the discussions that were held in connection with the Phase 2 operation helped to model the calculations in accordance with the operations at Studsvik.
Overview of measurements and calculations during Phase 1
MEASUREMENTS
The measurement campaigns during Phase 1 consisted of:
• background measurements at Åkers. Measurements at Åkers during ‘normal’ melting of scrap (without Studsvik ingots);
• measurements at Åkers during a melt with addition of Studsvik ingots; • background measurements during transportation between Studsvik and Åkers; • measurements during transport of ingots from Studsvik to Åkers;
• background measurements at Studsvik new melting facility; and
• dose rate measurements at Studsvik during a complete cycle of melting of radioactive scrap (receipt/segmenting/storage/melting/storage).
The background radiation in the Åkers plant and the scrap yard was 200–300 cps (where 1 cps is approximately equal to 1 nSv/h for Co 60), with a few exceptions where higher levels (700– 800 cps) were noted. These slightly elevated areas of activity are probably due to the use of slag from earlier times in building material. No measurable doses over average background (150– 200 nSv/h) were observed adjacent to the furnace during the normal melting activities (i.e., without Studsvik ingots). Traces of Ra-226 and Th-232 were found in the slag and dust from furnace ventilation.
During these background measurements, an interesting piece of information was identified: the paint used to coat the moulds for the manufacture of rolls contained 3 500–5 500 Bq/l of Ra-226 (85 %) and Th-232 (15 %). Air sampling revealed no detectable alpha or beta activity. No de-tectable activity levels were observed during the whole body monitoring of the personnel in-volved in these operations.
Measurements were also carried out at Åkers during the melting of 24 tons of steel including 7.5 tons of Studsvik ingots with an average activity of 0.4 Bq/g Co-60. The resulting material had an average content of 0.15 Bq/g Co-60.
The on line dose rate measurement adjacent to the furnace showed a slightly higher dose rate: 150–250 nSv/h compared to 150–200 nSv/h during ‘normal’ melting without Studsvik ingots. The background in the rest of the plant was normal, i.e. 200–300 cps. The personal air filter analysis showed the same level of Cs-137 as during normal melting.
During the transport of 30 tons of ingot (average activity concentration 0.4 Bq/g), there was no measurable difference in the dose to the driver, with ingots on the 1.25-hour trip from Studsvik to Åkers or empty on the trip back.
The Studsvik melting facility was brand new, while the cutting hall had been in service for five years, which explains the 300–350 cps background dose rate in the cutting hall, compared to the 200–250 cps in the newer areas. There were considerably higher levels in the neighbourhood of the slag binding product (400 cps), stampmass for the furnace (700 cps), new insulation (600 cps) and the new asphalt outside the plant (700 cps).
On-line dose rate measurements were made in the door between the cutting and melting halls. About seven tons of scrap was melted in three melts during a total of about 8.5 hours. During the first five hours, the dose rate varied between 0.3 and 0.4 µSv/h. During the next three hours, there were two periods of dose rates up to 0.6 µSv/h. There are no direct explanations for this from the melting process point of view.
None of the personnel involved took detectable doses above the limit for registration (i.e. >0.1 mSv) during the operations.
CALCULATIONS
In the phase I calculations, five scenarios representative of the main working posts in the Studs-vik facility were considered. Thirty tons of scrap steel were loaded to the StudsStuds-vik induction furnace in 10 three-ton batches and melted. After the melting, the slag material was poured out, cooled, and handled by a slag worker. The steel melt remaining in the furnace was placed in large containers, cooled, and cast into ingots. The solid ingots were subsequently transported to a commercial facility for further processing. Radionuclides considered in dose calculations were Co-60, Zn-65, Sr-90, Tc-99, Cs-137, Am-241, U-238, Pu-239, and Ac-227, each treated sepa-rately at an activity concentration of 1 Bq/g.
Dose calculations were conducted for five different activities in the Studsvik facility: (1) sorting and cutting scrap metal after its reception; (2) scrap melting, excluding slag work; (3) slag han-dling; (4) ingot handling, including transfer and storage of ingot products; and (5) ingot trans-port. Five scenarios were developed to evaluate the doses to various workers: (1) scrap proces-sor, who sorted and cut scrap metal into smaller pieces for melting, (2) furnace operator, who loaded the scrap metal to the furnace and operated the furnace, (3) slag worker, who removed the slag material from the top of the melt surface with a special tool and put it in a metallic box for cooling, (4) ingot caster, who poured the melt into moulds, moved the moulds for cooling, and removed the solid ingot from the moulds, and (5) ingot truck driver, who transported the solid ingots to Åkers for further processing.
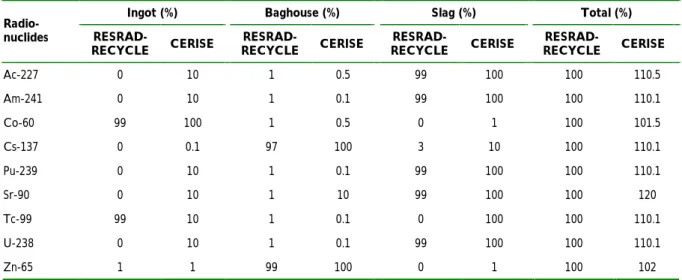
RESRAD-RECYCLE and CERISE used the same mass partitioning factors: 90 % for ingot, 1 % for baghouse dust, and 10 % for slag, for dose calculations. The radionuclide partitioning factors used in dose calculations were different for the two codes.
With one exception, exposure pathways considered for each of the five activities were external radiation, inhalation, and ingestion. For the ingot truck driver, only the external radiation path-way was considered.
To model external radiation exposure, the radiation source was simulated by a full or half cylin-der with dimensions (radius and thickness) representing the source geometry. An external dose conversion factor for each scenario was calculated on the basis of the dimensions of the cylin-drical source, the exposure distance, and the density of the source material. Attenuation of ex-ternal radiation was considered for the ingot truck driver scenario, resulting from the shielding of the truck cab.
Best judgement assumptions were made of the inhalation rate and the respirable fraction of the airborne dust. The dust loading factor and concentration of radionuclides in the dust varied ac-cording to the source material for the respective operation, e.g. scrap material for scrap proces-sors, slag for slag workers, etc.
Both calculation programmes assumed an incidental ingestion of dust particles, with radionu-clide concentrations at the same levels as for inhalation. The RESRAD-RECYCLE calculations assumed, in addition, that inhaled particles larger than of respirable size, would be ingested. The inhalation and ingestion dose conversion factors used in the RESRAD-RECYCLE calcula-tions were obtained from FGR No. 11 (Eckerman et al., 1988). Dose conversion factors used in CERISE calculations were obtained from the EU Basic Safety Standards (Council Directive 96/29/EURATOM). The external dose conversion factors calculated by the two computer codes were obtained by assuming the same geometry and exposure distances; however, the mathe-matical models used were different.
Because of these differences in the external radiation models of the two calculation codes, the external dose conversion factors are different, generally within a factor of 2 except for the two beta emitters, Sr-90 and Tc-99. The RESRAD-RECYCLE results for those radionuclides are much larger than the CERISE results.
Differences in the external dose results are caused by differences in the external dose conversion factors and differences in the radionuclide partitioning factors. The ratio of the dose results (RESRAD-RECYCLE/CERISE), if adjusted by the ratio of the dose conversion factor and the ratio of the radionuclide partitioning factor, are very close to 1. The only exceptions are the adjusted ratios for Zn-65 for the ingot handling and ingot transport scenarios.
For the inhalation pathway also, there was agreement between the calculation code results, us-ing the same dose conversion and radionuclide partitionus-ing factors, except in the case of Zn-65 for the ingot handling scenario.
The ingestion pathway results show understandable differences due to the RESRAD-RECYCLE assumption of the ingestion of inhaled dust particles larger than of respirable size. If normalised, the RESRAD-RECYCLE/CERISE adjusted ratio is very close to 1 when the inhalation route of exposure is insignificant compared with the incidental ingestion route of exposure (e.g. the re-ception worker and ingot handling worker scenarios). When the inhalation route of exposure becomes more significant, the value of the adjusted ratio becomes larger. For the melting worker and slag worker, the adjusted ratios are close to 1.5 for all the radionuclides considered. A difference that cannot yet be explained is the small value (about 0.1) of the adjusted ratio for Zn-65 for the ingot handling and ingot transport scenarios.
Overview of execution, measurements and calculation during
Phase 2
EXECUTION
The main result of the Phase 1 activities was that the primary aim of the validation exercise, i.e., comparison of actual doses taken by workers with corresponding values calculated by the codes, could not be realised: the doses were, in every case, below the limits of detection. A different approach was therefore used for Phase 2, which had originally been planned to be a repetition of Phase 1. Instead it was decided to melt an object with high enough activity to give detectable doses to workers.
The chosen object was a stainless steel fuel rack from a Swedish nuclear power plant, which had been packed into a 20-foot container. The maximum dose rate on the outside of the container was 0.2 mSv/h. The rack had a total mass of 3.4 (metric) tons. Nuclide specific measurements (made from outside the package) indicated an average radioactivity content of 109 kBq/kg, mostly Co-60. It was expected that such a concentration should give a surface dose of about 50 µSv/h on the ingots after melting. The surface dose rates on the racks before melting would be significantly higher. This implied that the personnel engaged in the various stages of the melting operations would be exposed to measurable doses.
The rack was delivered in the container to Studsvik. Normally, the operations comprising the melting process consist of the following:
• reception of package/unpacking; • segmenting of racks (plasma torch); • storage of segmented pieces; • melting;
• slag handling; • filter dust handling;
• handling and transport of ingots; and • storage of ingots.
In the treatment of the fuel rack, the segmented pieces were taken directly for melting, the filter dust quantity was too small to be collected and ‘handled’ and storage of the ingots was not con-sidered.
The truck drivers transported the container with the fuel rack into the melting facility at Studs-vik. The scrap unloaders unloaded the fuel rack from the transport vehicle. The scrap cut-ters/sorters dissembled the fuel rack and cut it into smaller pieces that could be fed to the fur-nace. The cutting process produced a small quantity of swarf. The furnace operators loaded the fuel rack to the furnace and operated the furnace. After the ingot melt was poured into vertical moulds, the ingot handlers A moved the ingot (in moulds) away for cooling. After cooling, ingot handlers B removed the solid ingots from moulds. The solid ingots were then put on wooden pallets in a storage area by the ingot fork driver. During melting of the fuel rack, slag from the melt surface was removed by the slag handler with a special tool and was put in a metallic box in the same area for further processing.
MEASUREMENTS
All personnel involved in the project operations were equipped with electronic (display) do-simeters. In order to make direct comparisons with the calculations, the electronic dosimeters were provided with dose codes corresponding to various operations, as follows:
Dose code 610: Transport of container into workshop.
Dose code 611: Opening of container, lifting of fuel rack, removing of plastic foil wrapping, setting up rack for cutting.
Dose code 612: Segmenting of fuel rack (plasma torch). Dose code 613: Melting, slagging, pouring into moulds. Dose code 614a: Handling of ingots in moulds (i.e. shielded).
Dose code 614b: Handling of ingots after cooling and removal from moulds (i.e. unshielded). Dose code 615: Transport of ingots to storage.
The measurements showed that segmenting was the work operation that gave the highest dose, almost 65 % of the total dose incurred, while melting itself accounted for only about 13 %.
CALCULATIONS
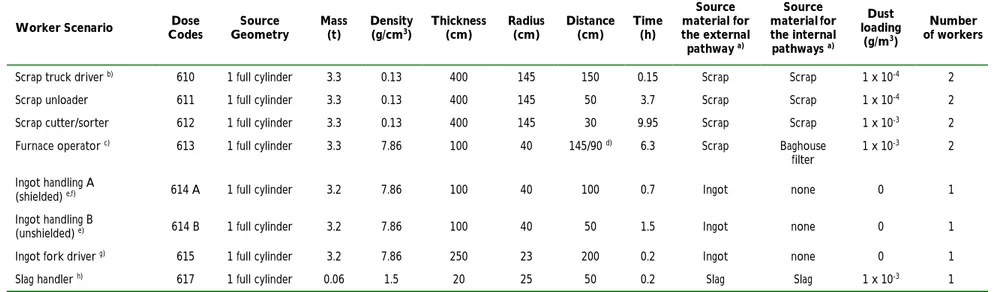
To facilitate dose calculations, the geometry of the radiation source, exposure distance between the source and the worker, and the time span of each operation were developed on the basis of the real operations. All the parameter values used in the dose calculations were based on the Studsvik values except for the inhalation and ingestion dose conversion factors, for which the FGR values and the European Directive values were used by RESRAD-RECYCLE and CE-RISE, respectively.
Eight exposure scenarios were developed to account for the various operations conducted during the melting process. These eight scenarios evaluated doses to the following work groups: (1) scrap truck drivers, (2) scrap unloaders, (3) scrap cutters/sorters, (4) furnace operators, (5) ingot handlers A (during ingot cooling in moulds), (6) ingot handlers B (after ingot cooling and removal from moulds), (7) ingot fork driver, and (8) slag handler.
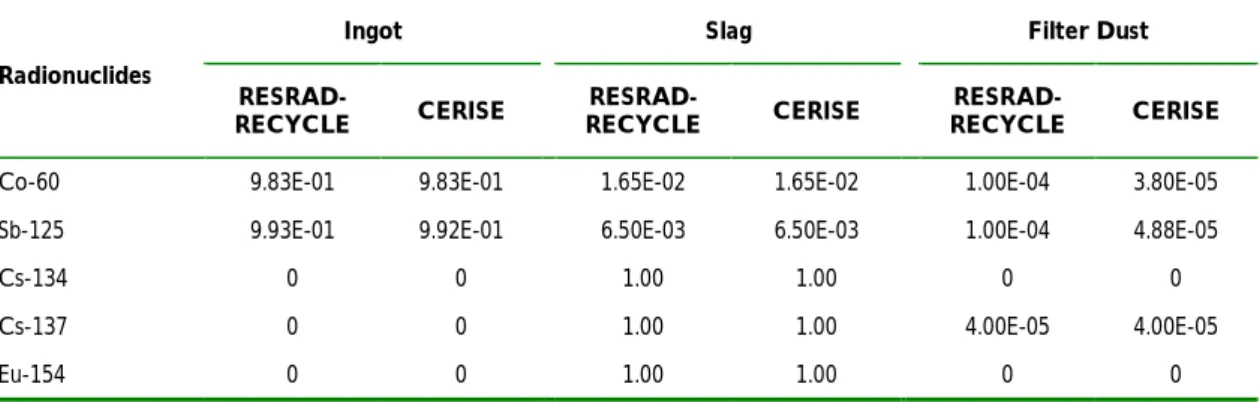
Mass partitioning factors used in dose calculations were developed from the measured masses of the ingot product, the slag product, and filter dust and with application of the principle of mass conservation. The cutting swarf (2 kg) was neglected in RESRAD-RECYCLE and CE-RISE calculations because its mass was very small compared with the mass of the fuel rack. The partitioning factors used by RESRAD-RECYCLE were 98.35 % for ingot, 1.64 % for slag, and 0.01 % for filter dust. The partitioning factors used by CERISE were 98.3 % for ingot, 1.65 % for slag, and 0.004 % for filter dust.
Radionuclide partitioning factors used for dose calculations were developed on the basis of the measured activity contents in ingot, slag, and dust filters. Like the calculations for mass parti-tioning factors, for RESRAD-RECYCLE dose calculations, the measured radionuclide contents in the cutting swarf were neglected and subtracted from the total contents. For CERISE dose calculations, the partitioning factors were calculated by normalizing the radionuclide content in ingot, slag, and filter dust, respectively, with the total content of radionuclides (including those in the cutting swarf).
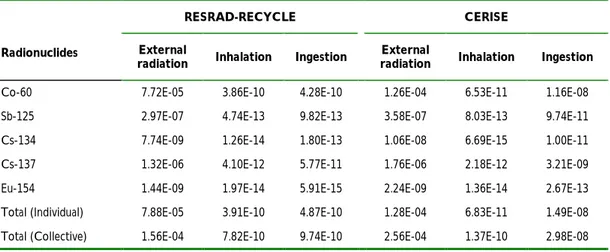
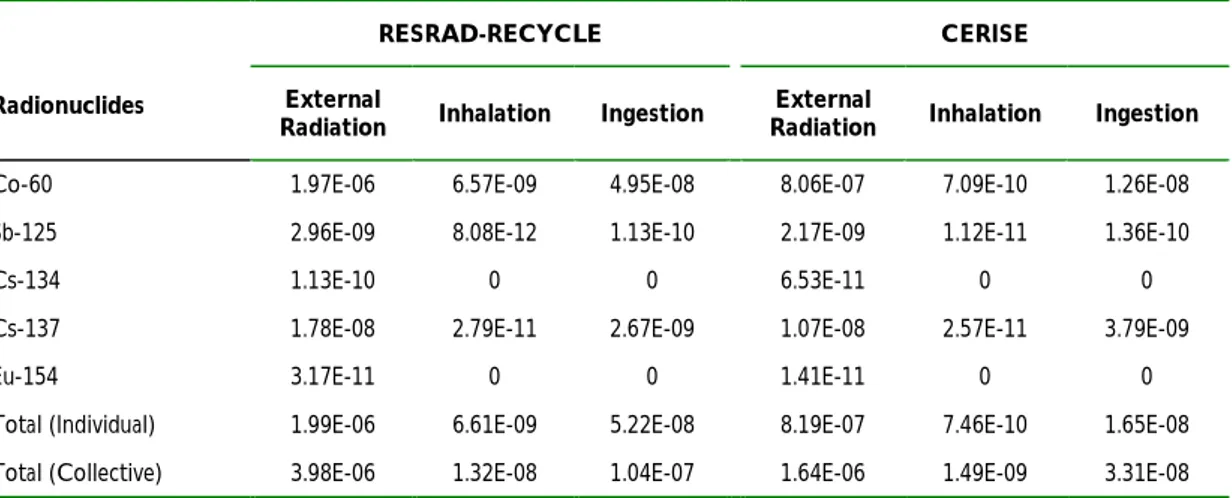
Radionuclide concentrations in the fuel rack were calculated from information on total mass and amount of radionuclides in the three melting products. Concentrations in the fuel rack were calculated as 157 Bq/g for Co-60, 3.66 Bq/g for Sb-125, 0.027 Bq/g for Cs-134, 10.82 Bq/g for Cs-137, and 0.0060 Bq/g for Eu-154.
Exposure pathways considered for dose calculations were external radiation, inhalation, and ingestion. For the ingot handler and ingot fork driver, radiation exposures from the inhalation and ingestion pathways were insignificant because little dust loading occurred during the opera-tions. For the other scenarios, exposures from inhalation and ingestion were considered through the use of an inhalation rate of 1.2 m3/h and an ingestion rate of 0.00625 g/h.
The source geometries and exposure parameters used by RESRAD-RECYCLE and CERISE for dose calculations were similar for the various operations, except in the case of the ingot handler and ingot fork driver, where different source dimensions were used by the two codes. This dif-ference was due to different perceptions regarding representing a radiation source of five ingots with a cylindrical geometry.
For the scrap truck driver scenario, the external radiation was considered to be attenuated by the truck cab. During the handling of ingot melt, ingot handlers A were shielded from radiation by the moulds, while ingot handlers B were unshielded. The slag container shielded the slag
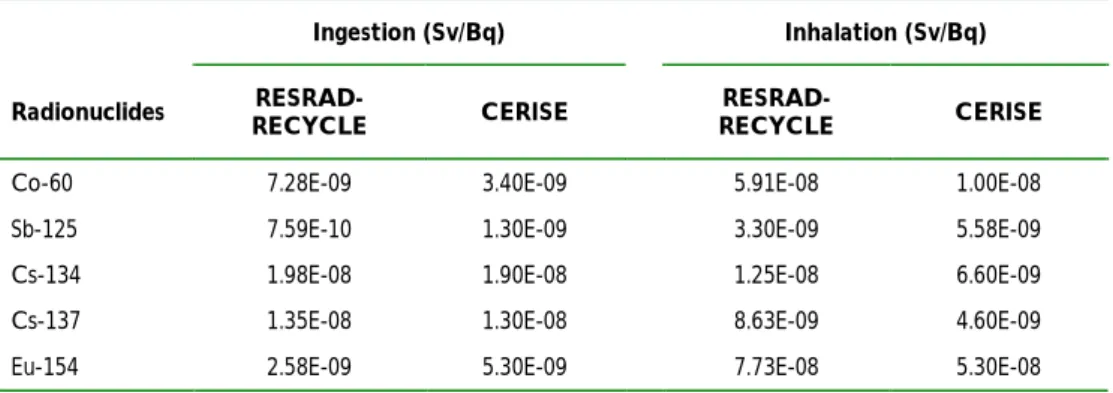
hand-ler. The ingot fork driver took five ingots to storage at a time; therefore, dimensions of the ra-diation source were developed to consider potential rara-diation exposure from the five ingots. The internal dose conversion factors used in RESRAD-RECYCLE calculations were obtained from FGR 11; those used in CERISE calculations were obtained from European Directive. Dose conversion factors for external radiation were calculated by the two codes.
Among the three exposure pathways analysed, radiation exposure from the external radiation pathway was far more significant than radiation exposure from the two internal radiation path-ways (inhalation and ingestion). Radiation exposures incurred by the scrap unloaders and scrap cutters/sorters were greater than those incurred by the other workers because of the closer expo-sure distances and longer expoexpo-sure times experienced by the scrap unloaders and scrap cut-ters/sorters.
External radiation doses calculated by RESRAD-RECYCLE were smaller than those calculated by CERISE for the scrap truck drivers, scrap unloader, and scrap cutter/sorter. For the furnace operator and ingot handler scenarios, in contrast, RESRAD-RECYCLE results were greater than CERISE results. For the ingot fork driver and slag handler, dose results from the two codes were about the same. Larger differences were observed for the two ingot handling scenarios because of different geometries and dimensions assumed in the dose calculations.
Comparison of calculations with measurements/conclusions
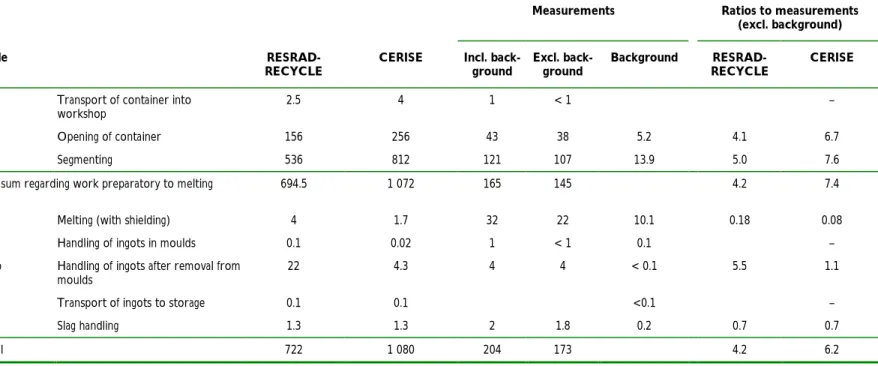
Table I shows a comparison of the RESRAD-RECYCLE and CERISE calculation results with the electronic dosimeter measurements for each dose code. The table has been divided into doses taken during work preparatory to melting and doses taken during and after melting.
Some comments on the table:
• Significant measured doses are noted only for the following scenarios: unloading of the fuel rack (611) and its cutting (612) and for the melting operations (613). For the other scenarios, measured doses are given but these are very low due to the short duration of work station ac-tivity (fuel rack transport into the building, ingot and slag handling, ingot truck transport). • The part sum of doses shows that the pre-melting preparatory work accounted for 84 % of
the total doses, while the melting itself with ingot and slag handling were responsible for the remaining 16 %.
• There is an overestimation by the codes for the doses under dose codes 611, 612 and 614b, covering 86 % of the total dose; and an underestimation of the doses under codes 613 and 617.
Table I. Phase 2 – Comparison of doses per dose code between RESRAD-RECYCLE/CERISE and electronic dosimeter measurements. (All values in micromanSv.)
Measurements Ratios to measurements (excl. background)
Code
RESRAD-RECYCLE CERISE Incl. ground back- Excl. back-ground Background RESRAD-RECYCLE CERISE 610 Transport of container into
workshop 2.5 4 1 < 1 –
611 Opening of container 156 256 43 38 5.2 4.1 6.7
612 Segmenting 536 812 121 107 13.9 5.0 7.6
Part sum regarding work preparatory to melting 694.5 1 072 165 145 4.2 7.4
613 Melting (with shielding) 4 1.7 32 22 10.1 0.18 0.08
614a Handling of ingots in moulds 0.1 0.02 1 < 1 0.1 –
614b Handling of ingots after removal from
moulds 22 4.3 4 4 < 0.1 5.5 1.1
615 Transport of ingots to storage 0.1 0.1 <0.1 –
617 Slag handling 1.3 1.3 2 1.8 0.2 0.7 0.7
The comparison of the calculation results indicates that, even with a carefully controlled reflec-tion of reality with respect to geometry and exposure time and with a ‘best judgement’ choice of densities for each operation, the calculation programmes have tended to overestimate the meas-ured values of the total dose by a factor 4 to 6, i.e. about an order of magnitude. An obvious explanation is the fact that the workers are not static, they move about constantly, changing the geometry, thus not taking the assumed doses.
Other practical aspects difficult to reflect exactly in the calculations are: • modelling of the source geometry (during cutting);
• estimation of the density (during cutting);
• estimation of the mean distance to the source (during cutting and melting); • dimensions of the source (during cutting and melting); and
• estimation of shielding thickness (during melting).
The codes assume a source with mass specific distribution of radioactivity (Bq/g), while, in most cases, the actual object has the corresponding total activity concentrated on its surface. This should lead to an underestimation of the dose uptake by the workers involved in segment-ing. However, the conservatism of the above listed factors obviously more than compensates for this, as is shown by the overestimation of the doses in total by the codes.
It seems reasonable to state that the use of ‘enveloping’ scenarios, which necessarily cover a wide range of scenarios in connection with the calculation of clearance levels, would tend to accentuate this tendency of overestimation of dose uptake in most individual cases of recycling by melting. Taking into account the sensitivity of the modelling and the practical aspects listed above, the estimated doses can be, say, one or even more orders of magnitude higher than those actually taken.
It should be pointed out that the Phase 2 melting was performed on a typical reactor system component with only gamma emitters, with Co-60 and Cs-137 as the dominant radionuclides. The dose incurred was almost exclusively by external exposure. This is in agreement with the dose modelling results.
A side aspect of the execution of the Validation Project – specifically the background measure-ments – was the revelation of radioactivity in unexpected places: the paint used for the painting of moulds at Åkers (3-5 Bq/g), the slag binding product (twice background radiation), the stamp mass, insulation and new asphalt at the Studsvik furnace (all at three to four times background). This serves to illustrate the undetected omnipresence of radioactivity in the human habitat at dose rate levels considerably higher (up to 400 % over background) than the levels (ca 1 % over background) at which the currently proposed clearance criteria are based on.
Finally, it is important to note that the degree of overestimation (a factor of 4-6), as recorded in the validation project, is generally regarded as ‘acceptable’ by dose modellers. The results will most probably not lead to any revision or refinement of these codes. For the nuclear decommis-sioner and the other producers of large volumes of only slightly radioactively contaminated material, the clearance levels resulting from such a degree of conservatism can lead to huge amounts of material unnecessarily being condemned to burial as radioactive waste. Considering that most such producers transfer their costs to the public, it is society at large that will foot the bill for this exercise in conservatism.
1 Introduction
For the nuclear industry, the minimisation of the volumes of radioactive waste arising from the refurbishment or decommissioning of nuclear facilities, has been a high priority goal. The recy-cling of very low level radioactive material (or its reuse or disposal) without radiological restric-tions, instead of disposal as radioactive waste, has long been identified as a significant means of achieving this aim. It is from the health and environmental protection perspective imperative that such recycling (or similar) is guided by reasonable and internationally harmonised regula-tions that restrict or minimise radiological consequences. However, the absence of consistent, internationally accepted criteria to regulate the release of recyclable material from regulatory control significantly restricts the utilisation of recycling and reuse as material management prac-tices.
Regulations, interim proposals or recommendations are in existence for the ‘clearance’ of mate-rial from regulatory control, such as those from the US Nuclear Regulatory Commission, the International Atomic Energy Agency, the European Commission and other agencies. All pro-posals are based on predicted scenarios for subsequent utilisation of the released materials. The calculation models used in these scenarios tend to utilise conservative data regarding exposure times and dose uptake as well as other assumptions as a safeguard against uncertainties. This conservatism due to uncertainties is also apparent in similar work performed by the Task Group on Recycling and Reuse of the OECD/NEA Co-operative Programme on Decommissioning and also in the USNRC’s NUREG/CR-5512: Technical Basis for Converting Contamination Levels to Annual Total Effective Dose Equivalent.
Another aspect is common to all these calculation models and codes: none of them has ever been validated by comparison with the actual real life practice of recycling. The Swedish Radia-tion ProtecRadia-tion Institute initiated the ValidaRadia-tion Project in order to validate some of the assump-tions made in these calculation models, and thereby better assess the radiological consequences of recycling on a practical large scale.
2 Overview of the validation project
2.1 Aim of the project
The purpose of the validation project was to register the radiation dose to workers and the public exposed to a certain chain of exposures and to compare the registered doses with the results of computer programme calculations for the same chain of exposures. The following process of management of radioactively contaminated material was chosen to serve as model for compari-son:
• melting of contaminated scrap at a radiologically controlled facility.
• release of ingots from regulatory control with a known activity concentration level, for remelting (with uncontaminated scrap) at a commercial melter.
• use of the resulting material in the manufacture of industrial products.
• the radiological parameters and consequences (i.e. activity concentrations, dose rates, doses, etc.) of each of the above operations were to be measured by suitable and available means. • the measurements were to be compared with the results of calculations by computer
pro-grammes currently used by various organisations. Specifically:
• Two consignments of contaminated scrap, each of about 30 tons, were to be melted at Studs-vik RadWaste, Sweden.
• Ingots resulting from this melting, which have decayed to activity concentrations below re-lease levels established by Swedish authorities, were to be transported to Åkers AB, Sweden. At Åkers AB, the ingots were remelted in the Åkers commercial foundries, along with un-contaminated scrap, for future use in the manufacture of rolls.
• The radiation doses to workers and other parameters were to be measured (1) during the operations at Studsvik, (2) during transport of the released ingots to Åkers, and (3) during the remelting of the ingots (along with other scrap) and manufacture of rolls from the resulting steel.
• The doses were also to be estimated using the RESRAD-RECYCLE and the CERISE pro-grammes.
• A report was to be prepared comparing the measured radiation dose with those predicted by the calculations.
2.2 Participants in the project
The project was a co-operation between the following organisations:
• Swedish Radiation Protection Institute (SSI) initiated the project and is responsible for the central project management and for work not normally within the operational scope of the other partners. SSI constitutes the radiation protection and regulatory authority in Sweden. • Studsvik RadWaste AB (Sweden) has a facility, in a radiologically controlled area, for
in-gots are used as feed material and mixed with uncontaminated scrap for remelting at com-mercial foundries.
• Åkers AB (Sweden) is a major manufacturer of rolls for both hot and cold rolling in the in-ternational steel and non-ferrous metal industries. It is a customer of ingots produced at Studsvik RadWaste AB.
• The United States Department of Energy (USDOE), which has a large number of surplus nuclear facilities, the decommissioning of which will result in a considerable amount of re-cyclable material. The Department is therefore interested in validating calculation pro-grammes used in connection with the clearance of material from regulatory control.
• Argonne National Laboratory (USA) developed the RESRAD-RECYCLE code under the sponsorship of the United States Department of Energy (USDOE). The code assesses the ra-diological doses for workers and the public, resulting from exposure to radionuclides in re-cycled metal with residual radioactivity.
• Institut de Radioprotection et Securité Nucléaire (IRSN) (formerly Institute de Protection et Securité Nucléaire, IPSN), (France) has developed the CERISE code for the dose uptake through different pathways when an individual is exposed to ionising radiation. IRSN is an advisor to the radiation protection authorities in France.
• Belgoprocess (Belgium) is developing a process of milling very low level contaminated con-crete, with a view to recycling it without radiological restrictions. The company is participat-ing as an observer in order to study the possibility of a validation project for the RESRAD-RECYCLE and CERISE codes for concrete.
• Studsvik Stensand is a nuclear and other services company within the Studsvik group. Among the services it provides are health physics supervision as well as radiological meas-urements and analysis.
• Menon Consulting AB, which has been responsible for the project management and co-ordination of the various activities within the project.
The complete list of participants in the project team is given in Attachment 1. More details of the participating organisations, the contractors and their activities and programmes are given in Attachment 2.
2.3 Execution of the project
The actual execution of the project was slightly different from that originally planned. The first phase (melting of contaminated scrap at Studsvik, release of ingots and transport to Åkers) was carried out. The ingots were re-melted along with other (uncontaminated) scrap at Åkers to be used for manufacturing rolls. The doses to workers were measured at Studsvik, Åkers and dur-ing dur-ingot transport.
Dose calculations were made in parallel with these operations using the RESRAD-RECYCLE and CERISE programmes. However, the results of these calculations could not be compared with the corresponding values of doses taken by workers, because all of the doses were below the limit of detection. As there was no comparison possible, the direct results of the calculations on the Åkers operations are not reported. However, certain default parameter code calculations were made, as described below.
Originally, it was not the aim of the project to make a comparison between the two calculations programmes as such. However, as both programmes were used on the same input basis (default parameters), it was possible to make certain comparisons. The results of these comparisons are shown in Attachment 8.
Due to the fact that there were no detectable doses during the execution of the first phase of the project, it was decided that Phase 2 of the project should involve the melting of scrap with sig-nificantly higher levels of activity, instead of being a repetition of Phase 1. Then the occurrence of detectable doses would make a comparison possible between calculated and measured doses. The object chosen for melting during Phase 2 was a stainless steel fuel rack with an estimated activity concentration of over 100 Bq/g, mostly Co-60.
The fuel rack was melted in the Studsvik facility in the middle of January 2001, in the presence of project team including the dose modellers. Their presence and the discussions that were held in connection with the Phase 2 operation helped to model the calculations in accordance with the operations at Studsvik.
3 Phase 1 activities
Activities during Phase 1 consisted of a number of measurements and calculations.
3.1 Measurements
The measurement campaigns consisted of:
• background measurements at Åkers. Measurements at Åkers during ‘normal’ melting of scrap (without Studsvik ingots);
• measurements at Åkers during a melt with addition of Studsvik ingots; • background measurements during transportation between Studsvik and Åkers; • measurements during transport of ingots from Studsvik to Åkers;
• background measurements at Studsvik new melting facility;
• dose rate measurements at Studsvik during a complete cycle of melting of radioactive scrap (receipt/segmenting/storage/melting/storage).
Details of these campaigns are given in Attachment 3. Below are some overview results and comments to the measurement campaigns.
3.1.1 BACKGROUND MEASUREMENTS AT ÅKERS
The radiation measurements were carried out with fifteen area TLD dosimeters, two workers with TLD dosimeters, an FHT 3 M instrument (where 1 cps is approximately equal to 1 nSv/h for Co-60) and a low dose rate measuring instrument with continuous (3 minute intervals) regis-tration (ESM FH 40G-10). Two workers were fitted with air sampling masks.
The background radiation in the plant and the scrap yard was 200–300 cps, with a few excep-tions where higher levels (700–800 cps) were noted. These slightly elevated areas of activity are probably due to the use of slag from earlier times in building material. No measurable doses were registered in the TLDs and no peak values over average background (150–200 nSv/h) were observed adjacent to the furnace during the normal melting activities (i.e., without Studsvik ingots). Fifteen samples were taken for radiochemical measurements. Traces of Ra-226 and Th-232 were found in the slag and dust from furnace ventilation.
During these background measurements, an interesting piece of information was identified: the paint used to coat the moulds for the manufacture of rolls contained 3 500–5 500 Bq/l of Ra-226 (85 %) and Th-232 (15 %). Air sampling revealed no detectable alpha or beta activity. No de-tectable activity levels were observed during the whole body monitoring of the personnel in-volved in these operations.
3.1.2 MEASUREMENT AT ÅKERS WITH ADDITION OF STUDSVIK INGOTS
These measurements were carried out during the melting of 24 tons of steel including 7.5 tons of Studsvik ingots with an average activity of 0.4 Bq/g Co-60. The resulting material had an average content of 0.15 Bq/g Co-60.
The measurement instrumentation and sampling was as described in Section 3.1.1. The melted material was cut into blocks for storage in large boxes for continued manufacturing operations (casting of rolls, machining, surface treatment, etc.) at a later date.
The on line dose rate measurement adjacent to the furnace showed a slightly higher dose rate: 150–250 nSv/h compared to 150–200 nSv/h during ‘normal’ melting without Studsvik ingots. The background in the rest of the plant was the same as in Section 3.1.1, i.e. 200–300 cps. The personal air filter analysis showed the same level of Cs-137 as during normal melting.
3.1.3 MEASUREMENT OF DOSE RATE DURING TRANSPORT OF INGOTS
The dose rate in the cab of the truck was registered with an on line FH 40G-10 instrument, dur-ing the transport of 30 tons of dur-ingot (average activity concentration 0.4 Bq/g). There was no measurable difference in the dose to the driver, with ingots on the 1.25-hour trip from Studsvik to Åkers or empty on the trip back.
3.1.4 BACKGROUND MEASUREMENTS/MEASUREMENTS DURING MELTING AT STUDSVIK
Measurements during melting at Studsvik are shown in detail in Section 4 of Attachment 3. The following is a brief summary of these measurements and their results:
The melting facility was brand new, while the cutting hall had been in service for five years, which explains the 300–350 cps background dose rate in the cutting hall, compared to the 200– 250 cps in the newer areas. There were considerably higher levels in the neighbourhood of the slag binding product (400 cps), stampmass for the furnace (700 cps), new insulation (600 cps) and the new asphalt outside the plant (700 cps).
The on-line dose rate measurements in the door between the cutting and melting halls are shown in Section 4.2 of Attachment 1. About seven tons of scrap was melted in three melts during a total of about 8.5 hours. During the first five hours, the dose rate varied between 0.3 and 0.4 µSv/h. During the next three hours, there were two periods of dose rates up to 0.6 µSv/h. There are no direct explanations for this from the melting process point of view.
The loose contamination on the scrap items was determined by smear tests. All samples except one showed no detectable loose contamination. The exception showed a level of 15.6 kBq/m2 of Co-60. The 140 kg of slag produced had a total activity of 455 kBq (mainly Cs-137).
None of the personnel involved took detectable doses above the limit (i.e. >0.1 mSv) for regis-tration during the operations.
3.2 Calculations
In the phase I calculations, five scenarios representative of the main working posts in the Studs-vik facility were considered. Thirty tons of scrap steel were loaded to the StudsStuds-vik induction furnace in 10 three-ton batches and melted. After the melting, the slag material was poured out, cooled, and handled by a slag worker. The steel melt remaining in the furnace was placed in large containers, cooled, and cast into ingots. The solid ingots were subsequently transported to a commercial facility for further processing. Radionuclides considered in dose calculations were Co-60, Zn-65, Sr-90, Tc-99, Cs-137, Am-241, U-238, Pu-239, and Ac-227.
The exposure parameters and source dimensions used in dose calculations were derived from the RESRAD-RECYCLE default values, which were modified to accommodate the smaller
throughput and smaller furnace capacity. For dose calculations, RESRAD-RECYCLE and CE-RISE used their own dose conversion factors and partitioning factors.
Because of the low level of contamination in the scrap metal, radiation exposures measured in the melting facility could not be differentiated from background level. Therefore, no measure-ment data were available to validate the calculation results obtained with the models. This phase I exercise was essentially a benchmarking calculation, rather than a validation calculation. However, the calculation results of both RESRAD-RECYCLE and CERISE codes confirmed that radiation doses resulting from processing the contaminated scrap steel are low (less than 10-6 Sv).
3.2.1 SCENARIO DESCRIPTION
Dose calculations were conducted for five different activities in the Studsvik facility: (1) sorting and cutting scrap metal after its reception; (2) scrap melting, excluding slag work; (3) slag han-dling; (4) ingot handling, including transfer and storage of ingot products; and (5) ingot trans-port. Five scenarios were developed to evaluate the doses to various workers: (1) scrap proces-sor, who sorted and cut scrap metal into smaller pieces for melting, (2) furnace operator, who loaded the scrap metal to the furnace and operated the furnace, (3) slag worker, who removed the slag material from the top of the melt surface with a special tool and put it in a metallic box for cooling, (4) ingot caster, who poured the melt into moulds, moved the moulds for cooling, and removed the solid ingot from the moulds, and (5) ingot truck driver, who transported the solid ingots to Åkers for further processing.
3.2.2 MASS PARTITIONING FACTORS
RESRAD-RECYCLE and CERISE used the same mass partitioning factors: 90 % for ingot, 1 % for baghouse dust, and 10 % for slag, for dose calculations
3.2.3 RADIONUCLIDE PARTITIONING FACTORS
The radionuclide partitioning factors used in dose calculations were different for the two codes. The values used are listed in Table 1 for comparison.
3.2.4 EXPOSURE PATHWAYS
With one exception, exposure pathways considered for each of the five activities were external radiation, inhalation, and ingestion. For the ingot truck driver, only the external radiation path-way was considered.
To model external radiation exposure, the radiation source was simulated by a full or half cylin-der with dimensions (radius and thickness) representing the source geometry. An external dose conversion factor for each scenario on the basis of the dimensions of the cylindrical source, the exposure distance, and the density of the source material was then calculated. Attenuation of external radiation was considered for the ingot truck driver scenario, resulting from the shield-ing of the truck cab which was assumed to have a density of 7.86 g/cm3 and a thickness of 0.5 cm.
The inhalation pathway considers radiation exposures resulting from inhalation of airborne dust particles. An inhalation rate of 1.2 m3/h and a respirable fraction of 0.1 were assumed in dose calculations. The dust loading factor, which is the concentration of airborne dust particles and represents the air quality in the work place, was assumed to be 1 x 10⁻⁴ g/m3 for the scrap proc-essor and ingot handler scenarios and 3 x 10⁻³ g/m3 for the furnace operator and slag worker scenarios. Concentrations of radionuclides in the airborne dust particles were assumed to be the
same as those in the source material except for the furnace operator scenario. For the scrap processor scenario, the source material was the scrap metal. For the slag worker scenario, the source material was the slag. For the ingot handler scenario, the source material was the ingot. For the furnace operator scenario, dust particles in the air were considered to originate from the melt mixture inside the furnace. However, only volatile components of the mixture would be-come airborne, and a fraction of them would eventually be collected in the baghouse. Therefore, concentrations of radionuclides in the airborne dust particles were assumed to be the same as those collected by the baghouse filter.
For the ingestion pathway, it was assumed that the worker would incidentally ingest the dust particles that deposit on his hands or on the surface of surrounding materials with which his hands came in contact. An ingestion rate of 0.00625 g/h was assumed for the dose calculations. The concentrations of radionuclides in the dust particles were assumed to be the same as those used for the inhalation pathway. In addition to incidental ingestion, RESRAD-RECYCLE con-sidered another exposure route through the inhalation pathway. RESRAD-RECYCLE assumed that dust particles larger than the respirable size would enter the gastrointestinal tract after they were inhaled. Once these particles were absorbed into the blood stream, they would result in internal radiation exposure, and the resulting radiation doses were attributed to the ingestion pathway.
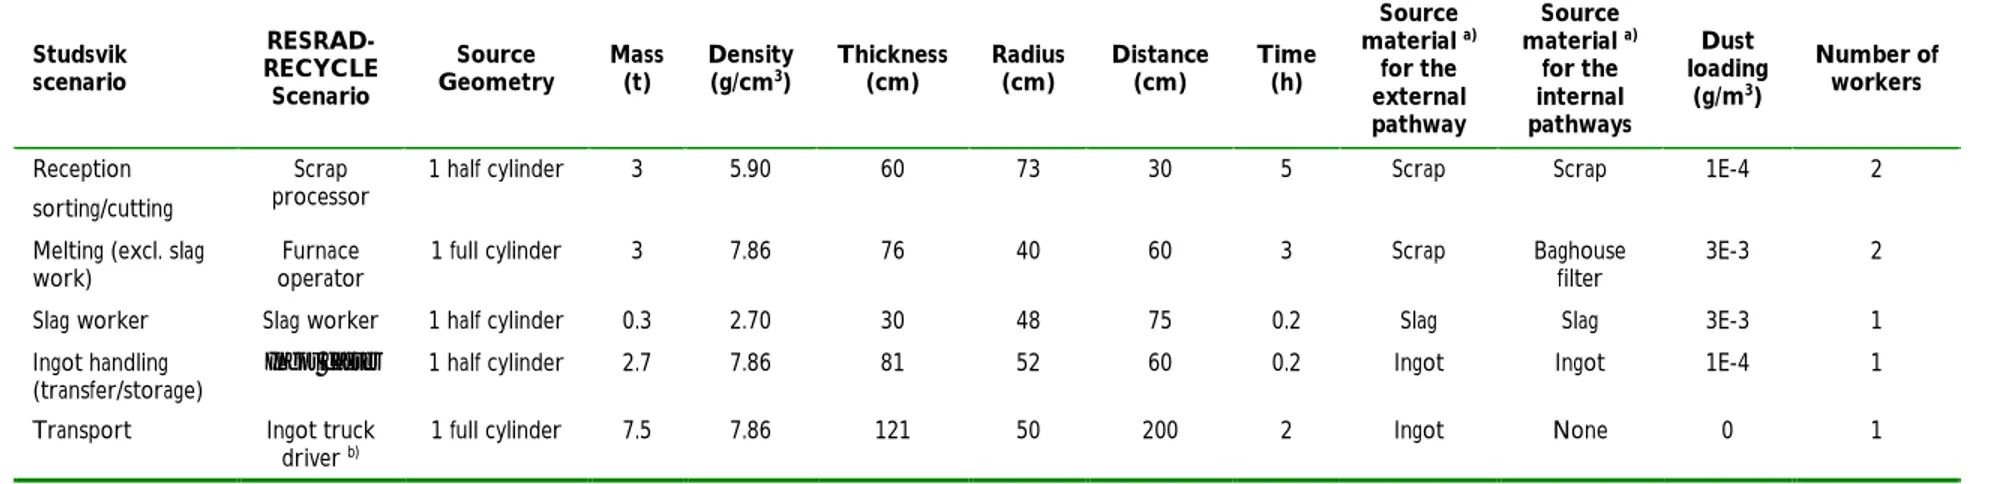
3.2.5 SOURCE GEOMETRIES AND EXPOSURE PARAMETERS
Source geometries and exposure parameters used in dose calculations are listed in Table 2. De-pending on the scenario, the source geometry was represented by either a full or a half cylinder. The corresponding radius and thickness, together with the assumed density, gives the mass of the radiation source.
Table 2 also lists the dust loading factors, which represent the air quality in the work place, the exposure duration, and the number of workers required for each activity.
3.2.6 DOSE CONVERSION FACTORS
The inhalation and ingestion dose conversion factors used in the RESRAD-RECYCLE calcula-tions were obtained from FGR No. 11 (Eckerman et al., 1988). Dose conversion factors used in CERISE calculations were obtained from the EU Basic Safety Standards (Council Directive 96/29/EURATOM). They are listed in Table 3 for comparison.
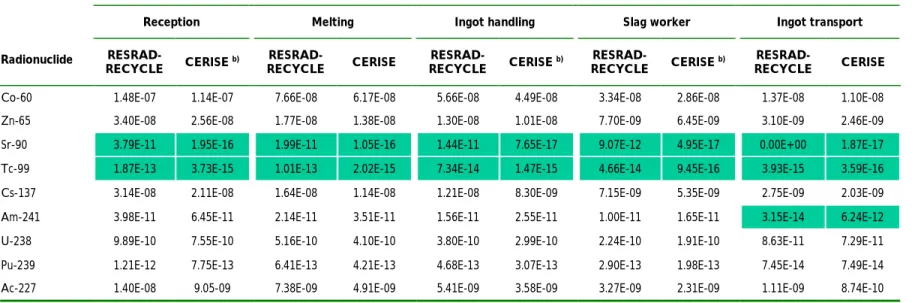
Table 4 compares the external dose conversion factors calculated by the two computer codes. The dose conversion factors were obtained by assuming the same geometry and exposure dis-tances; however, the mathematical models used were different.
3.2.7 RESULTS AND COMPARISONS
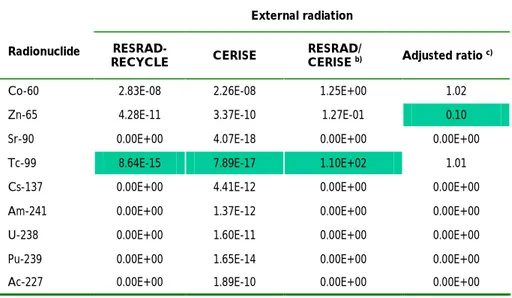
Differences in external dose conversion factors (shown in Table 3) were expected because the external radiation models used in RESRAD-RECYCLE and CERISE are different. In general, the differences are within a factor of 2 except for the two beta emitters, Sr-90 and Tc-99. The RESRAD-RECYCLE results for those radionuclides are much larger than the CERISE results. Differences in the external dose results (shown in Tables 5–9) are caused by differences in the external dose conversion factors and differences in the radionuclide partitioning factors. The ratio of the dose results (RESRAD-RECYCLE/CERISE), if adjusted by the ratio of the dose conversion factor and the ratio of the radionuclide partitioning factor, should be very close to 1. This expectation is, for the most part, verified by the values listed under the column ‘Adjusted
Ratio’ for external radiation in the tables. The only exceptions are the adjusted ratios for Zn-65 for the ingot handling and ingot transport scenarios.
CERISE was able to reproduce RESRAD-RECYCLE results for the inhalation pathway, if RESRAD-RECYCLE’s values for the exposure parameters, the dose conversion factors, and the radionuclide partitioning factors were used in the CERISE calculations. This is verified by the values listed under ‘Adjusted Ratio’ column for the inhalation pathway in Tables 5–9. All the listed values are very close to 1 except for Zn-65 for the ingot handling scenario.
For the ingestion pathway, the major difference between RESRAD-RECYCLE and CERISE results was the inhalation route of exposure considered in RECYCLE. RESRAD-RECYCLE includes exposure resulting from the inhalation of dust particles larger than the res-pirable size. Because of this additional route of exposure, ingestion radiation doses calculated by RESRAD-RECYCLE would be greater than those calculated by CERISE under the same exposure conditions. This situation is observed in the results listed under the ‘Adjusted Ratio’ column for ingestion in Tables 5–9. The adjusted ratio is very close to 1 when the inhalation route of exposure is insignificant compared with the incidental ingestion route of exposure. This condition is shown by the reception worker and ingot handling worker scenarios. The dust load-ing factor specified in dose calculations was 1.0 x 10⁻⁴ g/m3 for these two scenarios. When the inhalation route of exposure becomes more significant, the value of the adjusted ratio becomes larger. For the melting worker and slag worker, the adjusted ratios are close to 1.5 for all the radionuclides considered. The dust loading factor used in dose calculation was 3.0 x 10⁻³ g/m3 for both scenarios. A difference that cannot yet be explained is the small value (about 0.1) of the adjusted ratio for Zn-65 for the ingot handling and ingot transport scenarios.
Table 1. Radionuclide partitioning factors used in Phase I RESRAD-RECYCLE and CERISE
calculations.
Ingot (%) Baghouse (%) Slag (%) Total (%)
Radio-nuclides
RESRAD-RECYCLE CERISE RECYCLE RESRAD- CERISE RECYCLE RESRAD- CERISE RECYCLE RESRAD- CERISE
Ac-227 0 10 1 0.5 99 100 100 110.5 Am-241 0 10 1 0.1 99 100 100 110.1 Co-60 99 100 1 0.5 0 1 100 101.5 Cs-137 0 0.1 97 100 3 10 100 110.1 Pu-239 0 10 1 0.1 99 100 100 110.1 Sr-90 0 10 1 10 99 100 100 120 Tc-99 99 10 1 0.1 0 100 100 110.1 U-238 0 10 1 0.1 99 100 100 110.1 Zn-65 1 1 99 100 0 1 100 102
Table 2. Source geometry and exposure parameters used in Phase I dose calculations. Studsvik scenario RESRAD-RECYCLE Scenario Source
Geometry Mass(t) Density(g/cm3) Thickness(cm) Radius(cm) Distance(cm) Time(h)
Source material a) for the external pathway Source material a) for the internal pathways Dust loading (g/m3) Number of workers Reception sorting/cutting Scrap
processor 1 half cylinder 3 5.90 60 73 30 5 Scrap Scrap 1E-4 2
Melting (excl. slag
work) operator Furnace 1 full cylinder 3 7.86 76 40 60 3 Scrap Baghouse filter 3E-3 2 Slag worker Slag worker 1 half cylinder 0.3 2.70 30 48 75 0.2 Slag Slag 3E-3 1 Ingot handling
(transfer/storage) Ingot caster 1 half cylinder 2.7 7.86 81 52 60 0.2 Ingot Ingot 1E-4 1 Transport Ingot truck
driver b) 1 full cylinder 7.5 7.86 121 50 200 2 Ingot None 0 1
a Radionuclide concentrations in the specified materials were used in the pathway calculations for the various steps of the process. b A steel shielding material with a density of 7.86 g/cm3 and a thickness of 0.5 cm was assumed to be present for external dose calculations.
Table 3. Internal dose conversion factors used in RESRAD-RECYCLE and CERISE calculation.
Inhalation (Sv/Bq) Ingestion (Sv/Bq) Radionuclides RECYCLE RESRAD- CERISE RECYCLE RESRAD- CERISE
Ac-227 4.00E-6 1.21E-6 1.82E-3 5.67E-4
Am-241 9.84E-7 2.00E-7 1.20E-4 4.20E-5
Co-60 7.28E-9 3.40E-9 5.91E-8 1.00E-8
Cs-137 1.35E-8 1.30E-8 8.63E-9 4.60E-9
Pu-239 9.56E-7 2.50E-7 1.16E-4 5.00E-5
Sr-90 4.13E-8 3.07E-8 3.54E-7 3.74E-8
Tc-99 3.95E-10 6.40E-10 2.25E-9 4.00E-9
U-238 7.27E-8 4.89E-8 3.20E-5 2.91E-6
Table 4. External dose conversion factors calculated for the Phase I scenarios a).
External dose conversion factors [(Sv/h)/(Bq/g)]
Reception Melting Ingot handling Slag worker Ingot transport
Radionuclide
RESRAD-RECYCLE CERISE b) RECYCLE RESRAD- CERISE RECYCLE RESRAD- CERISE b) RECYCLE RESRAD- CERISE b) RECYCLE RESRAD- CERISE Co-60 1.48E-07 1.14E-07 7.66E-08 6.17E-08 5.66E-08 4.49E-08 3.34E-08 2.86E-08 1.37E-08 1.10E-08 Zn-65 3.40E-08 2.56E-08 1.77E-08 1.38E-08 1.30E-08 1.01E-08 7.70E-09 6.45E-09 3.10E-09 2.46E-09 Sr-90 3.79E-11 1.95E-16 1.99E-11 1.05E-16 1.44E-11 7.65E-17 9.07E-12 4.95E-17 0.00E+00 1.87E-17 Tc-99 1.87E-13 3.73E-15 1.01E-13 2.02E-15 7.34E-14 1.47E-15 4.66E-14 9.45E-16 3.93E-15 3.59E-16 Cs-137 3.14E-08 2.11E-08 1.64E-08 1.14E-08 1.21E-08 8.30E-09 7.15E-09 5.35E-09 2.75E-09 2.03E-09 Am-241 3.98E-11 6.45E-11 2.14E-11 3.51E-11 1.56E-11 2.55E-11 1.00E-11 1.65E-11 3.15E-14 6.24E-12 U-238 9.89E-10 7.55E-10 5.16E-10 4.10E-10 3.80E-10 2.99E-10 2.24E-10 1.91E-10 8.63E-11 7.29E-11 Pu-239 1.21E-12 7.75E-13 6.41E-13 4.21E-13 4.68E-13 3.07E-13 2.90E-13 1.98E-13 7.45E-14 7.49E-14 Ac-227 1.40E-08 9.05-09 7.38E-09 4.91E-09 5.41E-09 3.58E-09 3.27E-09 2.31E-09 1.11E-09 8.74E-10
a) Shading identifies areas of larger differences between the results of the two models.
Table 5. Phase I dose calculation results for the reception worker scenario a).
External radiation (Sv) Inhalation (Sv) Ingestion (Sv)
Radionuclide
RESRAD-RECYCLE CERISE CERISE RESRAD/b) Adjusted ratio c) RECYCLE RESRAD- CERISE CERISE RESRAD/ b) Adjusted ratio c) RECYCLE RESRAD- CERISE RESRAD/CERISE b) Adjusted ratio c) Co-60 6.92E-07 5.34E-07 1.30E+00 1 3.32E-12 5.62E-13 5.91E+00 1 2.17E-10 9.96E-11 2.18E+00 1.02 Zn-65 1.06E-07 7.96E-08 1.33E+00 1 2.06E-13 5.98E-14 3.44E+00 1 7.72E-11 7.58E-11 1.02E+00 1.02 Sr-90 1.87E-10 9.60E-16 1.95E+05 1 2.10E-11 2.22E-12 9.46E+00 1 1.30E-09 9.48E-10 1.37E+00 1.02 Tc-99 9.34E-13 1.86E-14 5.02E+01 1 1.35E-13 2.40E-13 5.63E-01 1 1.26E-11 2.00E-11 6.30E-01 1.02 Cs-137 1.55E-07 1.04E-07 1.49E+00 1 5.12E-13 2.72E-13 1.88E+00 1 4.24E-10 4.02E-10 1.05E+00 1.02 Am-241 1.99E-10 3.24E-10 6.14E-01 1 7.19E-09 2.52E-09 2.85E+00 1 3.13E-08 6.26E-09 5.00E+00 1.02 U-238 4.94E-09 3.78E-09 1.31E+00 1 1.92E-09 1.74E-10 1.10E+01 1 2.31E-09 1.53E-09 1.51E+00 1.02 Pu-239 6.03E-12 3.88E-12 1.55E+00 1 6.96E-09 3.00E-09 2.32E+00 1 3.04E-08 7.82E-09 3.89E+00 1.02 Ac-227 6.87E-08 4.46E-08 1.54E+00 1 1.07E-07 3.36E-08 3.18E+00 0.99 1.25E-07 3.72E-08 3.36E+00 1.02
a) Shading identifies areas of larger differences between the results of the two models. b) RESRAD/CERISE: Ratio of RESRAD-RECYCLE results to CERISE results.
c) Adjusted Ratio: The calculated ratio of RESRAD-RECYCLE results to CERISE results if the same dose conversion factor and radionuclide partitioning factor were used in dose calculation.
Table 6. Phase I dose calculation results for the melting worker scenario a).
External radiation (Sv) Inhalation (Sv) Ingestion (Sv)
Radionuclide
RESRAD-RECYCLE CERISE RESRAD/CERISE b) Adjusted ratio c) RECYCLE RESRAD- CERISE RESRAD/CERISE b) Adjusted ratio c) RECYCLE RESRAD- CERISE CERISE RESRAD/b) Adjusted ratio c) Co-60 2.15E-07 1.73E-07 1.24E+00 1 5.98E-11 5.06E-12 1.18E+01 1 1.94E-10 2.98E-11 6.51E+00 1.52 Zn-65 3.30E-08 2.58E-08 1.28E+00 1 3.76E-10 1.08E-10 3.48E+00 1.02 6.84E-09 4.54E-09 1.51E+00 1.52 Sr-90 5.89E-11 3.12E-16 1.89E+05 1 3.78E-10 3.98E-10 9.50E-01 1 1.16E-09 5.68E-09 2.04E-01 1.52 Tc-99 3.02E-13 6.06E-15 4.98E+01 1 2.43E-12 4.32E-13 5.63E+00 1 1.12E-11 1.20E-12 9.33E+00 1.51 Cs-137 4.87E-08 3.38E-08 1.44E+00 1 8.94E-10 4.92E-10 1.82E+00 1 3.69E-08 2.40E-08 1.54E+00 1.53 Am-241 6.43E-11 1.05E-10 6.12E-01 1 1.29E-07 4.54E-09 2.84E+01 0.99 2.80E-08 3.74E-10 7.49E+01 1.52 U-238 1.55E-09 1.23E-09 1.26E+00 1 3.46E-08 3.14E-10 1.10E+02 1 2.07E-09 9.16E-11 2.26E+01 1.52 Pu-239 1.92E-12 1.26E-12 1.52E+00 1 1.25E-07 5.40E-09 2.31E+01 1 2.72E-08 4.68E-10 5.81E+01 1.52 Ac-227 2.18E-08 1.45E-08 1.50E+00 1 1.93E-06 3.02E-07 6.39E+00 1 1.12E-07 1.12E-08 1.00E+01 1.51
a) Shading identifies areas of larger differences between the results of the two models. b) RESRAD/CERISE: Ratio of RESRAD-RECYCLE results to CERISE results.
c) Adjusted Ratio: The calculated ratio of RESRAD-RECYCLE results to CERISE results if the same dose conversion factor and radionuclide partitioning factor were used in dose calculation.
Table 7. Phase I dose calculation results for the slag worker scenario a).
External radiation (Sv) Inhalation (Sv) Ingestion (Sv)
Radionuclide
RESRAD-RECYCLE CERISE RESRAD/CERISE b) Adjusted ratio c) RECYCLE RESRAD- CERISE CERISE RESRAD/ b) Adjusted ratio c) RECYCLE RESRAD- CERISE RESRAD/CERISE b) Adjusted ratio c) Co-60 0.00E+00 5.37E-10 0.00E+00 0.00E+00 0.00E+00 6.78E-14 0.00E+00 0.00E+00 0.00E+00 3.99E-13 0.00E+00 0.00E+00 Zn-65 0.00E+00 8.04E-10 0.00E+00 0.00E+00 0.00E+00 7.20E-14 0.00E+00 0.00E+00 0.00E+00 3.03E-12 0.00E+00 0.00E+00 Sr-90 1.77E-11 9.81E-17 1.80E+05 0.99 2.49E-10 2.67E-11 9.33E+00 1 7.67E-10 3.81E-10 2.01E+00 1.51 Tc-99 0.00E+00 1.91E-15 0.00E+00 0.00E+00 0.00E+00 2.90E-12 0.00E+00 0.00E+00 0.00E+00 8.01E-12 0.00E+00 0.00E+00 Cs-137 4.24E-10 1.06E-09 4.00E-01 1 1.84E-13 3.30E-13 5.58E-01 0.99 7.60E-12 1.61E-11 4.72E-01 1.52 Am-241 1.98E-11 3.30E-11 6.00E-01 1 8.55E-08 3.03E-08 2.82E+00 1 1.85E-08 2.51E-09 7.37E+00 1.51 U-238 4.44E-10 3.84E-10 1.16E+00 1 2.28E-08 2.10E-09 1.09E+01 1 1.37E-09 6.12E-10 2.24E+00 1.52 Pu-239 5.74E-13 3.96E-13 1.45E+00 1 8.27E-08 3.63E-08 2.28E+00 0.99 1.80E-08 3.12E-09 5.77E+00 1.52 Ac-227 6.38E-09 4.56E-09 1.40E+00 1 1.28E-06 4.05E-07 3.16E+00 1 7.40E-08 1.49E-08 4.97E+00 1.52
a) Shading identifies areas of larger differences between the results of the two models. b) RESRAD/CERISE: Ratio of RESRAD-RECYCLE results to CERISE results.
c) Adjusted Ratio: The calculated ratio of RESRAD-RECYCLE results to CERISE results if the same dose conversion factor and radionuclide partitioning factor were used in dose calculation.