2014:59
Technical Note
Relation between earthquake magnitude,
fracture length and fracture shear
displa-cement in the KBS-3 repository at Forsmark
Main Review Phase
Authors: Jeoung Seok Yoon
Ove Stephansson Ki-Bok Min
SSM perspektiv
Bakgrund
Strålsäkerhetsmyndigheten (SSM) granskar Svensk Kärnbränslehantering
AB:s (SKB) ansökningar enligt lagen (1984:3) om kärnteknisk verksamhet
om uppförande, innehav och drift av ett slutförvar för använt kärnbränsle
och även inkapslingsanläggning. Som en del i granskningen ger SSM
kon-sulter uppdrag för att inhämta information och göra expertbedömningar i
avgränsade frågor. I SSM:s Technical Note-serie rapporteras resultaten från
dessa konsultuppdrag.
Projektets syfte
Det övergripande syftet med projektet är att ta fram synpunkter på SKB:s
säkerhetsanalys SR-Site för den långsiktiga strålsäkerheten för det
plane-rade slutförvaret i Forsmark. Uppdraget omfattar verifiering av de
sam-band som SKB har tagit fram för att koppla ihop jordskalvmagnituden,
spricklängder samt sprickornas skjuvrörelser i KBS-3-förvaret i Forsmark.
Oberoende numerisk modellering har genomförts för att verifiera SKB:s
resultat men även för att undersöka fall som författarna har bedömt vara
signifikanta för granskningen av SR-Site.
Författarnas sammanfattning
Denna studie berör ett av scenarierna som kan försämra den fysiska
inte-griteten av kapslarna i kärnbränsleförvaret i Forsmark. Två källor till skada
är: i) termiska skalv pga. värmeutvecklingen från kapslarna som innehåller
det använda kärnbränslet, och ii) jordskalv som äger rum vid närliggande
deformationszoner och deras möjlighet att initiera sprickbildning hos
berget i slutförvaret.
Villkoret som är relevant för förvarets säkerhet gäller skjuvrörelsen på
sprickor i berg som induceras antingen av den termiska belastningen, ett
närliggande jordskalv, eller av en kombination av dessa två betingelser. I
SKB:s säkerhetsanalys SR-Site, antas en skjuvrörelse på 50 mm på sprickor
i berg som träffar en kapselposition vara den övre gränsen för kapselbrott.
Modellering av termisk belastning samt jordskalv har i denna studie
genomförts med PFC2D, en 2-D diskret elementkod. PFC2D-modellerna
innefattar ett stort antal explicita deformationszoner, sekundära sprickor
samt kapselpositioner, som också fungerar som punktvärmekällor.
Hori-sontella samt vertikala tvärsnittsmodeller av berget i Forsmark har använts
i denna studie.
Simulering av jordskalv som sker på en viss deformationszon görs med en
plötslig frigörelse av töjningsenergi som byggts upp under rådande
berg-spänningar och som lagrats i mindre sprickor som bildar
deformationszo-nen i modellen.
Deformationszonerna som finns i modellen har en längd uppmätt vid
ytan på mer än 1 km och motsvarar de zoner som har observerats och
dokumenterats med hög tilltro av SKB i Forsmark. Nätverk av sekundära
sprickor (DFN) med längder mellan 100 och 600 m genereras från
sprick-fördelningar som SKB har tagit fram baserat på sprickkarteringar på plats.
Till skillnad mot SKB:s modelleringsstudier har sprickor av olika längd och
riktning samt skärningar mellan sprickor explicit modellerats här.
Simuleringarna i denna studie har gett följande resultat: 1) sambanden
mellan skjuvrörelser i sekundära sprickor, deras längd och avstånd från
skalvets hypocentrum, och 2) seismiska samt icke-seismiska magnituder
för termiska, tektoniska, glaciala samt termo-tektoniska inducerade skalv.
Från modelleringen av den värmeinducerade belastningen från det
utbrända kärnbränslet visar resultaten att bergmassan expanderar och
or-sakar skjuvrörelser hos bergsprickor i själva slutförvaret och hos
deforma-tionszoner i och omkring slutförvaret. Skjuvningen hos deformadeforma-tionszoner
samt sprickor inom varje deponeringsområde i slutförvaret är uppemot
12 mm och minskar i ytterområdena av slutförvaret. För båda fallen där
alla bränslekapslar deponeras samtidigt respektive i sekvens, visar
resul-taten att efter 50 års deponering kommer ingen spricka i slutförvaret att
överskrida kriteriet för kapselbrott på 50 mm. Den största magnituden
hos jordskalv till följd av den värmeinducerade seismiciteten är M=2,3
och magnituden och frekvensen hos skalven ökar med antalet deponerade
kapslar i varje panel i slutförvaret.
Från modelleringen av jordskalv hos horisontella tvärsnittsmodeller genom
slutförvaret under nu gällande spänningstillstånd i bergmassan på
förvars-djup, visar resultaten att ett jordskalv med magnitud M~5 hos
deformations-zonen ZFMWNW0809A kan generera ett medelstort inducerat skalv hos
deformationszonen ZFMNW1200 som befinner sig på relativt stort avstånd
från zonen ZFMWNW0809A. Simulering av ett jordskalv i
deformationszo-nen ZFMWNW2225 resulterar i ett skalv på M~4 samt att ett mindre antal
sekundära sprickor i slutförvaret kan komma att skjuvas mera än 50 mm.
Singöförkastningen ZFMWNW0001 representeras i modellerna av en
förkor-tad deformationszon. Aktiveringen av ett jordskalv i zonen simuleras genom
att tvinga skjuvkrafterna längs zonen till en storlek som resulterar i ett skalv
med magnituden M~6 eller högre, vilket leder till skjuvning hos bergsprickor
i slutförvaret som överstiger gränsen för kapselbrott.
Modellering av jordskalv har också utförts för ett antal
deformationszo-ner under glaciala spänningstillstånd hos berget i Forsmark. Resultaten
visar något högre skalvmagnituder än för fallet med modellering med
dagens antagna spänningstillstånd hos bergmassan. Simulering av
jord-skalv för ytterligare två av deformationszonerna, ZFMWNW0001 samt
ZFMWNW2225, resulterar i en skjuvrörelse hos sprickor i slutförvaret som
överstiger gränsvärdet på 50 mm.
Jordskalv har också simulerats i vertikala tvärsnittsmodeller genom
slutför-varet där en grupp av flacka deformationszoner (ZFMA2, ZFMA3, ZFMA8
och F1) aktiverades vid samma tidpunkt. Resultaten visar att gränsvärdet
på 50 mm överskrids hos sprickor i slutförvaret under de båda
antagande-na att dagens tektoniska spänningar verkar i berget och att området täcks
av en inlandsis i samband med glaciationsmaximum.
Resultaten från modellering av slutförvarets respons på en samtidig termal
belastning och jordskalv visar att skjuvning av bergsprickor och
deforma-tionszoner som inducerats genom termisk belastning förstärks med en faktor
3 genom inverkan av jordskalvet. Skalvmagnituden under termisk belastning
ökar också för de seismiska skalven samt för de inducerade skalv jämfört med
fallet utan termisk belastning. Simuleringsresultaten visar också att jordskalv
som initieras på deformationszonerna ZFMWNW0809A och ZFMWNW2225
cirka 50 år efter att en sekventiell deponering startat och temperaturen i
närområdet nått sitt maximum, leder till skjuvning av bergsprickor som
över-skrider gränsvärdet på 50 mm för kapselbrott.
Av resultaten från utförda modelleringar i denna studie drar författarna
slutsatsen att risken för att kapselbrott kan ske, utöver vid stora glaciala
skalv, för det fall att ett större jordskalv inträffar i någon av de
omkringlig-gande stora deformationszonerna vid tiden för drift av slutförvaret och
under den termiska fasen.
Projektinformation
Kontaktperson på SSM: Flavio Lanaro
Diarienummer ramavtal: SSM2011-3631
Diarienummer avrop: SSM2013-3839
Aktivitetsnummer: 3030012-4077
SSM perspective
Background
The Swedish Radiation Safety Authority (SSM) reviews the Swedish
Nu-clear Fuel Company’s (SKB) applications under the Act on NuNu-clear
Acti-vities (SFS 1984:3) for the construction and operation of a repository for
spent nuclear fuel and for an encapsulation facility. As part of the review,
SSM commissions consultants to carry out work in order to obtain
infor-mation and provide expert opinion on specific issues. The results from
the consultants’ tasks are reported in SSM’s Technical Note series.
Objectives of the project
The general objective of the project is to provide review comments on
SKB’s post-closure safety analysis, SR-Site, for the proposed repository at
Forsmark. In particular, this assignment concerns the verification of the
relations obtained by SKB for linking earthquake magnitude, length of
the fractures, shear displacement on the fractures in the KBS-3
repo-sitory at Forsmark. Independent numerical earthquake modelling is
carried out for verifying some of SKB’s results but also for covering cases
the Authors judge are necessary for the assessment of SR-Site.
Summary by the Authors
This study addresses one of several scenarios that could impair the
physical integrity of the repository of spent nuclear fuel at the Forsmark
site. Two sources of threat are: i) events due to thermal loading on the
rock mass by the heat from canisters with spent nuclear fuel, and ii)
seismic events, i.e. earthquakes, at the nearby deformation zones and
zones intersecting the repository area.
The effect relevant to the repository safety is the shear displacement on
rock fractures induced either by the effect of thermal loading, or by an
earthquake at a nearby deformation zone, or by the combination of the
two. In SKB’s safety assessment SR-Site, a shear displacement of 50 mm
of a target fracture that crosses a canister position in the repository area
is regarded as the upper limit of canister failure.
Thermal loading and earthquake simulations in this study are
con-ducted using PFC2D, a 2-D discrete element code. The PFC2D models
include a large number of explicitly modelled deformation zones, target
fractures and canister positions, which acts as point-heat sources.
Hori-zontal and vertical cross-sections of the site are considered in this study.
Earthquake at a specific deformation zone is simulated by a sudden
release of the strain energy that was accumulated under the given in situ
stress condition and stored in smaller fractures building up the
defor-mation zones.
The deformation zones included in the model have a surface length
grea-ter than 1 km and were observed and documented with high confidence
of existence at the Forsmark site by SKB. Networks of target fractures
(DFN) with length between 100 m and 600 m are generated from
distri-butions built by SKB based on observations at the site. Unlike SKB’s
stu-dies of earthquakes, the target fractures in the models in this study have
various lengths and orientations, and can intersect one another.
The main outputs from the simulations in this study are: 1) shear
displa-cement of the target fractures with respect to the fracture length, and 2)
seismic and co-seismic magnitudes of the thermally, earthquake,
glacial-earthquake and thermal-and-glacial-earthquake induced events.
From the modelling of heat induced repository responses, it is observed
that the repository rock mass expands due to the heat and induces shear
displacement of the target fractures and the nearby deformation zones.
Shear displacements are up to 12 mm for those fractures located within
the footprint of the heated panels, and relatively smaller at the outskirts
of the heated panels. In both cases where the canisters are disposed
si-multaneously and sequentially, the results show that the fractures do not
slip more than the canister damage threshold within the 50 years after
start of deposition. The heat induced seismicity tends to increase with
the number of canisters disposed in the panels, and the largest
magni-tude is M=2.3.
From the modelling of the repository responses to seismic events under
present-day stress condition at Forsmark, it is found that an earthquake
at zone ZFMWNW0809A might have a magnitude of M~5 and can
trig-ger moderately large magnitude co-seismic events at zone ZFMNW1200,
which locates at a far distance from zone ZFMWNW0809A. An
earth-quake simulation is done to the zone ZFMWNW2225 that intersects the
repository panels. An active earthquake on this zone results in M~4 and
shows that some of the target fractures can shear more than 50 mm. The
major Singö fault zone ZFMWNW0001 is represented by a truncated
trace in the model. Modelling of an earthquake is simulated by forcing
the shear force along its trace and yields to a magnitude M~6 or larger,
and shows that some of the target fractures can shear more than 50 mm.
Earthquake modelling is done at a few selected deformation zones
under the glacial stress conditions (forebulge and maximum thickness
of ice cover for the horizontal model, and maximum ice cover and ice
retreat for the vertical model). The results show that the magnitudes
tend to be higher than those for the present-day stress condition, which
is attributed to more anisotropic and higher stresses caused by the
ice cover. Modelling of earthquakes at two zones, ZFMWNW0001 and
ZFMWNW2225 with M~6 and M~4, respectively, pose risks that some of
the target fractures can shear more than 50 mm.
Earthquake modelling is done with the vertical section models where
a group of closely spaced and gently dipping zones (ZFMA2, ZFMA3,
ZFMA8 and F1) are activated at the same time. The resulting
magnitu-des are above M=5.5 and results show that some of the target fractures
can shear more than 50 mm under the stress conditions at present day
and at the time of maximum ice cover.
From the modelling of thermal-and-earthquake induced repository
re-sponses, it is found that the shear displacements of target fractures and
deformation zones induced by the heating are powered by the effect of
the earthquake up to a factor 3. Also the intensity of the seismic events
that strikes during heating is magnified by the heating. Both modelling
cases where an earthquake takes place at zone ZFMWNW0809A and
ZFMWNW2225 at 50 years after the start of sequential deposition show
that some of the target fractures can give shear displacements larger
than 50 mm.
From the results of the modelling cases conducted in this study, the
Aut-hors draw the conclusion that there might be a risk for canister damage,
other than for the conditions with glacially induced earthquakes, also
for the conditions when an earthquake at a nearby deformation zone
hits the repository during the operational and thermal phases.
Project information
2014:59
Authors:Relation between earthquake magnitude,
fracture length and fracture shear
displa-cement in the KBS-3 repository at Forsmark
Main Review Phase
Jeoung Seok Yoon1), Ove Stephansson1) and Ki-Bok Min2)
1) Stephansson Rock Consultant, Berlin, Germany 2)Seoul National University, Seoul, South Korea
This report was commissioned by the Swedish Radiation Safety Authority
(SSM). The conclusions and viewpoints presented in the report are those
of the author(s) and do not necessarily coincide with those of SSM.
Contents
1. Introduction ... 3
1.1. Background ... 3
1.2. Assigned topics ... 4
2. Review of the studies conducted by SKB ... 7
2.1. SKB’s analysis of thermal induced target fracture responses ... 7
2.2. SKB’s analysis of earthquake induced responses of target fracture ... 7
2.3. SKB’s analysis of post-glacial earthquake induced responses of target fracture ... 8
2.4. The Consultants’ assessment ... 8
3. The Consultants’ independent modelling method ... 11
3.1. Bonded Particle Model and Particle Flow Code ... 11
3.2. Fracture propagation modelling ... 12
3.3. Synthetic rock mass modelling ... 13
3.4. Coupled thermo-mechanical modelling ... 16
3.5. Seismicity modelling ... 18
4. Forsmark repository models ... 21
4.1. Generation of the horizontal section model of the Forsmark site 21 4.1.1. Deformation zones ... 21
4.1.2. Discrete Fracture Network (DFN) ... 25
4.2. Generation of the vertical section model of the Forsmark site .... 28
4.3. Model parameters ... 30
4.4. Calculation of shear displacements of fractures ... 31
4.5. In situ stress field and its glacial evolution ... 32
4.6. Heat loading ... 38
4.7. Stability of the deformation zones ... 41
4.8. Earthquake simulations ... 43
4.9. Modelling cases ... 47
4.10. Descriptions of plots of results ... 49
5. Modelling of thermally induced seismicity and target fracture responses ... 53
5.1. Simultaneous heating ... 53
5.2. Sequential heating ... 56
5.3. The Consultants’ assessment ... 59
6. Modelling of target fracture responses to earthquakes on deformation zones ... 61
6.1. Earthquake at selected deformation zones –present-day “most likely” reverse stress field – Horizontal section model ... 61
6.1.1. Earthquake at zone ZFMWNW0809A ... 61
6.1.2. Earthquake at zone ZFMWNW0001, powered shear force 63 6.1.3. Earthquake at zone ZFMWNW2225... 66
6.2. Earthquake at selected deformation zones – glacial induced stress field at the time of forebulge – Horizontal section model ... 69
6.2.1. Earthquake at zone ZFMWNW0809A ... 69
6.2.2. Earthquake at zone ZFMWNW0001, powered shear force 70 6.2.3. Earthquake at zone ZFMWNW2225... 72
6.2.4. Earthquake at zone ZFMNW1200 ... 74
6.3. Earthquake at selected deformation zones – glacial induced stress field at the time of maximum ice cover – Horizontal section model ... 77
6.3.2. Earthquake at zone ZFMWNW2225... 78
6.3.3. Earthquake at zone ZFMNW1200 ... 79
6.4. Earthquake at selected deformation zones – present-day “most likely” reverse stress field – Vertical section model ... 81
6.4.1. Earthquake at zone ZFMA2 ... 81
6.4.2. Earthquake at zones ZFMA2-A3-A8-F1 ... 81
6.4.3. Earthquake at zones ZFMA2-A3-A8-F1, powered shear force ... 81
6.5. Earthquake at selected deformation zones – glacial induced stress field at time of maximum ice cover – Vertical section model . 84 6.5.1. Earthquake at zone ZFMA2 ... 84
6.5.2. Earthquake at zones ZFMA2-A3-A8-F1 ... 84
6.5.3. Earthquake at zones ZFMA2-A3-A8-F1, powered shear force ... 85
6.6. Earthquake at selected deformation zones – glacial induced stress field at time of ice retreat – Vertical section model ... 86
6.6.1. Earthquake at zone ZFMA2 ... 86
6.6.2. Earthquake at zones ZFMA2-A3-A8-F1 ... 86
6.6.3. Earthquake at zones ZFMA2-A3-A8-F1, powered shear force ... 87
6.7. The Consultants’ assessment ... 88
7. Modelling of target fracture responses to simultaneous earthquake and heating of the repository ... 89
7.1. Earthquake at ZFMWNW0809A after 50 years of sequential heating – present-day “most likely” stress field – horizontal section model ... 89
7.2. Earthquake at ZFMWNW2225 after 50 years of sequential heating – present-day “most likely” stress field – horizontal section model ... 92
7.3. The Consultants’ assessment ... 95
8. Discussion ... 97
9. The Consultants’ overall assessment and conclusions ... 107
10. Recommendations ... 109
11. References ... 111
APPENDIX 1 Coverage of SKB reports ... 115
APPENDIX 2 Quality checks on DFN deliveries for PFC simulations with horizontal and vertical section models ... 117
Horizontal sections... 117
Vertical sections ... 136
APPENDIX 3 Result of all PFC modelling cases ... 143
Models in Section 5.1 ... 143 Models in Section 5.2 ... 147 Models in Section 6.1 ... 151 Models in Section 6.2 ... 163 Models in Section 6.3 ... 179 Models in Section 6.4 ... 191 Models in Section 6.5 ... 199 Models in Section 6.6 ... 205 Models in Section 7.1 ... 215 Models in Section 7.2 ... 218
1. Introduction
This assignment is a part of Main Review Phase conducted by the Swedish Radiation Safety Authority (SSM) on the SR-Site safety assessment of the final disposal of spent nuclear fuel at Forsmark in the application for construction license submitted by the Swedish Nuclear Fuel and Waste Management Company (SKB). This assignment concerns an assessment of the relation between earthquake magnitude, length of a rock fracture and its response to shear displacement. SKB’s account assumes a certain relation between the earthquake magnitude and the amount of shear displacement that rock fractures (i.e. target fractures) can experience at a distance from the hypocentre. This means that the amount of shear displacement would diminish for target fractures away from the hypocenter. Due to uncertainties on the deformation zone model, on the frequency and
magnitude of possible earthquakes, on the occurrence and position of target fractures and their reciprocal interaction during an earthquake at Forsmark, it can be assumed that the shear displacements that could possibly occur on a certain fracture must be represented by a frequency distribution of displacements. This is done by SKB by assuming a constant frequency distribution between a zero displacement and a maximum displacement value (Fälth et al. 2010).
1.1. Background
SKB has conducted numerical modelling studies where earthquakes are simulated in a generic way with the distinct element code 3DEC, and investigated responses of the target fractures (Fälth et al., 2010). They concluded that the 3DEC models produce peak ground accelerations and velocities that are in accordance with those from records of real earthquakes. They also argued that the models used and the modelling technique adopted (mesh, boundary conditions, treatment of rupture initiation and propagation) are adequate for the intended license application. However, SKB’s modelling has some idealizations and the method used seems to have some major limitations. The Authors consider that SKB’s results may be limited in scope and the method might not be appropriate for solving this type of problems, in particular when dealing with geological structures with high complexity such as in Forsmark. Therefore, the Authors list below a few major limitations of the method and modelling approach that SKB has adopted:
Only one primary fault is considered in each model and is represented by a
planar feature inside a large rock block, which is assumed to be a linear elastic, isotropic, homogeneous and continuous medium.
The vertical stress corresponds to the rock overburden in all models while
the horizontal stresses are calibrated to produce the intended seismic moment, given the prescribed rupture area and the properties of the surrounding rock mass.
Attenuation of seismic wave is not accounted for.
All modelled target fractures are planar, have uniform properties over their
entire surface area and have uniform in size, i.e. a radius of 150 m.
All modelled target fractures are isolated and interactions through
intersections are not taken into account, which may have drastic impacts on the shear displacements.
Normal stiffness and shear stiffness of the target fractures are generic.
Dilation is not assumed in the modelled target fractures.
The deformation zone friction angle and cohesion are fictitious, with no
coupling to real site data.
From the issues mentioned above, the Authors argue that the modelling conducted by SKB, although it is in 3D, bears some idealization of the material properties and geometries of key geological structures.
Therefore, in the modelling study in this assignment, the Authors try to overcome these limitations by making the model resemble the geological structures at Forsmark site as close as possible.
1.2. Assigned topics
This study produces independent verification analyses to SKB’s presentations and tackles the technical issues that were not covered in sufficient detail by SKB for the construction licence application of the final repository for spent nuclear fuel at Forsmark. The following tasks are performed in this study:
Task A: Review of the earthquake modelling studies conducted by SKB,
Task B: Presentation of the modelling method with Particle Flow Code
(PFC) used in this study,
Task C: Generation of a discrete element model for Forsmark with
deformation zones and discrete fracture networks,
Task D: Modelling of a generic earthquake with PFC,
Task E: Analysis of target fracture and of the repository responses due to
heating from the spent nuclear fuel,
Task F: Analysis of target fracture and of the repository responses due to
tectonic and post-glacial earthquake at nearby major deformation zones,
Task G: Analysis of target fracture and of the repository responses due to a
combination of heating from the spent nuclear fuel and earthquake. Task A undertakes a literature review of the existing knowledge about thermal induced and earthquake induced shear behaviour of fractures in a repository conducted by SKB. This is covered in Chapter 2.
Task B presents a literature review of the PFC modelling method used in this study. The main focus is to demonstrate that PFC as a modelling method is a suitable choice for this assignment. This is covered in Chapter 3.
Task C focuses on describing the procedure for model generation, where SKB’s local model area of Forsmark site is transformed into horizontal and vertical section models based on the discrete element method with realistic representation of deformation zones and discrete fracture network. This is covered in Chapter 4, Sec. 4.1 through 4.7.
Task D focuses on describing the procedure for simulation of a generic earthquake at a major deformation zone in the discrete element model. This is covered in Chapter 4, Sec. 4.8 through 4.10.
Task E undertakes analysis of target fracture responses due to thermal loading induced by the heat from the spent nuclear fuel. This is covered in Chapter 5. Task F undertakes analysis of target fracture responses due to seismic loading induced by tectonic and post-glacial earthquakes at nearby major deformation zones. This is covered in Chapter 6.
Task G undertakes analysis of target fracture responses due to the combination of thermal and seismic loading induced by tectonic earthquakes at major deformation zones. This is covered in Chapter 7.
Appendix 1 lists the main SKB references reviewed in this report.
Appendix 2 reports the quality checks for the DFN models used in this report. As quite a number of modelling cases are investigated, there are many similar plots. Instead of presenting all figures in the body text, only the key plots are reported and discussed here. All the rest of the result plots are presented in Appendix 3.
2. Review of the studies conducted by
SKB
2.1. SKB’s analysis of thermal induced target fracture
responses
Modelling of post-glacial earthquake by Fälth et al. (2010) was done without consideration of the actual stress situation or the actual geometry of the deformation zones at Forsmark. Such a schematic calculation approach does not work for analysis of thermally induced earthquake since the exact position of repository with respect to the geological features is crucial for the thermo-mechanical loading and potential earthquakes on deformation zone.
Therefore, a recent modelling study by Fälth and Hökmark (2013) considers specifically designed, specific thermal loading models with corresponding site-specific post-glacial loading conditions. This investigates heat induced shear displacement of target fractures. The main conclusion is that the effects of thermally induced earthquakes are sufficiently smaller than those due to post-glacial fault movements when the ice retreats during future glaciations.
Following are the major conclusions from SKB’s study.
The average displacement due to an earthquake on the thermally affected
deformation zone ZFMA2 is about 60% of the average displacement due to post-glacial displacement for an earthquake of the same magnitude.
The thermal disturbance of the stability of the deformation zone ZFMA2 is
negligible.
Due to the conservative assumption about the strength of zone ZFMA2, the
magnitude of the earthquake assumed for the zone ZFMA2 is M5.5 at the highest.
The difference between the maximum induced shear displacement of target
fractures due to an earthquake that occurs after 100 or 1000 years of heating is negligible.
The maximum secondary shear displacement of the heated target fractures
at the foot wall side of the zone is 80% of the post-glacial case. A target fracture with radius of 150 m at 200 m distance from zone ZFMA2 gives a induced shear displacement during heating of 19 mm, which is around 40% of the maximum displacement allowed of 50 mm.
SKB claims that there is little risk of canister damage due to fracture shear
caused by an earthquake occurring during the thermal phase, and the large displacement calculated for zone ZFMA2 is not likely.
2.2. SKB’s analysis of earthquake induced responses
of target fracture
Given the bounding assumptions of planar fracture geometry, uniform properties and elastic continuum medium discussed briefly in Sec. 1.1, Fälth et al. (2010) have
made the following observations regarding the response of the target fractures to an earthquake:
There is a strong correlation between the amount of induced target fracture
shear displacement and the distance from the fault.
The shear displacement decreases with distance in approximately the same
way regardless of the slip mechanism, i.e. whether fractures slip because of a temporary loss of strength or because of stress redistribution.
The shear displacement of target fracture scales linearly with the size of the
fracture. This should be expected for a fracture in an infinite elastic medium with one embedded fracture subjected to quasi-static loading, but is assumed to hold true also for the type of dynamic impact generated by slipping earthquake faults.
2.3. SKB’s analysis of post-glacial earthquake induced
responses of target fracture
Modelling of post-glacial earthquakes by Fälth et al. (2010) was done without consideration of actual stress situation or the actual geometry of deformation zones at Forsmark. Recent modelling studies by Fälth and Hökmark (2013) consider the actual geometry of deformation zones and site-specific post-glacial loading
conditions. In this later study, they also looked into the issue whether an earthquake occurrence at zone ZFMA2 can have effects on the intersecting the zone
ZFMNW0017. Following are brief conclusions drawn from their study:
The influence of the interaction between deformation zones on the
secondary induced fracture displacement is found to be small.
Compared to the databases and regressions by Wells and Coppersmith
(1994), and Leonard (2010), the synthetic site-specific earthquake on zone ZFMA2 assumed in Fälth et al. (2013) produces a shear displacement of 1.8 m and a magnitude of Mw5.6 that are larger than in Fälth et al. (2010).
Target fractures in the model are in principle isolated. When fractures are
connected in the form of a discrete fracture network, displacements will be slightly smaller because the movement of adjacent and intersecting fractures will absorb some of the strain energy.
On the foot wall side of zone ZFMA2 where deposition areas are located,
fracture shear displacement is not greater than 30 mm.
2.4. The Consultants’ assessment
Even though the sounding conclusions by SKB listed above, the Authors argue that it is not enough to draw conclusive statements such as that the probability of canister failure due to shear displacement on the target fracture exceeding 50 mm is zero. It is necessary to conduct more detailed analyses to demonstrate that this threshold is not overcome, by using a realistic discrete fracture network and several deformation zones observed and documented by SKB with high confidence of existence at the site. Furthermore, it is not clear if SKB has explicitly considered the effects thermal loading on target fractures and deformation zones due to the heat from the canisters that are disposed in a simultaneous or sequential way, i.e. heat release from panel A to panel D.
Furthermore, assuming the rock mass to be an elastic medium is a rather unrealistic assumption. Although this assumption may give more conservative result in terms of shear displacements on target fractures, it may hold valid only if the investigated geometry is relatively simple, i.e. for a single fault, uniform size of the isolated fractures that are separated by uniform spacing distance, and when propagation is not allowed. This means that complex geometries where embedded large faults and small fractures can intersect one another, elasto-plastic behaviour of the rock matrix where damage is taken into consideration and can lead to coalescence of smaller fractures and results in growth at larger scales, cannot be considered.
3. The Consultants’ independent
modelling method
This Chapter deals with a review of some key references where Particle Flow Code (PFC) was used to solve Rock Engineering problems. The first part introduces the basic theory of PFC.
3.1. Bonded Particle Model and Particle Flow Code
In this assignment, the Authors use bonded-particle model (BPM) where they argue that rock behaves like a cemented granular material of complex-shaped grains in which both the grains and the cement are deformable and may break. Such a conceptual model can explain many aspects of the physical and mechanical behaviour of rock materials.
In BPM, unlike in Finite Element Method (FEM), rock damage is represented directly by the breakages of individual structural units or bonds. The BPM simulates the mechanical behaviour of a collection of non-uniform-sized circular or spherical rigid particles with geometric density that may be bonded together at their contact points. The rigid particles interact only at the soft contacts, which possess finite normal and shear stiffness. The mechanical behaviour of this system is described by the movement of each particle with respect to each other and the force and moment acting at each contact.
Newton’s second law of motion provides the fundamental relation between particle motion and the resultant forces and moments causing that motion, which is shown in Figure 1.
Figure 1. Calculation cycle for BPM in PFC (Itasca, 2009).
The following assumptions are inherent in the BPM:
The particles are circular or spherical rigid bodies with a finite mass.
The particles move independently of one another and can both translate and
rotate.
The particles interact only at contacts; because the particles are circular or
spherical, a contact is comprised of only two particles.
Law of Motion (applied to each particle) • resultant force + moment
Force-Displacement Law (applied to each contact)
• relative motion • constitutive law update particle positions
and set of contacts
The particles are allowed to overlap one another, and all overlaps are small in relation to particle size such that contacts occur over a small region (i.e. at a point).
Bonds of finite stiffness can exist at contacts, and these bonds carry load
and can break.
Generalized force-displacement laws at each contact relate relative particle
motion to force and moment at the contact.
The BPM is implemented in the two and three dimensional discontinuum programs Particle Flow Code (PFC) by Itasca using the Distinct Element Method (DEM). In the DEM, the interaction of the particles is treated as a dynamic process with states of equilibrium developing whenever the internal forces balance. The contact forces and displacements of a stressed assembly of particles are found by tracing the movements of the individual particles. Movements result from the propagation through the particle system of disturbances caused by wall and particle motion, externally applied forces and body forces.
The calculations performed in the DEM alternate between the application of Newton’s second law to the particles and a force-displacement law at the contacts (Figure 1). Newton’s second law is used to determine the translational and rotational motion of each particle arising from the contact forces, applied forces and body forces acting upon it, while the force-displacement law is used to update the contact forces arising from the relative motion at each contact.
The dynamic behaviour is represented numerically by a time-stepping algorithm in which the velocities and accelerations are assumed to be constant within each time step. The use of an explicit, as opposed to an implicit, numerical scheme provides the following advantages. Large populations of particles require only modest amounts of computer memory, because matrices are not stored. Also, physical instability may be modelled without numerical difficulty, because failure processes occur in a realistic manner; it is not necessary to invoke a non-physical algorithm, as is done in some implicit methods.
In the following sections, key modelling methods and techniques used in this assignment are briefly described and some key papers published by the Authors and several others are listed.
3.2. Fracture propagation modelling
Yoon (2007) and Yoon et al. (2012) have conducted a series of numerical modelling studies using PFC2D and investigated fracture and friction behaviours of crystalline brittle granite deformed under confined asymmetric loading (Zang et al., 2002). From the study, it turned out that the PFC2D modelling can be successfully applied for simulating initiation and propagation of fractures in brittle rock while other modelling methods, e.g. x-FEM, are unable to handle this type of problems (Dumstorff et al., 2006).
The simulated fracture paths with PFC2D match that observed from laboratory experiments on rock core samples under asymmetric compressive tests with various confinements. Under low confinement (< 5 MPa), the fracture initiates in Mode I from the edge of the asymmetric loading platen and propagates toward the unloaded portion of the granite sample (Figure 2a, top). Under higher confining pressure (10 MPa), after nucleus of Mode I fracture, an inclined rupture path develops and propagates towards the loaded portion of the model (Figure 2a, bottom). Modelling studies by Yoon (2007) using conventional particle model incorporated the concept
Figure 2. Fracture propagation paths in asymmetric compressive loading from: (a) laboratory observation (Zang et al., 2002), (b) conventional particle modelling (Yoon 2007), (c) clumped particle modelling (Yoon et al., 2012).
of rock fracture toughness in Mode I and II in the model parameterization and calibration and the resulting fracture propagation paths matched closely the
laboratory observation (Figure 2b). Modification in the model setup was done using clumped particle model in Yoon et al. (2012) and the results matched better the laboratory observations (Figure 2c).
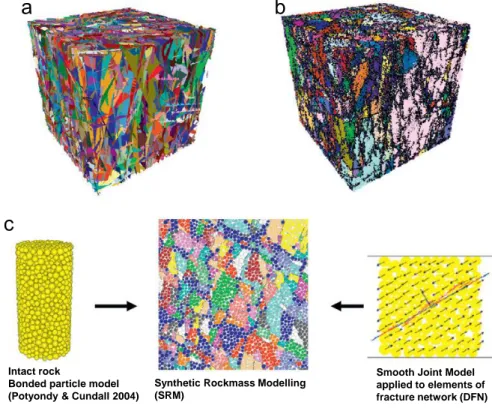
3.3. Synthetic rock mass modelling
PFC has shown the ability to reproduce features of the initiation and propagation of fracturing in rocks and jointed rock masses (Potyondy & Cundall 2004; Yoon et al., 2012). Kulatilake et al. (2001) demonstrated the use of PFC3D in modelling jointed rock block behaviour under uniaxial loading. Their model geometry was relatively simple, involving a few persistent through-going joints in a lab scale sample. Park et al. (2004) created more densely jointed 2D rock mass models with PFC2D by incorporating up to 100 joints from a discrete fracture network in a 30 m × 30 m block. They also demonstrated that the number of joints has a significant impact on the strain-softening behaviour, changing from brittle to ductile for an increasing number of joints.
The advantage of PFC modelling is that it allows for consideration of block breakage, including the impact of incomplete joints on block strength and
deformability. The Synthetic Rock Mass modelling (SRM) method is based on the
b
c
No conf inem ent C onf ining pres sure = 10 M Pa M ode I tens ile crac k M ode II s hear crac ka
generation and testing of 3D numerical synthetic rock mass samples (Figure 3b). This new technique brings together two well-established techniques: the bonded particle model for rock (Figure 3c, left), developed by Potyondy and Cundall (2004) for the simulation of intact rock deformation and brittle fracture, and the discrete fracture network (DFN, Figure 3a) (Derschowitz & Einstein, 1998) for the representation of the rock mass in-situ joint fabric. Each individual joint is
represented explicitly within the SRM sample making use of the recently developed smooth-joint contact model (Figure 3c, right). This new technique of joint
representation in PFC3D has made it possible to extend the approach of Park et al. (2004) to volumes of rock at the scale of 10 to 100 m containing thousands of non-persistent joints.
Figure 3. 3D DFN and the corresponding 3D synthetic rock mass model, and basic components
of Synthetic Rock Mass (modified from Mas Ivars et al., 2011).
Figure 4. Joint geometry and a 3D specimen with frictional through-going joint loaded by
gravity. Large shearing motion results in the creation of new smooth-joint contacts along the joint plane (Mar Ivars et al., 2011).
Intact rock
Bonded particle model (Potyondy & Cundall 2004)
Smooth Joint Model applied to elements of fracture network (DFN) Synthetic Rockmass Modelling
(SRM)
a
b
Intact rock is represented in the SRM samples by the bonded particle model for rock. A more detailed explanation of the BPM for rock can be also found in
Potyondy and Cundall (2004). In a BPM, microcracks are able to form, interact, and coalesce into macroscopic fractures according to local conditions. In this manner, macroscopic material behaviours not encompassed by current continuum theories can be investigated. The BPM has a demonstrated ability to reproduce many features of rock behaviour, including elasticity, fracturing (Yoon, 2007; Yoon et al., 2012), acoustic emission (Hazzard & Young, 2002, 2004; Yoon et al., 2012), damage accumulation producing material anisotropy, hysteresis, dilation, post-peak softening, and strength increase with confinement.
Interfaces in numerical models consisting of assemblies of bonded particles have been traditionally represented by de-bonding contacts along a line or a plane and assigning low strength and stiffness micro-properties to them. This way of representing interfaces is problematic because of the inherent roughness of the interface surfaces. Even the assignment of very low friction to the contacts on the interface generally does not lead to realistic sliding because of the roughness or bumpiness induced by the particles. Small particles may be used to represent the interface as a softer and weaker band, with several particles across the band to minimize the roughness. However, this is not feasible when the model requires a large number of interfaces.
To overcome this problem, Cundall proposed the concept of the “smooth-joint contact model” (Mas Ivars et al., 2008). The smooth-joint contact model simulates the behaviour of a smooth interface, regardless of the local particle contact orientations along the interface as shown in Figure 4. More detail of the behaviour of smooth joint contacts can be found in Mas Ivars et al. (2011).
SRM has been applied to the geomechanical characterization of coal seam reservoirs (Deisman et al., 2008, 2010; Esmaieli et al., 2009), the study of the effect sample size on rock mass strength (Esmaieli et al., 2009), and the study of the influence of veining in intact rock strength (Pierce et al., 2009). Zang et al. (2013) and Yoon et al. (2014) also used SRM and smooth joint contact model in the study of fluid injection induced seismicity in naturally fractured reservoirs.
A similar approach, making use of the SRM concept has been used for the stability analysis of vertical excavations in hard rock by Hadjigeorgiou et al. (2009) where smooth joints were used to mimic the in situ joint fabric and applied to a field case study of a mine in northern Quebec. First, fracture system was created (Figure 5a) which is later then linked to PFC3D to create fractured rock mass (Figure 5b). Successful linking of a 3D fracture generator and PFC3D allowed better insight on the interaction of structures and stress. It was possible to consider the structurally defined wedges and to visualize both gravity fall and sliding of unstable wedges.
Figure 5. (a) 3D representation of fracture system, (b) generated 3D rock mass model to mimic
the in situ joint fabric (Hadjigeorgiou et al., 2009).
3.4. Coupled thermo-mechanical modelling
The thermal option of PFC allows simulation of transient heat conduction and storage in materials consisting of bonded particles, and development of thermally induced displacements and forces. The thermal material is represented as a network of heat reservoirs (associated with each particle) and thermal pipes (associated with the contacts). Heat transfer by radiation and convection are not included in the present formulation. Thermally induced strains are produced in PFC material by modifying the particle radii as a function of heat expansion coefficient and the force carried in each parallel bond to account for heating of both particles and bonding material.
For the detailed explanation of the theory and application, the reader should refer to Wanne and Young (2008) where a numerical modelling study of a heated rock and validation of the modelling results by a laboratory experiment was carried out. The following four micro-properties are used by the PFC2D thermal logic:
Density ρ (kg/m3) of each particle,
Specific heat at constant volume Cv (J/kg-C),
Coefficient of linear thermal expansion α (1/C) of each particle,
Thermal resistance per unit length η (C/W-m) of each pipe.
Thermal strains are produced in the bonded particle model by accounting for the thermal expansion of the particles and of the bonding material that joins them. The thermal expansion is applied by a given temperature change ΔT resulting in a change of particle radius R by
ΔR = αRΔT Eq. (3-1)
where α is the coefficient of linear thermal expansion associated with the particle. If a parallel bond is present at the contact associated with a pipe, then it accounts for the expansion of the bond material by assuming that only the normal component of
the force vector carried by the bond ΔFn will be affected by the temperature change.
An isotropic expansion of the bond material, effectively changes the bond length, L, taken equal to the distance between the centroids of the two particles at the ends of
the pipe associated with the bond. This is modelled by changing the normal component of the bond force vector as:
ΔFn = -knAΔUn = -knA(αLΔT) Eq. (3-2)
where kn is the bond normal stiffness, A is the area of the bond cross section, α is the
expansion coefficient of the bond material (taken equal to the average value of the expansion coefficients of the particles at the two ends of the pipe associated with the bond), and ΔT is the temperature increment (taken equal to the average temperature change of the two particles at the ends of the pipe associated with the bond). Wanne and Young (2008) conducted PFC2D modelling where thermo-mechanical coupling is taken into account. The numerical results were compared directly to the corresponding laboratory experiment (Figure 6a) where a heated cartridge was placed into a central borehole in a cylinder of Lac du Bonnet granite in order to see and monitor by acoustic emission how the fracture initiates at one of the perimeters and propagates. It was concluded that the locations of the micro-cracking during pre- and post-failure in the model (Figure 6b) and in the experiment (Figure 6c) are qualitatively matching. The model captured the behaviour of the laboratory experiment relating to the macroscopic tensile failure driven by high hoop stresses. This study has demonstrated that capability and reliability of the coupled thermo-mechanical modelling in PFC2D is verified.
Figure 6. (a) Lac du Bonnect granite specimen tested with AE sensors, (b) pre- and post-failure
crack events simulated by PFC2D, (c) pre- and post-failure AE events monitored in the experiment (Wanne & Young, 2008).
a
b
c
3.5. Seismicity modelling
Each bond breakage in the bonded particle assembly is assumed to represent a fracturing process associated with seismic energy radiation. PFC runs in dynamic mode with low levels of numerical damping where a realistic level of energy attenuation in the rock is simulated. Upon a bond breakage in Mode I or Mode II, part of accumulated strain energy at the broken bond is released to the surroundings in the form of seismic wave. A numerical technique for calculating the seismic source information in PFC2D has been proposed by Hazzard and Young (2002 and 2004).
Modification was made to the algorithm to compute seismic source parameters in Mode I (tensile) and Mode II (shear) failures at pre-existing joints, i.e. breakages of smooth joint bonds (Yoon et al., 2014). Seismic source parameters are obtained for bond breakage in Mode I, II and also for the subsequent sliding after shear bond breakage, i.e. frictional slip. Bond breakage is treated as a fracturing event and the
seismic moment M0 is computed by a moment tensor Mij (2 by 2 in 2D model)
constructed for each bond breakage as show in equation below.
Mij = ΣΔ Fi Rj Eq. (3-3)
where ΔFi is the i-th component of the change in contact force, and Rj is j-th
component of the distance between the contact point and the event centroid. The sum is performed over the surface enclosing the event.
Seismic moment is then calculated from the eigenvalues of the moment tensor matrix. Details of this moment tensor can be found in Hazzard and Young (2002 and 2004):
M0 = (Σmj2/2)1/2 Eq. (3-4)
where mj is the j-th eigenvalue of the moment tensor matrix.
Other than fracturing events, slip events occur at pre-existing smooth joints undergo
shear slip. The seismic moment M0 for such slip events is computed by shear
modulus G, slip area A and shear displacement d through:
M0 = GAd Eq. (3-5)
The moment magnitude, Mw, is computed from the seismic moment M0 (in N·m) by
the following equation by Hanks and Kanamori (1979):
Mw = 2/3log M0 – 6 Eq. (3-6)
One example of seismicity modelling is shown in Figure 7, where the acoustic emission pattern in the granite sample under asymmetric compressive loading (Zang et al., 2002) is reproduced using the PFC seismicity modelling (Yoon et al., 2012). By using this technique, one could monitor and document the seismic event distribution in time and space as well as the magnitude of the events.
Figure 7. (a) Acoustic emissions observed in the asymmetric compressive test in Aue granite sample (Zang et al., 2002) and (b) seismic events simulated in the clumped particle model (Yoon et al., 2012).
Fracturing stage Frictionalsliding stage
a
-0.025 0.000 0.025 -0.050 -0.025 0.000 0.025 0.050 y ( m ) x (m) 0.1000 0.2000 0.3000 0.4000 0.5000 0.6000 0.7000 0.8000 0.9000 1.000b
Normalized time of occurrece4. Forsmark repository models
4.1. Generation of the horizontal section model of the
Forsmark site
4.1.1. Deformation zones
Figure 8 shows the distribution of the two rock domains RFM029 and RFM045, and deformation zones with length larger than 1 km, on a plane at 500 m depth within the Local Model Volume at Forsmark (Stephens et al., 2007). Zones marked in red are steeply dipping or vertical and have a trace length at the surface longer than 3 km. Zones marked in dark green are steeply dipping or vertical and are less than 3 km in length. Zones marked in light green are gently dipping (ZFMA1 and ZFMA2). As displayed by their colours (red and dark green), most of the deformation zones identified by SKB at Forsmark are steeply dipping or vertical. Figure 9 shows the PFC model representing the Local Model Volume where most of the deformation zones marked in green in Figure 8 are inserted. The model area has been enlarged in order to have additional space at the boundary to remove the side effects that the model boundary can have, e.g. unnecessarily high stress
concentration at the tip of the deformation zones being close to the boundary.
Figure 8. Distribution of the two rock domains RFM029 and RFM045, all deformation zones
with length larger than 1 km, projected on a plane at 500 m depth within the Local Model Volume at Forsmark (Figure 5-13 in Stephens et al., 2007).
The generated model does not contain the gently dipping deformation zones (ZFMA1 and ZFMA2), due to technical difficulty in representing gently dipping fracture planes in horizontal sections in PFC. Gently dipping zones are modelled through 2D vertical section models in Sec. 4.2. Another reason for excluding the gently dipping deformation zones in the PFC model is that they are located at a far distance from the repository rock mass from which the effects on the repository stability are estimated negligible.
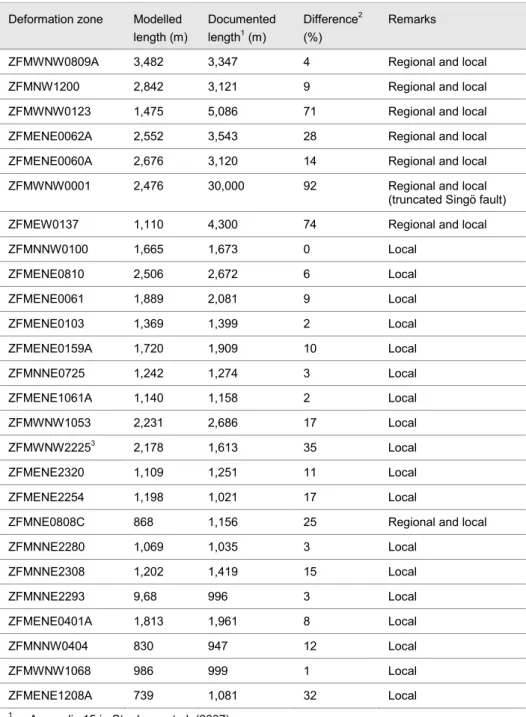
Table 1 lists the deformation zones included in the horizontal section model and their length (as simulated in the PFC model versus as documented by SKB, Stephens et al., 2007). As indicated by the difference in length, most of the deformation zones in regional-local model scale, except ZFMWNW0809A, are longer than their correspondent in the PFC model. This is due to the fact that the PFC model is limited to the size of the local model area, and the deformation zones extends beyond the size of the local model area are truncated, in particular the zone ZFMWNW0001 (Singö fault).
One should notice that the deformation zone ZFMWNW2225 is elongated by 35% compared to what SKB has documented. SKB has documented that zone is 1613 m long (total trace length at the surface) and truncated by ZFMENE0060A. However, ZFMWNW2225 is modelled so it extends further from ZFMENE0060A and reaches the panel D area. Such measure was taken as the layout D2 by SKB shown in Figure 10b (in particular circled region in the panel D area) does not match the deformation zones documented in Figure 8. Although SKB documented the length of ZFMWNW2225 with high confidence of existence, it was not clear whether there is any missing part of the trace of a deformation zone or another long fracture undetected that explain the empty section in panel D. Therefore, zone
ZFMWNW2225 was made longer than SKB in order to be conservative and to have the layout D2 make more sense.
Figure 9. The model generated in PFC for Forsmark consists of three rock domains: RFM045 in dark gray, RFM029 in light gray and the area in white as generic rock mass outside the repository. The repository contains deformation zones with length > 700 m (green).
The insert in Figure 9b shows an enlarged view of a part of one deformation zone. As it can be seen, a deformation zone is not represented as a single planar structure, which is SKB’s approach (Fälth et al., 2010), but as a combination of small fracture planes aligned in an echelon structure. The latter approach seems more reasonable as a way of representing deformation zones due to two reasons. The first reason is that fractures and faults (deformation zones) do not usually show perfectly planar structures. As SKB mentioned, irrespective of the surface roughness observed in the laboratory, fractures may be undulated or stepped on the large scale (Fälth et al., 2010). The second reason is that SKB has observed and documented that the deformation zones have large variations of thickness (see Appendix 15 in Stephens et al., 2007). By representing a deformation zone through stepped alignment makes it possible to create the large spans of thickness closer to reality.
N -1800 -1200 -600 0 600 1200 1800 -1800 -1200 -600 0 600 1200 1800
a
b
RFM45 RFM29 N y (3.6 km ) x (4.2 km)Table 1. Deformation zones included in the Forsmark horizontal section model and comparison of the length (modelled vs. documented by SKB).
Deformation zone Modelled length (m) Documented length1 (m) Difference2 (%) Remarks
ZFMWNW0809A 3,482 3,347 4 Regional and local
ZFMNW1200 2,842 3,121 9 Regional and local
ZFMWNW0123 1,475 5,086 71 Regional and local
ZFMENE0062A 2,552 3,543 28 Regional and local
ZFMENE0060A 2,676 3,120 14 Regional and local
ZFMWNW0001 2,476 30,000 92 Regional and local
(truncated Singö fault)
ZFMEW0137 1,110 4,300 74 Regional and local
ZFMNNW0100 1,665 1,673 0 Local ZFMENE0810 2,506 2,672 6 Local ZFMENE0061 1,889 2,081 9 Local ZFMENE0103 1,369 1,399 2 Local ZFMENE0159A 1,720 1,909 10 Local ZFMNNE0725 1,242 1,274 3 Local ZFMENE1061A 1,140 1,158 2 Local ZFMWNW1053 2,231 2,686 17 Local ZFMWNW22253 2,178 1,613 35 Local ZFMENE2320 1,109 1,251 11 Local ZFMENE2254 1,198 1,021 17 Local
ZFMNE0808C 868 1,156 25 Regional and local
ZFMNNE2280 1,069 1,035 3 Local ZFMNNE2308 1,202 1,419 15 Local ZFMNNE2293 9,68 996 3 Local ZFMENE0401A 1,813 1,961 8 Local ZFMNNW0404 830 947 12 Local ZFMWNW1068 986 999 1 Local ZFMENE1208A 739 1,081 32 Local
1 Appendix 15 in Stephens et al. (2007)
2 Relative difference (%) = |documented-modelled|/documented x 100
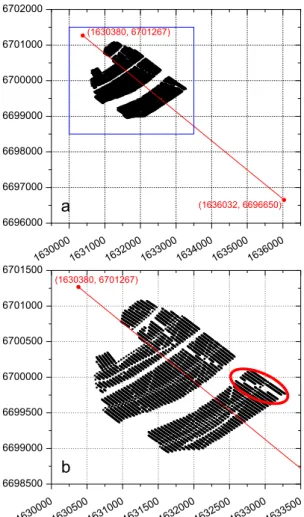
Figure 10. Canister deposition position in the layout D2. (a) NW-SE profile along candidate volume (see also Figure 15) is shown by the red line; (b) detail of the layout D2 in relation to zone ZFMWNW2225.
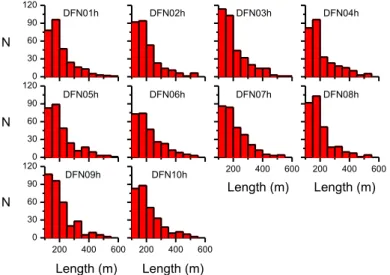
4.1.2. Discrete Fracture Network (DFN)
For the fracture network in the repository, ten realizations of DFN were created (see Appendix 2). Among the realizations, DFN03h and DFN06h are selected for the modelling as shown in Figure 11. Distributions of length and orientations of the fractures are shown in Figure 12 and 13, respectively, which show similar patterns. Coulomb Failure Stress (CFS) on each of the fractures is calculated and the histograms are shown in Figure 14. The histograms are fitted with the Gaussian distribution and the mean values are indicated. As positive value of CFS means that the fracture is close to frictional failure. Realization DFN03h is chosen as the most conservative realization while DFN06h as the least conservative.
16300001630500163100016315001632000163250016330001633500 6698500 6699000 6699500 6700000 6700500 6701000 6701500 (1630380, 6701267) 1630000163100016320001633000163400016350001636000 6696000 6697000 6698000 6699000 6700000 6701000 6702000 (1636032, 6696650) (1630380, 6701267)
a
b
Figure 11. Horizontal section of the models with realizations (a) DFN03h, the most conservative case, and (b) DFN06h, the least conservative from a frictional point of view.
Figure 12. Frequency distribution of the fracture lengths in ten DFN realizations.
a
b
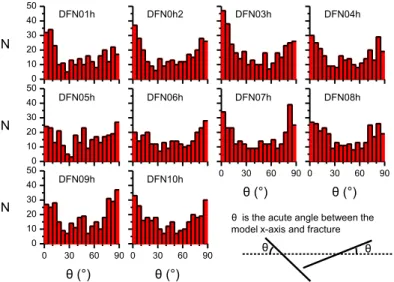
0 30 60 90 120 0 30 60 90 120 200 400 600 200 400 600 200 400 600 0 30 60 90 120 200 400 600 Length (m) Length (m) N N N DFN01h Length (m) Length (m) DFN02h DFN03h DFN04h DFN05h DFN06h DFN07h DFN08h DFN09h DFN10hFigure 13. Frequency distribution of the fracture orientations with respect to model x-axis in ten DFN realizations.
Figure 14. Frequency distribution of CFS of the fractures in ten DFN realizations. Numbers in
each figure are the mean value of the CFS of the Gaussian distributions fitted to the histograms.
0 10 20 30 40 50 0 10 20 30 40 50 0 30 60 90 0 30 60 90 0 30 60 90 0 10 20 30 40 50 0 30 60 90 N N N DFN01h θ ( ) DFN0h2 DFN03h DFN04h DFN05h DFN06h DFN07h DFN08h DFN09h DFN10h θ ( ) θ ( ) θ ( )
is the acute angle between the model x-axis and fracture
θ θ θ 0 30 60 90 120 0 30 60 90 120 -20 -16 -12 -8 -4 0 -20 -16 -12 -8 -4 0 -20 -16 -12 -8 -4 0 0 30 60 90 120 -20 -16 -12 -8 -4 0 -7.05 -7.52 -6.85 -7.29 -7.49 -7.73 -7.47 -7.02 -7.68 -7.13 CFS (MPa) CFS (MPa) N N N DFN01h CFS (MPa) CFS (MPa) DFN02h DFN03h DFN04h DFN0h5 DFN06h DFN07h DFN08h DFN09h DFN10h
4.2. Generation of the vertical section model of the
Forsmark site
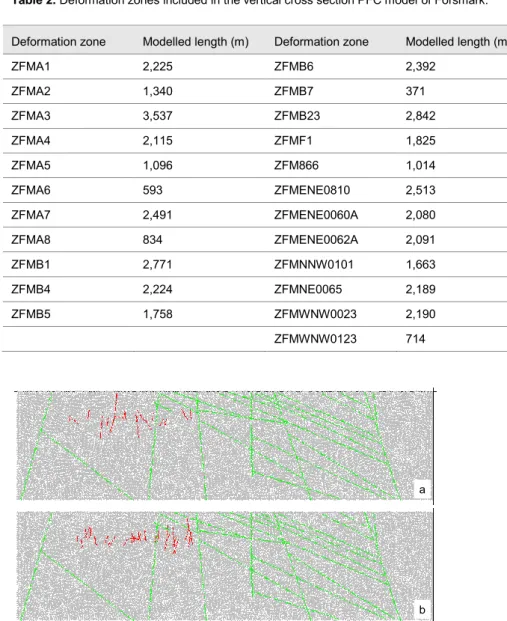
Figure 15a shows a NW-SE cross section through the Candidate Volume in the structural model containing rock domains and deformation zones at Forsmark (Figure 4-12 in SKB, 2011). From this figure, the vertical cross section model is constructed as shown in Figure 15b. Table 2 lists the deformation zones embedded in the vertical section model and their lengths. However, unlike in Table 1, comparison was not made with the SKB’s documented lengths as the documented length is the trace length of the deformation zones on the ground surface, not along a vertical section. The rock domain RFM032 is modelled as a rock domain rather than as a deformation zone to mimic the “tectonic lens” at Forsmark.
Figure 16 shows the vertical cross section models where two cases of DFN
realizations are implemented, DFN03v and DFN06v as in Sec. 4.1.2 and Figure 11. Those discrete fractures with trace length smaller than 125 m and those that do not intersect the repository horizon at 500 m depth are removed from the original DFN sets which are shown in Appendix 2.
Figure 15. (a) NW-SE cross section through the Candidate Volume in the structural model
showing rock domains and deformation zones (Figure 4-12 in SKB, 2011) and (b) vertical section model of Forsmark. The location of the vertical cross section is shown in Figure 10.
a b A1 B7 A2 A8 ENE0810 B5 B4 A3 B1 A7 A4 A5 A6 WNW0123 WNW0023 F1 ENE0060A ENE0062A B23 B6 NNW0101 866 2.1 km 2.1 km 7.3 km 8.0 km NE0065
Table 2. Deformation zones included in the vertical cross section PFC model of Forsmark.
Deformation zone Modelled length (m) Deformation zone Modelled length (m)
ZFMA1 2,225 ZFMB6 2,392 ZFMA2 1,340 ZFMB7 371 ZFMA3 3,537 ZFMB23 2,842 ZFMA4 2,115 ZFMF1 1,825 ZFMA5 1,096 ZFM866 1,014 ZFMA6 593 ZFMENE0810 2,513 ZFMA7 2,491 ZFMENE0060A 2,080 ZFMA8 834 ZFMENE0062A 2,091 ZFMB1 2,771 ZFMNNW0101 1,663 ZFMB4 2,224 ZFMNE0065 2,189 ZFMB5 1,758 ZFMWNW0023 2,190 ZFMWNW0123 714
Figure 16. Vertical section model of Forsmark with deformation zones in green and embedded
DFN fractures in red for realization (a) DFN03v and (b) DFN06v. Fractures shorter than 125 m that do not intersect the repository horizon are not considered in the model. Original DFN sets can be found in Appendix 2.
a
4.3. Model parameters
Table 3 shows the parameters used for the rock mass domains, deformation zones and target fractures. In addition to these parameters, other modelling parameters for the seismicity computation have been used. For each of the parameters related references are given in the table. For the rock mass domains, the rock mass parameters are used because of the high threshold for the shortest fractures in the model of 125 m. For the target fractures, the mechanical properties of the rock fractures from domain FFM01 are adopted (Table 4).
Table 3. Mechanical and thermal model parameters for the rock mass.
Parameter (unit) Value Reference/Remark
Density (kg/m3) 2700 Hökmark et al. (2010)
Deformation modulus (GPa) 70 Glamheden et al. (2007)
Poisson’s ratio 0.23 Glamheden et al. (2007)
Tensile strength (MPa) 2.3 Glamheden et al. (2007)
Cohesion (MPa) 27 Glamheden et al. (2007)
Friction angle (°) 50 Glamheden et al. (2007)
Thermal conductivity (W/m-K) 3.57 Hökmark et al. (2010) Linear thermal expansivity (1/K) 7.7e-6 Hökmark et al. (2010) Specific heat (MJ/m3-K) 2.061 Hökmark et al. (2010) 1 The specific heat is in unit of MJ/(m3-K) which is volumetric heat capacity. The value is
adjusted to mass specific heat capacity 792.96 in unit of J/(kg-K) as this is the unit required for input to the PFC thermal analysis.
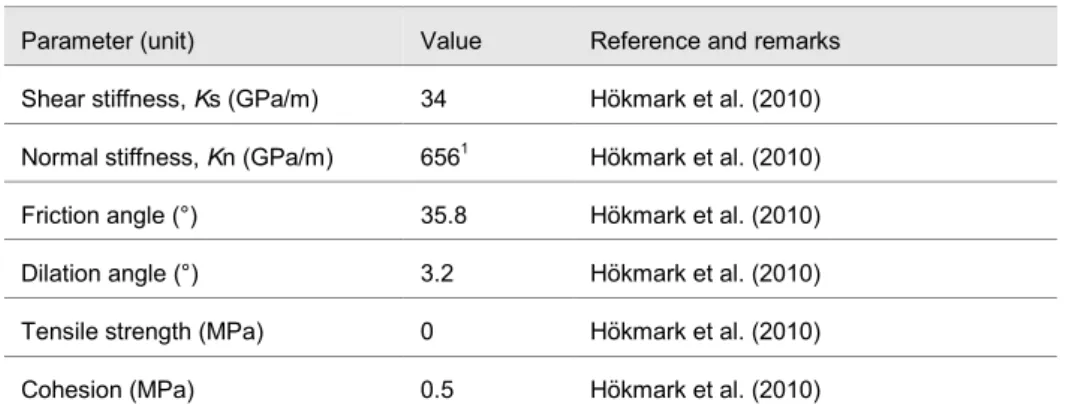
Table 4. Model parameters for the target fractures.
Parameter (unit) Value Reference and remarks
Shear stiffness, Ks (GPa/m) 34 Hökmark et al. (2010) Normal stiffness, Kn (GPa/m) 6561 Hökmark et al. (2010) Friction angle (°) 35.8 Hökmark et al. (2010)
Dilation angle (°) 3.2 Hökmark et al. (2010)
Tensile strength (MPa) 0 Hökmark et al. (2010)
Cohesion (MPa) 0.5 Hökmark et al. (2010)
1 The normal stiffness 656 GPa/m is obtained from testing of laboratory scale sample. For input to the smooth joint normal stiffness, this value is adjusted using the scaling relation by Morris et al. (2013): Kn (MPa/mm) = 7420×L-0.631, L is average particle diameter in the model (in cm).
4.4. Calculation of shear displacements of fractures
This section describes how the shear displacement of a single fracture is calculated. As mentioned earlier in Sec. 4.1, a single line fracture (joint) is represented as a collection of small length segments consisting of smooth joint elements. This is illustrated in Figure 17. Such representation of a fracture might be more reasonable than straight lines as fractures in nature do not show perfectly planar structures and, irrespective of the surface roughness observed in laboratory, fractures may be undulated or stepped at large scale (Fälth et al., 2010).
The main output of the modelling conducted in this study is the shear displacement of the target fractures due to thermal and earthquake loadings. For calculation of the shear displacement of a fracture that is represented by a collection of smooth joint, a representative value should be calculated. Figure 18 shows the distribution of shear displacement of fractures with respect to their trace length. Shear displacements values shown in black are calculated as the sum of the shear displacement of all the smooth joints constituting a single fracture, whereas those shown in red are calculated as the average of the smooth joints shear displacements. When displacements are summed, the representative shear displacement of a fracture is overestimated. The longer the fracture, the larger the sum of the shear displacements since more smooth joints constitute the fracture. Therefore, shear displacements of the smooth joints are averaged and used as a representative displacement for the whole target fracture.
Figure 17. Conversion of (a) a single planar joint to (b) a collection of smooth joints.
Figure 18. Distribution of shear displacement of target fractures calculated by summing the
shear displacements of smooth joints (in black) and by averaging the shear displacements of smooth joints (in red) with respect to fracture length.
a
b
100 200 300 400 500 600 1E-6 1E-5 1E-4 1E-3 0.01 0.1 1 10 Sh ea r d isp la ce m en t ( m )Target fracture trace length (m)
4.5. In situ stress field and its glacial evolution
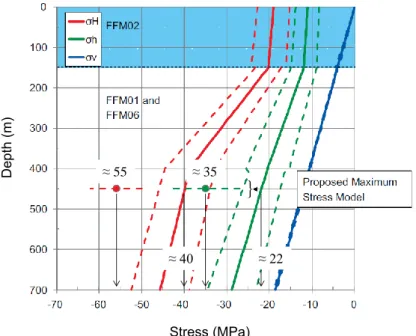
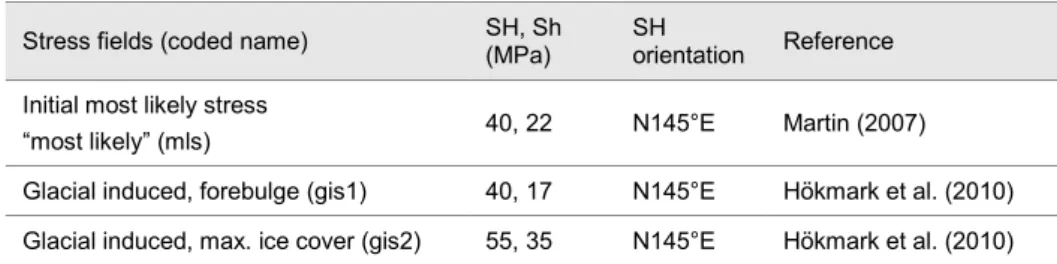
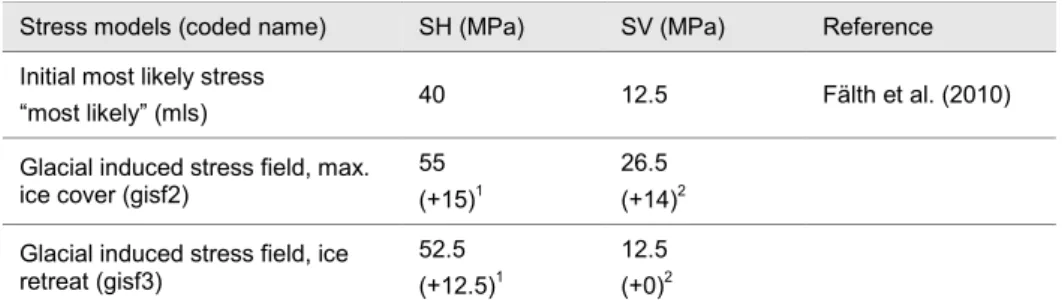
One in situ stress field is investigated for the horizontal section model. The reverse stress field defined as “most likely” by SKB is used in this study. The maximum horizontal stress is SH = 40 MPa and the minimum horizontal stress is Sh = 22 MPa at the repository depth (Martin, 2007; Glamheden et al., 2007) as shown by the solid lines in Figure 19. The maximum horizontal stress SH is oriented at N145°E. The in situ stress field might evolve during next glacial cycle based on a
reconstruction of the Weichselian glaciations. For the purpose of the modelling work, only two points in time, the major advance and retreat of the ice cover are
considered. Based on the modelling results by Lund et al. (2009), glacially induced stress increments (ΔSH, ΔSh and ΔSV) are calculated for the selected times indicated in Figure 20. One is at time of forebulge (gis1) after the first glacial maximum. The second is at time of maximum thickness of ice cover (gis2). The stress increments at the two selected times are read from the curves and added to the present day most likely stresses. Therefore, at time of forebulge, the resulting SH and Sh are 40 and 17 MPa, respectively. At time of maximum thickness of ice cover, the resulting SH and Sh are 55 and 35 MPa, respectively. At both times it is assumed that the orientation of SH is unchanged and equal to N145°E.
Figure 19. In situ stress model “most likely” with associated uncertainty spans (Glamheden et
al., 2007) for the region around the target area at Forsmark.
≈ 22 ≈ 40 Stress (MPa) Depth (m) ≈ 35 ≈ 55