Prey Selection of European Eel (Anguilla
anguilla)
Larvae in the Sargasso Sea: a
Molecular Approach
Hanna Alfredsson
Master Thesis in Aquatic Ecology
No: 2009:MBi1
University of Kalmar
Degree project works made at the University of Kalmar, School of Pure and Applied
Natural Sciences,
can be ordered from:
www.hik.se/student
or
University of Kalmar
School of Pure and Applied Natural Sciences
SE-391 82 KALMAR
SWEDEN
Phone + 46 480-44 62 00
Fax + 46 480-44 73 05
e-mail: info@nv.hik.se
This is a degree project work and the student is responsible for the results and
discussions in the report.
Prey Selection of European Eel (Anguilla anguilla) Larvae in the Sargasso
Sea: a Molecular Approach
Hanna Alfredsson
Master of Science in Aquatic Ecology 120 hp
Master Thesis, Aquatic Ecology: 60 hp for Master of Science
Supervisor: Associate Professor Lasse Riemann, University of Kalmar Examiner: Associate Professor Catherine Legrand, University of Kalmar
Abstract
The European eel (Anguilla anguilla) migrates to the Sargasso Sea to spawn. Even though the biology of A. anguilla leptocephali in the Sargasso Sea has been studied for several decades, information regarding their diet has remained unknown until now. Previous dietary studies concerning other species of leptocephali in the Pacific Ocean have been limited to the recognition of identifiable prey remains amongst gut contents. Hence, in this study a molecular approach relying on the detection of prey DNA amongst gut contents was used to study dietary profiles of A. anguilla leptocephali in the Sargasso Sea.
Leptocephali were collected during the circumglobal Galathea 3 expedition in spring 2007 to the Sargasso Sea. DNA extracted from gut contents were PCR amplified using universal primers targeting the nuclear 18S rRNA gene. In order to separate eel amplicons from prey amplicons, PCR products were analyzed by denaturing gradient gel electrophoresis (DGGE). Furthermore, clone libraries were constructed using universal primers targeting a portion of the 18S rRNA and mitochondrial COI gene, respectively. In total, the gut contents of 78 leptocephali were screened by DGGE.
A diverse array of eukaryotic taxa was identified, hence demonstrating the applicability of a universal PCR- DGGE approach to study gut contents of leptocephali. The results presented here show, for the first time, that young stages of A. anguilla leptocephali feed on a large variety of zooplankton of which many were gelatinous (e.g. Hydrozoa, Thaliacea and Ctenophora). Several of the identified taxa also constitute important parts of the Sargasso Sea zooplankton community and are of size ranges (adult or larval stages) that made them reasonable as leptocephali prey.
Sammanfattning
Den Europeiska ålen (Anguilla anguilla) vandrar till Sargassohavet för att leka. Trots att det har gått nästan ett århundrade sedan det upptäcktes att A. anguilla leker i Sargassohavet återstår fortfarande många frågor att besvara vad gäller ålens första livsstadier. I synnerhet vad ålyngel äter har varit en mycket omdiskuterad fråga genom tiderna. Under lång tid lyckades man inte identifiera rester av bytesdjur i maginnehållet hos ålyngel. Detta ledde till hypotesen att ålyngel inte aktivt intar föda utan snarare att de är beroende av löst organiskt kol (DOC) genom upptag över epidermis. Senare undersökningar av maginnehållet hos ålyngel med hjälp av mikroskop har emellertid föreslagit att partikulärt organiskt material (POM) utgör en näringskälla för ålyngel. Dock inkluderade inte några av dessa undersökningar ålyngel utav A. anguilla.
Undersökningar av maginnehåll är ofta svåra att utföra eftersom bytesdjur blir oigenkännliga till följd av matsmältningen. Som konsekvens av detta har det blivit vanligt att undersöka maginnehållet hos predatorer med hjälp av molekylära tekniker som grundar sig på identifiering av DNA från bytesdjur i maginnehållet. Följaktligen, i denna studie användes därför en molekylär teknik baserad på PCR för att studera dieten hos ålyngel (A. anguilla) i Sargassohavet.
Ålyngel (A. anguilla) samlades in från Sargassohavet under våren 2007 som en del av den danska expeditionen Galathea 3. DNA extraherades sedan från maginnehållet av totalt 78 ålyngel. PCR primers specifika för eukaryoter användes därefter för att amplifiera extraherat DNA och PCR produkter analyserades sedan genom tillämpning av DGGE (”denaturing gradient gel electrophoresis”). Som komplement till DGGE analysen konstruerades också klonbibliotek för ett fåtal prover.
Genom molekylär analys av maginnehållet hos ålyngel kunde ett flertal olika eukaryota bytesdjur identifieras. Dessa resultat utgör de första av sitt slag och påvisar att ålyngel (A.
anguilla) har ett aktivt födointag och att dieten består utav ett flertal olika djurplankton. De
två grupper av bytesdjur som identifierades från flest antal prover tillhörde Polycystinea och Hydrozoa. Ett flertal av de identifierade bytesdjuren tillhörde gruppen gelatinöst djurplankton såsom Hydrozoa, Thaliacea och Ctenophora. De identifierade bytesdjuren utgör också
grupper som är vanligt förekommande i Sargassohavet samt är av storleksordningar som gör dem rimliga som föda åt små ållarver.
Table of Contents
1. INTRODUCTION ... 7
2. MATERIALS & METHODS ... 9
2.1. Study area & collection of leptocephali... 9
2.2. Species identification of leptocephali ... 10
2.3. Extraction of DNA from leptocephali gut contents ... 11
2.4. 18S rDNA PCR amplification of gut contents... 11
2.5. 18S rDNA clone library analysis ... 11
2.6. DGGE analysis of 18S rDNA PCR products ... 12
2.7. DGGE image analysis ... 13
2.8. COI clone library analysis... 13
2.9. Sequence data analysis ... 14
3. RESULTS... 14
3.1. Identification of leptocephali by COI sequencing... 14
3.2. 18S rDNA clone library analysis ... 15
3.3. DGGE analysis of leptocephali gut contents (sample set A) ... 15
3.4. DGGE analysis of A. Anguilla leptocephali gut contents (sample set B) ... 17
3.5. COI clone library analysis... 22
4. DISCUSSION... 23
4.1. Methodological approach for analysis of gut contents... 23
4.2. Taxa identified from gut content analysis of leptocephali ... 25
4.3. Leptocephali feeding ecology ... 29
4.4. Methodological considerations... 31
4.5. Species indentification of leptocephali by COI sequencing ... 35
4.6. Concluding remarks... 36
ACKNOWLEDGMENTS ... 37
APPENDIX 1 ... 38
APPENDIX 2 ... 39
1. Introduction
The European eel (Anguilla anguilla) inhabits coastal and freshwater systems of Western Europe (Van Ginneken & Maes, 2005). However, once in their life time partially mature adult eels migrate to the Sargasso Sea which is their location of spawning (Schmidt, 1922). In the Sargasso Sea, the early life stage of A. anguilla is characterized by a transparent and leaf- like shaped larvae referred to as leptocephalus (Miller & Tsukamoto, 2004). Leptocephali larvae are transported back to European shelves by currents where they transform into glass eels (Schmidt, 1922) and subsequently migrate into freshwater systems (Van Ginneken & Maes, 2005).
Even though A. anguilla leptocephali in the Sargasso Sea have been of interest to biologists for a considerable time (Schmidt, 1922, Kracht & Tesch, 1981) still relatively little is known about their biology. In particular, the diet of leptocephali has remained an enigmatic question for several decades (Pfeiler, 1986, Westerberg, 1990, Bishop & Torres, 2001) and is still much debated. Over the years, numerous examinations of leptocephali gut samples did not reveal any identifiable prey remains (Hulet, 1978, Kracht & Tesch, 1981), ultimately leading to the hypothesis that leptocephali absorb dissolved organic carbon through epithelial uptake (Hulet, 1978, Pfeiler, 1986). In later studies particulate organic matter in the form of larvacean houses and zooplankton fecal pellets were identified by careful investigation of leptocephali gut contents (Otake et al. 1993, Mochioka & Iwamizu, 1996). However, these studies only involved leptocephali in the Pacific Ocean and consequently not A. anguilla. Information regarding the diet of A. anguilla leptocephali in the Sargasso Sea would greatly contribute to the general understanding of leptocephali biology. For instance, in the Sargasso Sea spawning is thought to take place in the Subtropical Convergence Zone (STCZ) since the highest abundance of A. anguilla leptocephali is found here (Schoth & Tesch, 1982). Why spawning takes place here is unknown, but a comparison between the distribution of prey items and A. anguilla leptocephali could be an important factor in order to answer this question. Additionally, A. anguilla is today highly endangered (ICES 2007) and the number of glass eels entering rivers has dropped to 1 % compared to the level of early 1980 (Dekker). Recently, environmental changes in the Sargasso Sea have been proposed as a contributing factor to the decline in A. anguilla recruitment (Knights, 2003, Friedland et al. 2007, Bonhommeau et al. 2008). Fluctuations in glass eel recruitment is thought to be connected to
decreased production (in turn dependent on increased sea temperature) in the spawning area of A. anguilla, hence, influencing food accessibility and composition in the Sargasso Sea (Bonhommeau et al. 2008). However, since the diet of A. anguilla leptocephali in the Sargasso Sea is unknown, it is difficult to directly relate leptocephali survival to environmental changes in their spawning ground. Hence, an enhanced understanding of eel ecology is essential to asses the causes of their decline, which in turn is necessary for a good management of the species. Furthermore, aquaculture of A. anguilla is today dependent on the capture of declining stocks of glass eels. This since most leptocephali hatched from artificially fertilized eggs (Anguilla sp.) die from starvation 10 to 18 days post hatching (Yamauchi et al. 1976, Tanaka et al. 1995, 2001, Yonna Tomkiewich, pers. communication). Consequently, knowledge about first feeding is important for a potential successful aquaculture of A.
anguilla leptocephali in the future.
Since prey remains in the guts of predators often are heavily degraded during digestion, molecular methods relying on PCR for the identification of prey have become a growing field (Symondson, 2002, King et al. 2008) given that short fragments of multi- copy genes are known to survive digestion for a substantial period (Zaidi et al. 1999). Previously, studies relying on the application of universal PCR primers targeting a portion of the nuclear 18S rRNA gene combined with denaturing gradient gel electrophoresis (DGGE) have been successfully used to study marine picoeukaryotic (Dìez et al. 2001) and protistan diversity (Gast et al. 2004) as well as gut contents of marine invertebrate predators (Martin et al. 2006, Maloy et al. 2009). Targeting the 18S rRNA gene in molecular studies of diet is advantageous since it’s a multi- copy gene (King et al. 2008) and the number of sequences available through public databases is very large (NCBI).
Hence, in this study universal primers targeting the nuclear 18S rRNA gene was used combined with DGGE to attain dietary profiles of young A. anguilla leptocephali collected from the Sargasso Sea during the Galathea 3 expedition in spring 2007. Since a priori knowledge regarding diet was lacking, universal primers were used. This represents the first study where a universal PCR- DGGE approach is used to study the diet of wild- caught A.
2. Materials & Methods
2.1. Study area & collection of leptocephali
Leptocephali were collected during leg 17 (St. Croix, Caribbean to Boston, USA) of the circumglobal Galathea 3 Expedition on board the Danish ship Hms Vædderen. Sampling took place from 29th of March to 10th of April, 2007, in the Sargasso Sea, Western Atlantic Ocean. 34 stations, distributed over three longitudinal transects crossing the Subtropical Convergence Zone (STCZ), were visited (Fig. 1).
Leptocephali were collected at each station by using a ring- net (diameter 3.5 m, length 25 m) having a mesh size of 600 µm. The net was lowered to a depth of 250 m in an oblique haul (ships speed 2.5 knots). Sampling took place both during day- and night time. Samples were kept cold and all the Anguilla- like leptocephali was sorted out within one hour. The guts of 17 leptocephali (sample set A) were excised directly on the boat and subsequently frozen (-80°C) until further analysis. All the remaining leptocephali samples were stored in 96 % ethanol and sorted first after the cruise. Guts were then excised from 61 additional A. anguilla leptocephali (sample set B). These additional gut samples were preserved in 96 % ethanol and stored at 4°C until further analysis. Before dissections, all leptocephali were photographed and length measured. Collected leptocephali ranged in size from 4 to 65 mm (Appendix 1, Appendix 2). Excision of guts from collected leptocephali was done by Thomas Damm Als at the Technical University of Denmark.
Fig. 1. Map showing the study area for leg 17 of the circumglobal Galathea 3 expedition. The hatched area
indicates the convergence zone (STCZ) and contour lines denote temperature (°C). Circles indicate the abundance of collected A. anguilla leptocephali at each station. The figure is retrieved from Peter Munk.
2.2. Species identification of leptocephali
To distinguish between A. anguilla and A. rostrata (American eel), collected leptocephali were identified molecularly by Thomas Damm Als at the Technical University of Denmark. In brief, DNA extracted from individual leptocephali were PCR amplified using different sets of species specific primers targeting a portion of the mitochondrial Cytochrome b gene (Trautner, 2006) and the nuclear 5S rDNA gene (Pichiri et al. 2006), respectively. In addition, identification of leptocephali was complemented by the analysis of 23 highly variable microsatellite loci.
However, for 12 of 17 leptocephali from sample set A species identification by the above described methods was lacking. Instead, species identification was done by using group specific PCR primers. The primer set FISH F1 and FISH R2 was used to amplify an approximately 655 bp region of the mitochondrial Cytochrome c oxidase subunit I (COI) gene (Ward et al. 2005).
PCR reactions were set up using Taq Ready To Go PCR Beads (GE Healthcare) (1 bead/ 25 µl reaction) supplemented with each primer to a final concentration of 0.1µM and 2 - 3 µl of template (DNA extract). To reach a final reaction volume of 25 µl sterile Milli- Q water was added. A negative control sample (DNA template replaced by sterile Milli- Q) was included in each PCR batch. All PCR reactions were prepared in a UV sterilized fume hood. The PCR program was as follows; initial denaturation at 94°C for 2 min, then 35 cycles at 94°C for 0.5 min, annealing at 54°C for 1 min and extension at 72°C for 1 min. At the end, a final extension step at 72°C for 10 min was included. Quality of PCR products was checked by electrophoresis on a 1% Agarose gel and visualized by ethidium bromide staining.
PCR products were purified using the E.Z.N.A.TM Cycle Pure Kit (Sigma). Cloning of PCR products into pCR®2.1-TOPO vector (TOPO TA Cloning, Invitrogen) were required to obtain
high quality sequences for several samples. Plasmid DNA was extracted using the E.Z.N.A. TM Plasmid Miniprep Kit (Sigma). Yield of plasmid DNA was quantified using PicoGreen dsDNA quantitation reagent (Molecular Probes) and a plate reader (FLUO Star, BMG Lab Technologies). To verify if clones contained an insert of correct size a PCR was set up using the M13F and M13R primers (TOPO TA Cloning, Invitrogen). All sequencing reactions were done commercially (Macrogen, Korea).
2.3. Extraction of DNA from leptocephali gut contents
DNA from leptocephali gut contents was extracted primarily according to the protocol described in Riemann et al. (2000) and Boström et al. (2004). Briefly, lysis buffer (750 mM sucrose, 400 mM NaCl, 50 mM Tris-HCL, 20 mM EDTA, pH 7.6) containing lysozyme (final concentration 5 mg mL-1) was added to all samples followed by an incubation at 37°C for 30
min. Proteinase K (final concentration 2 mg mL-1) and sodium dodecyl sulfate (final
concentration 0.5 %) was added followed by an overnight incubation at 55°C. Lysates were cleared from particulate material by centrifugation (16 000 g, 5 min), extracted twice by phenol:chloroform:isoamylalcohol (25:24:1) and once by chloroform:isoamylalcohol (24:1). DNA was precipitated by adding 2.5 x the volume of 100 % ethanol followed by centrifugation (16 000 g, 4°C, 30 min). Pelleted DNA was washed with 70 % ethanol, centrifuged (16 000 g, 10 min) and air dried followed by resuspension in 50 µl TE (10mM Tris-HCl, 0.1 mM EDTA, pH 8.0). For each set of DNA extractions, two negative control samples (only extraction chemicals) were included simultaneously in the process. Yield of DNA was quantified as described in the previous section. Samples were stored at -20°C until further analysis.
2.4. 18S rDNA PCR amplification of gut contents
The eukaryote- specific primer set Euk1A and Euk516r-GC (Díez et al. 2001) were used to amplify a ~ 560 bp region of the nuclear 18S rRNA gene. PCR reactions of 50 µl were set up as described in section 2.2 (final concentration of each primer 0.3µM). The PCR program was as follows; initial denaturation at 94°C for 130 s followed by 35 cycles of denaturation at 94°C for 30 s, annealing at 56°C for 45 s and extension at 72°C for 130 s. At the end a final extension step at 72°C for 10 min was included. PCR was also performed on all the negative control samples from the DNA extractions to control for contamination from extraction chemicals. Copepod DNA was used as a positive control. Prior to DGGE analysis, PCR products were quantified as described in section 2.2.
2.5. 18S rDNA clone library analysis
In order to asses whether potential prey DNA could be amplified from gut contents of leptocephali, 18S rDNA clone libraries were constructed for two gut samples (sample set A). PCR products were purified using the E.Z.N.A.TM Cycle Pure Kit (Sigma) and cloned into
pCR®2.1-TOPO vector (Topo TA Cloning, Invitrogen). Plasmid DNA was obtained using the
included at all steps. Subsequent analysis of plasmid DNA was done as described in section 2.2.
2.6. DGGE analysis of 18S rDNA PCR products
In order to separate eel DNA from potential prey DNA, PCR products were analyzed by denaturing gradient gel electrophoresis (DGGE). With the application of DGGE, PCR products of equal size can be separated due to differences in melting temperature caused by sequence variation (Schäfer & Muyzer, 2001). DGGE was performed using the D CODE Universal Mutation Detection System (Bio-Rad). Approximately 600 ng of PCR product was loaded onto 1mm thick 6 % polyacrylamide gels (acrylamide:bisacrylamide 37.5:1) with a denaturant gradient ranging from 20 to 50 % (100% denaturant defined as 40% deionized formamide and 7M urea). All gels were run for 6h at 150 V submerged in a 60°C bath of 1xTAE buffer (40mM Tris, 40m M acetic acid, 1mM EDTA, pH 7.4), stained for 30 min in SYBR Gold nucleic acid stain (10 000x dilution, Molecular Probes) and visualized by UV-illumination. In the beginning, time travel experiments were conducted to determine appropriate run time by loading samples after four, six and eight hours. Optimization of the gradient was also done by running samples (sample set A) on a wider gradient (20 to 80 % denaturant) at first.
17 leptocephali gut samples (sample set A) were analyzed by DGGE. Individual DGGE bands were excised, sequenced and identified by comparison with known sequences in GenBank. Two to three of these samples, containing identified bands, were then used as marker samples for the following DGGE analysis of 61 gut samples identified as A. anguilla (sample set B). Consequently, the identity of a band occupying the same position within the gradient as an already identified band in a marker sample was assumed to be the same. Nevertheless, several bands occupying the same position within the gradient as an identified band in a marker sample were still directly sequenced. In total, 79 excised DGGE bands were directly sequenced from DGGE analysis of sample set B.
In brief, individual DGGE bands were excised with a sterilized scalpel and DNA was eluted in 50 µl TE buffer at 4°C overnight. Samples were then vortexed and briefly centrifuged. An aliquot of eluate was used as a template for re-amplification of the band with the original primer set. In most cases, 10 to 100 fold dilutions of the template and decreased number of cycles in the PCR program were necessary to improve quality of bands. To confirm quality
and correct position of a band, PCR products were analyzed on DGGE by running them alongside the original sample. PCR products were then purified using the E.Z.N.A. TM Cycle Pure Kit (Sigma). If quality of PCR products were low (multiple bands), the band of interest were excised again and the process repeated or, if necessary, cloned into pCR®2.1-TOPO
vector (TOPO TA Cloning, Invitrogen). Plasmid DNA was obtained using the E.Z.N.A.TM Plasmid Miniprep Kit (Sigma). An aliquot of plasmid DNA (1000x dilution) was then used as a template in a PCR with the original primer set. To check if clones contained the correct insert (band) PCR products were analyzed on DGGE by running them alongside the original sample.
2.7. DGGE image analysis
DGGE images were analyzed using the Quantity One 1D Analysis Software from BioRad. Detection of bands was done automatically within each lane after background subtraction using a rolling disk size set to 8. Bands having the same position between different lanes were aligned and matched (tolerance level set to 0.5 %). This was used to construct a matrix where presence or absence of individual bands within each lane was scored (Appendix 2).
2.8. COI clone library analysis
In addition to the universal 18S rDNA primers, a universal primer set targeting a portion of the mitochondrial Cytochrome oxidase I (COI) gene was tested. This was done in order to cross validate results obtained by targeting two different genes. A clone library was therefore constructed for one A. anguilla gut sample (sample set B). The primer set LCO1490 and HCO2198 (Folmer et al. 1994) were used to amplify an approximately 700 bp region of the COI gene. The PCR conditions described in Hebert et al. (2003) were largely followed. PCR reactions were set up as described in section 2.2 (final concentration of each primer 0.3 µM). The PCR program was as follows: initial denaturation at 94°C for 1 min, then 5 cycles of denaturation at 94°C for 1 min, annealing at 45°C for 1.5 min and extension at 72°C for 1.5 min, followed by 35 cycles at 94°C for 1 min, 50°C for 1.5 min and 72°C for 1 min. A final extension step at 72°C for 10 min was included at the end. Duplicates of the 25 µl PCR reactions were pooled and purified using the E.Z.N.A.TM gel purification kit (Sigma). Cloning, extraction of plasmid DNA and subsequent analysis was done as described in the section 2.5.
2.9. Sequence data analysis
Phylogenetic affiliation of all obtained sequences was determined by comparison with sequences publically available in GenBank using the BLAST algorithm optimizing for highly similar sequences (Altschul et al. 1997). Sequences obtained from DGGE analysis (~500 bp) of sample set B were aligned by Clustal W using MEGA 4 (Tamura et al. 2007). The parameters gap opening penalty and gap extension penalty was set to 10 and 0.5, respectively. Supplementary 18S rDNA sequences appearing in BLAST searches were retrieved from GenBank and included in the alignment. To asses the degree of similarity between sequences, a phylogenetic tree was constructed in MEGA 4 using the Neighbor- Joining method and the Maximum Composite Likelihood model of nucleotide evolution (including both transitions/ transversions and choosing the pairwise deletion option). Robustness and statistical strength of nodes in the tree were assessed by performing 2000 bootstrap replications.
3. Results
To see if prey DNA could be amplified from gut contents of leptocephali, two 18S rDNA clone libraries were constructed as an initial step. Based on these results, a DGGE approach was chosen in order to separate prey DNA from eel amplicons. At first, 17 leptocephali gut samples (sample set A) were analyzed by DGGE. Based on these DGGE results, 61 additional
A. anguilla gut samples (sample set B) were analyzed in a similar way. In addition, a clone
library was constructed for one A. anguilla gut sample (sample set B) using universal primers targeting a portion of the mitochondrial Cytochrome oxidase subunit I gene (COI).
3.1. Identification of leptocephali by COI sequencing
Species identities were obtained for 9 of 12 leptocephali samples (sample set A) for which previous identification (section 2.2.) was lacking. In addition, the remaining 5 leptocephali samples (sample set A) already identified by means of Cyt b, 5S rDNA and 23 microsatellites (section 2.2.) were sequenced using the group specific primers.
Three leptocephali samples showed a 99 - 100 % similarity to A. rostrata (GenBank accession no. EU524442). Two of these samples had also been identified as A. rostrata by the methods in section 2.2. After A. rostrata, these samples showed a 96 % similarity to A. anguilla (AP007233) and A. japonica (EU266379). Four leptocephali samples showed a 99 - 100 % similarity to A. japonica but were also 98- 100 % similar to A. anguilla. After A. japonica and
A. anguilla, these samples showed a 96 % similarity to A. rostrata. Hence, the DNA
fingerprint was too similar between A. anguilla and A. japonica to achieve a clear differentiation at the species level. However, three of these samples were identified as A.
anguilla by the methods in section 2.2.
For the remaining samples, four additional species belonging to the order Anguilliformes were identified. Three leptocephali showed a 98 % similarity to Nemichthys scolopaceus (EU148261), two a 99 % similarity to Serrivomer lanceolatoides (EU148325), one a 99 % similarity to Serrivomer beanie (EU148322) and one a 99 % similarity to Derichthys
serpentinus (EU148144). Similarities to other nearest relatives appearing in BLAST searches
ranged between 81-88 %. That these samples were different from Anguilla sp. were also evident from the 18S rDNA- DGGE analysis. This, since they all showed a higher melting temperature in the gradient compared to the samples identified as Anguilla sp. (Fig. 2, Appendix 1). In addition, one leptocephali sample was only distantly related to Bassanago
albescens (EU074326, Anguilliformes) and Esox americanus (EU524577, Esociformes),
respectively, sharing a similarity of 83 %.
3.2. 18S rDNA clone library analysis
The highest proportion of analyzed clones was found to contain inserts of eel DNA (Anguilla sp. 18S rDNA, FM946071). Of 6 clones analyzed from the first clone library, all contained
Anguilla sp. 18S rDNA inserts (98 % similarity). From the second clone library, 25 of 28
analyzed clones contained Anguilla sp. 18S rDNA inserts (98% similarity). The 3 remaining analyzed clones contained inserts of Chaetognatha 18S rDNA (98 % similarity, DQ351880). This was later confirmed by DGGE analysis of the same sample (lane 7, Fig. 2); hence, the two methods are in support to each other.
3.3. DGGE analysis of leptocephali gut contents (sample set A)
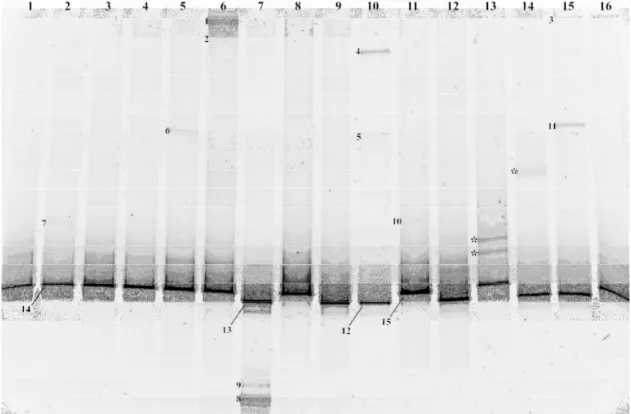
Results from the DGGE analysis are shown in Fig. 2 and Table 1. The universal primers amplified DNA from several different taxa, as well as the eel DNA itself (Anguilliformes). Eel DNA was visible on the DGGE gel as a single strong band well separated from the other unique bands. Of the 17 leptocephali gut samples analyzed by DGGE, eight appeared to be empty (i.e. only eel DNA visibly amplified). In Fig. 2 only 16 of 17 analyzed leptocephali gut samples are shown. The remaining sample was analyzed on a separate DGGE with only eel DNA being visibly amplified.
Sequences, approximately 500 bp in length, were obtained for 15 excised bands from which eight unique taxa could be identified. The unique taxa affiliated with Polycystinea, Chaetognatha, Copepoda, Hydrozoa, Apicomplexa, Ascomycota, Basidiomycota and Streptophyta. Polycystinea was the only taxa identified from more than one sample. Overall, sequence similarities to closest relatives in GenBank were high for the majority of taxa (>97 % similarity) with exception for Polycystinea and Apicomplexa (average 84.5 % similarity). Several of the sequences also had multiple tied percent identity matches when compared to published sequences in GenBank. Additionally, for sequences affiliating with Polycystinea and Hydrozoa several of the closest relatives appearing in BLAST searches came from species collected in the Sargasso Sea (Amaral- Zettler et al. 1999 and Accession No. AY665132, respectively).
Fig. 2. DGGE fingerprint of DNA amplified from 16 individual leptocephali gut samples. Numbers indicate
Table 1. Taxonomic affiliation of excised DGGE bands isolated from individual leptocephali gut samples.
Taxonomic affiliation of identified taxa is based on BLAST searches in GenBank. Only one representative is shown for sequences having multiple tied percent identity matches. The five closest relatives appearing in BLAST searches were used to determine the higher taxon level (Maloy et al. 2009). Band codes designate gel positions of excised bands shown in Fig. 1. (*Sequence is also equally identical to A. japonica (FM946132) and A. anguilla (FM 946070)).
Band code Sequence length (bp) Closest relative Sequence identity (%) Higher taxon Accession No. 1 488 Siphonosphaera cyathina 83 Polycystinea AF091145
2 480 Uncultured Polycystinea 88 Polycystinea AF530524 3 491 Siphonosphaera cyathina 84 Polycystinea AF091145 4 491 Saccharomyces cerevisiae 99 Ascomycota EU595876
5 477 Uncultured Trichocomaceae 99 Basidiomycota EU085016 6 496 Chelophyes appendiculata 99 Hydrozoa AY937346
7 494 Clausocalanus ingens 99 Copepoda AF367718 8 536 Pseudosagitta lyra 99 Chaetognatha DQ351880 9 536 Pseudosagitta lyra 98 Chaetognatha DQ351880
10 495 Triticum aestivum 99 Streptophyta AY049040
11 500 Goussia janae 83 Apicomplexa AY043206
12 515 Anguilla rostrata* 98 Anguilliformes FM946071 13 514 Anguilla rostrata* 97 Anguilliformes FM946071 14 512 Anguilla rostrata* 99 Anguilliformes FM946071
15 512 Anguilla rostrata* 99 Anguilliformes FM946071
3.4. DGGE analysis of A. anguilla leptocephali gut contents (sample set B)
Of 61 analyzed gut samples, 19 appeared to be empty (i.e. only eel DNA visibly amplified). Several of the gut samples (¼) were subjected to multiple separate PCR amplifications followed by DGGE analysis. DGGE fingerprints were highly repeatable over separate PCR’s using the same template. The number of unique bands per gut sample ranged between 0 and 16 (average three). 28 of the analyzed gut samples came from leptocephali collected during day time whilst the remaining came from leptocephali collected during night time (Appendix 2). No significant difference (p>0.05) in frequency of empty guts between day and night sampled leptocephali was found.
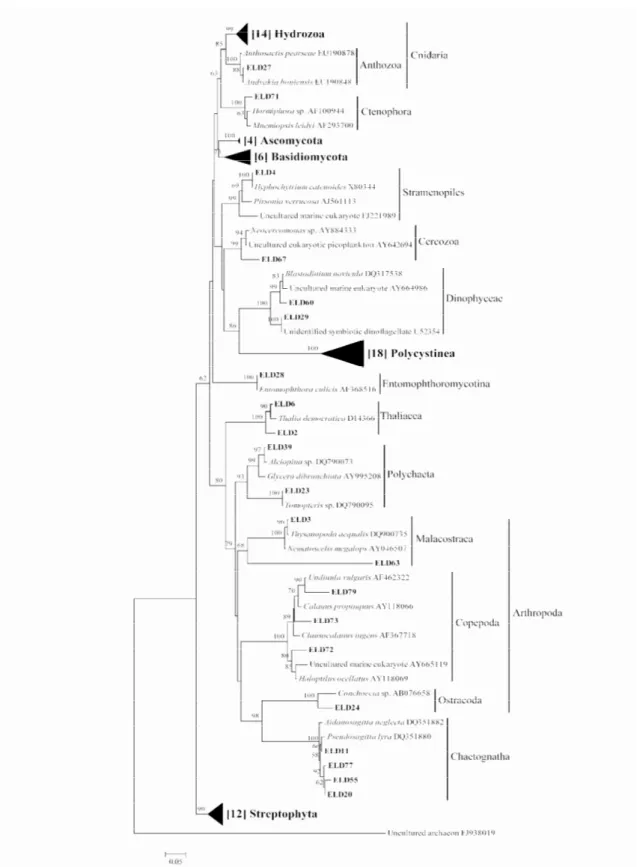
Sequences, approximately 500 bp in length, were retrieved from a total of 79 excised DGGE bands (four sequences were excluded from the NJ tree due to too low quality). The 18S rDNA universal primers amplified DNA from a wide range of different taxa (Fig. 3, Table 2). In total, sequences assembled into 17 different groups within the Neighbor- Joining tree (Fig. 4) that were supported by high bootstrap values (> 68 %). The majority of sequences affiliated with Polycystinea (24 %), Hydrozoa (19 %) and Streptophyta (16 %) (Fig. 5). These three major groups, together with sequences affiliating with Basidiomycota and Ascomycota, were collapsed into separate triangles within the Neighbor- Joining tree.
In total 18 sequences affiliated with Polycystinea and formed a cluster supported by very high bootstrap probabilities (100%). However, the sequence variability within the group was rather large with sequences sharing ≥ 82 % similarity to each other. Sequence similarities to closest relatives ranged between 84 to 99 % (Table 3) with representatives of Collozoum inerme (AY266295), C. pelagicum (AF091146), Thalassophysa pelagica (AY266296), Sphaerozoum
punctatum (AF018161) and Rhaphidozoum acuferum (AF091147). Several of the closest
relatives appearing in BLAST searches came from species collected in the Sargasso Sea (Amaral- Zettler et al. 1999).
The 14 sequences affiliating with Hydrozoa also formed a cluster supported by high bootstrap probabilities (99%). All sequences within the group shared a similarity of >95 % with one exception (85% similarity to the others). Sequence similarities to closest relatives were in general high and ranged between 88-100 % (Table 3) with representatives of Chelophyes
appendiculata (AY937346), Abylopsis tetragona (AY937345), Vogtia glabra (AY937318)
and Diphyes dispar (AY937318). In addition, an uncultured eukaryote (AY665132) collected from a depth of 100- 123 m in the Sargasso Sea occurred among the closest relatives in BLAST searches.
Twelve sequences affiliated with Streptophyta and the cluster was supported by high bootstrap probabilities (90%). However, the sequence variation within the group was relatively large with sequences sharing a similarity of ≥ 87 % to each other. Sequence similarities to closest relatives were high within the group and ranged between 94-100 % (Table 3). Surprisingly, the highest proportion of closest relatives was represented by several plant species associated with the terrestrial environment such as Pinus luchuensis (D38246),
Taxus globosa (EU107117) and Acer rubrum (U42494). However, an uncultured streptophyte
obtained from a depth of 30 m in the Atlantic Ocean (Viprey et al. 2008) and three uncultured eukaryotes obtained from the Mediterranean Sea (FJ834319, FJ834321 and FJ834324) were also occurring among the closest relatives.
Of the sequences related to Dikarya (Fungi), six were affiliating with Basidiomycota and assembled into a cluster supported by high bootstrap probabilities (73 %). The sequence variation within the group was rather large with sequences sharing a ≥ 86 % similarity to each other. Sequence similarities to closest relatives were high within the group and ranged between 96- 100 % (Table 3). The majority of closest relatives were represented by different
Basidiomycota of which many were associated with the terrestrial environment (e.g.
Tricholomella constricta (DQ825434) and Blastosporella zonata (EU708333)). However,
sequences were also closely related to two uncultured eukaryotes (EU446299 and DQ667617) obtained from a marine environment and an uncultured fungus (FJ785866) obtained from the Mediterranean Sea. The four sequences affiliating with Ascomycota also formed a cluster supported by high bootstrap probabilities (100 %). All sequences within the group shared a similarity of ≥ 97% and were 97-100 % (Table 3) identical to the yeast Saccharomyces
cerevisiae (EU011664).
Other, less frequently identified taxa, affiliated with Chaetognatha, Copepoda, Malacostraca, Thaliacea, Polychaeta, Dinophyceae, Ostracoda, Anthozoa, Stramenopiles, Cercozoa, Ctenophora and Entomophthoromycotina (Fig. 4). Sequence similarities to closest relatives were in most cases relatively high for these groups and are summarized in Table 3. For Copepoda and Malacostraca, uncultured eukaryotes (AY665119 and DQ900735, respectively) collected from the Sargasso Sea occurred among the closest relatives.
Based on the DGGE results and with the use of marker samples, identities were also deduced for 14 additional bands that were not directly sequenced. The result is summarized in Appendix 2. Primarily, identities of bands were deduced for the two main groups Polycystinea and Hydrozoa. Of 22 DGGE bands occurring in the same zone of the gradient, 19 were directly sequenced and found to affiliate with Polycystinea. Likewise, of 26 DGGE bands occurring in another zone of the gradient, 15 were directly sequenced and found to affiliate with Hydrozoa. Therefore, it was found reasonable to assume the identity of these additional bands to be the same as sequenced bands occupying the same respective zone within the gradient. Though, several DGGE bands could not be sequenced or identified by help of marker samples.
Fig. 3. DGGE fingerprint of DNA extracted from 14 individual A. anguilla gut samples. Numbers indicate codes
for excised and sequenced bands in Table 2. Bands that were not sequenced are indicated by *. Lane seven and eight correspond to marker samples containing previously identified bands (the marker samples are corresponding to the samples in lane two and five, respectively, in Fig. 2).
Table 2. Taxonomic affiliation of excised DGGE bands isolated from individual A. anguilla gut samples.
Taxonomic affiliation of identified groups is based on BLAST searches in GenBank. Only one representative is shown for sequences having multiple tied percent identity matches. The five closest relatives appearing in BLAST searches were used to determine the higher taxon level (Maloy et al. 2009). Band codes designate gel positions of excised bands shown in Fig. 3.
Band code Sequence length (bp) Cloesest relative Sequence similarity (%) Higher taxon Accession No. 1 485 Pinus luchuensis 100 Streptophyta D38246 2 485 Uncultured streptophyte 94 Streptophyta EU647131 3 472 Collozoum pelagicum 94 Polycystinea AF091146
4 481 Neocercomonas sp. 90 Cercozoa AY884333
5 485 Hyphochytrium catenoides 100 Stramenopiles X80344
6 483 Sistotrema brinkmannii 96 Basidiomycota DQ898712 7 506 Thysanopoda aequalis 99 Malacostraca DQ900735
8 484 Thalia democratica 96 Thaliacea D14366
9 484 Thalia democratica 94 Thaliacea D14366
10 486 Vogtia glabra 100 Hydrozoa AY937350
11 486 Sphaeronectes gracilis 98 Hydrozoa AF358070 12 483 Liriope tetraphylla 99 Hydrozoa AF358061 13 486 Tomopteris sp. 100 Polychaeta DQ790095
14 510 Conchoecia sp. 92 Ostracoda AB076658
Fig. 4. Neighbor- Joining (NJ) tree showing degree of sequence similarity between 75 18S rDNA sequences
obtained from analysis of A. anguilla gut samples and additional 18S rDNA sequences obtained from GenBank. Gut sequences (ELD) are marked in bold. Additional sequences are marked in italics followed by their accession number. Five groups were collapsed into triangles and the number of sequences per group is given within brackets. Only bootstrap values higher than 50 % (2000 replications) are shown. The scale bar indicates nucleotide substitutions per site. Archaea was used as an out- group to root the tree.
Table 3. Summary over taxonomic groups identified from gut content analysis of 61 A. anguilla leptocephali.
Sequence similarities represents degree of similarity to closest relatives retrieved using BLAST (GenBank).
Higher taxon No. of sequenced bands Sequence similarities (%) Average sequence similarity (%)
Polycystinea 18 84-99 91 Hydrozoa 14 88-100 98 Streptophyta 12 94-100 98 Basidiomycota 6 96-100 99 Ascomycota 4 97-100 99 Chaetognatha 4 93-99 95 Copepoda 3 87-92 89 Polychaeta 2 100 100 Malacostraca 2 65-99 82 Thaliacea 2 94-96 95 Dinophyceae 2 98-100 99 Ostracoda 1 92 92 Stramenopiles 1 100 100 Ctenophora 1 91 91 Entomophthoromycotina 1 100 100 Anthozoa 1 99 99 Cercozoa 1 90 90
Fig. 5. Schematic summarization showing proportion of sequenced bands (75 in total) per taxa obtained by gut
content analysis of 61 A. anguilla leptocephali. For ease of comprehension taxonomic groups represented by two or less sequences have been clustered together (others). For more detail on taxonomic groups, see Fig. 4.
Polycystinea Hydrozoa Streptophyta Basidiomycota Arthropoda Ascomycota Chaetognatha Others
3.5. COI Clone library analysis
In total, sequences approximately 660 bp in length were obtained from 17 analyzed clones. No clones containing eel DNA were found. Two clones contained inserts having a sequence similarity of 90 and 96 %, respectively, to Stylocherion affine (AF371984) and Thysanopoda
sequenced band was found to be 99% similar to Thysanopoda aequalis (Fig. 3, lane 4). Hence, results obtained by COI clone library analysis support the results obtained by PCR- DGGE analysis using universal 18S rDNA primers. However, the majority of clones remained unidentified. No matches producing significant results were found using BLAST optimizing for highly similar sequences. Using BLAST and optimizing for somewhat similar sequences, only produced distantly related matches (~70 %) to various Proteobacteria. Some of the sequences also produced distantly related matches (~70%) to various groups of terrestrial insects and Arthropods.
4. Discussion
One of the most critical stages in the life cycle of A. anguilla must be when young leptocephali leave the yolk- sac stage to initiate their first feeding. Despite this, the diet of A.
anguilla leptocephali has remained a mystery for several decades. Using a molecular-based
DGGE approach we can for the first time show that young A. anguilla leptocephali feed on a variety of zooplankton (Fig. 4). A large fraction of identified prey taxa was represented by gelatinous zooplankton (e.g. Hydrozoa, Thaliacea and Ctenophora), suggesting the dietary importance of these groups. Several of the identified taxa are known to be important constituents of the Sargasso Sea zooplankton community. Furthermore, the size range of either adult or larval stages make the identified taxa reasonable as leptocephali prey. In addition, the results demonstrate the efficacy of a DGGE approach to simultaneously detect prey DNA from a wide array of organisms in the guts of predators. The approach is therefore predicted to represent a method of general applicability for future studies intending to investigate the diet of marine invertebrates and fish larvae.
4.1. Methodological approach for analysis of gut contents
Initially, 18S rDNA clone libraries were constructed for two leptocephali gut samples (S.
lanceolatoides and N. scolopaceus) in order to see if potential prey DNA could be amplified.
Since universal primers were used it was expected that eel DNA would also be co- amplified. Results from the construction of clone libraries showed that 91 % of the analyzed clones contained eel DNA. Only three clones, isolated from one of the gut samples, contained inserts of prey DNA (Chaetognatha). The same situation has been encountered by others (Blankenship & Yayanos, 2005, Jarman et al. 2004). Jarman and co- authors (2004) intended
to analyze gut contents of the giant squid (Architeuthis sp.) using universal mitochondrial LSU rDNA primers and clone library analysis. However, of 80 analyzed clones they found 78 to contain Architeuthis sp. DNA. Only by applying a DGGE approach were they able to identify a significant number of prey DNA sequences. Obviously, clone library analysis of leptocephali gut contents did not constitute an attractive option. In addition, constructing clone libraries for large sample sizes (78 gut samples) would be both laborious, time- consuming and very expensive.
Consequently, as an alternative to clone library analysis, DGGE were chosen as an efficient method to analyze large sample sizes (Muyzer, 1999, Muyzer & Smalla, 1998). Initially, gut samples obtained from 17 different leptocephali were analyzed by DGGE (Fig. 2). These results suggested that the 18S rDNA universal primers were able to amplify DNA from a wide range of taxa (Table 1) and that they were specific to eukaryotes, which is in accordance with earlier results (Dìez et al. 2001). The results also indicated that DGGE could be an efficient approach to detect potential prey DNA from gut samples. Based on these results, gut contents from 61 additional A. anguilla leptocephali were analyzed by DGGE in a similar way. From the gut content analysis of A. anguilla a total of 17 unique eukaryotic taxa were identified based on their topological positions within the Neighbor- Joining tree (Fig. 4) giving further support for the conclusions drawn above.
In addition to the universal 18S rDNA primers, a second primer set targeting a portion of the mitochondrial COI gene was tested. Primers targeting the COI gene has previously been successfully used in dietary studies (Blankenship & Yayanos, 2005, Deagle et al. 2005, Agustì et al. 2003, Durbin et al. 2008 Vestheim et al. 2005) and are suitable since there is multiple copies per cell (King et al. 2008). However, in this study low success was achieved with the universal COI primers since the majority of clones (15 of 17) could not be identified. This was most likely due to a lack of reference sequences in the GenBank database. For instance, no COI sequences exist in GenBank for Polycystinea which was identified from the same gut sample by 18S rDNA- DGGE analysis. Other groups identified from the gut sample by 18S rDNA primers, but not by COI primers, were Basidiomycota, Streptophyta, Cercozoa and Stramenopiles. Malacostraca was the only taxa identified from the same gut sample by both primer sets. However, since sequence data is accumulating over time in data bases, taxonomic identification of sequences can be made retrospectively. In addition, eel DNA (A.
advantageous if successful otherwise. The complete mtDNA genome for A. anguilla is available in GenBank (Accession Numbers NC006531 and AP007223) and its therefore unlikely that eel DNA would be among the unidentified clones.
4.2. Taxa identified from gut content analysis of leptocephali
A diverse array of different taxa was identified from gut content analysis of leptocephali collected from the Sargasso Sea (Table 1, Fig. 4). However, for the majority of sequences multiple tied percent identity matches were obtained using BLAST (some shown in Table 1 and Fig. 4), most likely due to a low variation within the amplified region for some taxa. In addition, percent similarities to closest relatives were for some groups relatively low reflecting a lack of reference sequences in GenBank. Therefore, species identities should not be interpreted at the species or genus level. However, at the group level the Neighbor- Joining tree is exceedingly convincing with all groups supported by very high bootstrap probabilities (Fig. 4).
The largest fraction of sequenced bands was represented by Polycystinea (Fig. 5). Polycystinea are planktonic protists commonly referred to as ‘Radiolaria’ which also includes the Acantharea and the Phaeodarea (Yuasa et al. 2005, Amaral- Zettler et al. 1997). Radiolaria constitute an important part of the Sargasso Sea planktonic community (Not et al. 2007) and for the majority of sequences the closest relatives reported in GenBank came from specimens collected in the Sargasso Sea. This confirms that sequences most likely originate from there. Several of the species occurring among the closest relatives are known to have colony forming life stages (Amaral- Zettler et al. 1999) which usually range in size from several millimeters to centimeters (Michaels et al. 1995).
The second largest fraction of sequenced bands was represented by Hydrozoa (Fig. 5). All the closest relatives belonged to the order Siphonophora (Suborder Calycophorae). Calycophoran siphonophores (e.g. C. appendiculata and A. tetragona) are gelatinous zooplankton varying in size up to 1 cm (Bone et al. 1999). Siphonophores are commonly found in the Sargasso Sea or near Bermuda (Totton, 1936, Moore, 1949, Lo & Biggs, 1996) and constitute an important part of the total zooplankton community by terms of dry weight and volume (Deevey, 1971). In addition, an uncultured eukaryote collected from the Sargasso Sea occurred among the closest relatives in support for our findings. The relative abundance of adult and larval stages varies cyclically over the year (Moore, 1949).
Other taxa consisting of gelatinous zooplankton identified from the gut samples, though less frequently, were Thaliacea and Ctenophora (Fig. 4). Regarding Thaliacea, sequences shared a relatively high percent similarity (Table 3) to the salp Thalia democratica which has previously been found to be the most abundant salp in the Bermuda area (Moore, 1949). Salps exist both as solitary individuals (approximate size of T. democratica up to 1 cm) or in the form of extensive aggregates which occurs in a cyclic pattern over the year (Moore, 1949). Other, less frequently identified taxa were Chaetognaths and Polychaetes (Fig. 4). Chaetognaths have previously been found to constitute an important part of the Sargasso Sea zooplankton community in terms of dry weight and volume (Deevey, 1971) and several of the genera occurring among closest relatives are commonly found in the Sargasso Sea (Moore, 1949, Cheney 1985a, 1985b). In general, some of the Chaetognath genera occurring among closest relatives have been found to range in size from six to approximately 50 mm (Cheney, 1985b), consequently being of much larger size than most of the leptocephali collected in this study (Appendix 2). However, the production of Chaetognaths in the Sargasso Sea has been found to peak during early spring (Deevey, 1971, Cheney 1985a) coinciding with the time of leptocephali collection. The average size of ‘stage I’ larvae of the Chaetognath Sagitta sp. can range from approximately two to six mm (Tiselius & Peterson, 1986). Either Chaetognath eggs or larvae are therefore of sizes making them reasonable as leptocephali prey. Likewise is the situation regarding Polychaeta where adult stages are often of a larger size compared to the studied leptocephali. However, larval stages of Polychaetes have been found to be present in the Sargasso Sea through the whole year with peaks occurring during spring and summer (Deevey, 1971).
Furthermore, Arthropods (Copepoda, Malacostraca and Ostracoda; Fig. 4) were identified from a smaller fraction of the gut samples. Copepoda constitutes the largest fraction of the Sargasso Sea zooplankton community (Andersen, 2008, Deevey, 1971) but Ostracoda (Deevey, 1971) and Malacostraca (Moore, 1949) are also commonly found. From one of the gut samples, a sequence 99 % identical to the copepod Clausocalanus ingens was found (Table 1). Among the different groups of copepods found in the Sargasso Sea, Clausocalanus spp. has been found to be one of the most common ones (Deevey, 1971, Andersen, 2008). Larval stages of Arthropods (Crustaceans) are found during the whole year in the Sargasso Sea, with peaks occurring during March and April (Deevey, 1971) coinciding with the spawning of A. anguilla.
On the contrary, the finding of sequences affiliating with Cercozoa, Streptophyta and various fungi (Basidiomycota and Ascomycota) was somewhat unexpected. One sequence affiliated with Cercozoa (Fig. 4) which is a group consisting of zooflagellates commonly found in soil and freshwater samples around the world (Karpov et al. 2006). However, the sequence was not closely related to Cercozoa (90%) and it’s likely that the sequence is related to a marine flagellate not present in GenBank. Sequences somewhat distantly related to Cercozoa have previously been identified from the Sargasso Sea (0-200 m depth) (Not et al. 2007). A rather large fraction of the sequenced bands clustered within the group Streptophyta (Fig. 4). Sequences within this group were almost identical (average 98 %) to various higher plants associated with the terrestrial environment (e.g. Pinus luchuensis). This finding was rather surprising and the sequences were, at first, thought to represent possible (lab) contaminants. However, sequences almost identical to higher plants have also been found from DNA analysis of gut contents from lobster larvae (Suzuki et al. 2006) and from fin whale faeces (Jarman et al. 2004). In the study by Suzuki et al. (2006), presence of a sequence almost identical to the conifer P. luchuensis was suggested to come from air borne pollen brought into the lab. However, strict measurements to control for contamination was taken and negative controls from DNA extractions and PCR’s were always negative. In addition, the sequences were also highly similar to several uncultured eukaryotes, obtained from the Mediterranean Sea, and to an uncultured marine streptophyte, obtained from the Atlantic Ocean at a depth of 30 m (Viprey et al. 2008). Therefore, it may be possible that sequences clustered within Streptophyta (Fig. 4) are related to planktonic groups for which sequence data is missing in GenBank.
Likewise were the finding of sequences clustering together with Basidiomycota (Fig. 4) rather unexpected. The sequences were at first thought to be possible lab contaminants since several of the closest relatives were related to yeast- like fungi and moulds. For instance, the mould
Wallemia sp. known from air, sea salt (man-made salterns), soil and dried food (Zalar et al.
2005) occurred among the closest relatives but different fungi associated with the terrestrial environment (e.g. Blastosporella zonata, Lycogala flavofuscum and Tricholomella constricta) were also represented. However, of the closest relatives related to yeast- like fungi, at least one (Rhodosporidium fluviavle) is known from an aquatic environment (Fell et al. 1988). In addition, an uncultured fungus and several uncultured eukaryotes obtained from different marine environments (Mediterranean deep sea and subtropical water) occurred among the
closest relatives. It could therefore be likely that sequences within the cluster Basidiomycota are associated with marine fungi for which reference sequences is missing in GenBank. Sequences distantly related to Basidiomycota (and Ascomycota) have also been identified from DNA analysis of fin whale faeces (Jarman et al. 2004). A possibility could exist that yeast- like fungi are ingested by leptocephali when swallowing water or through the intake of POM (Otake et al. 1993).
In addition, the presence of sequences highly similar to the yeast Saccharomyces cerevisiae (Ascomycota) is difficult to explain. Little is still known about the exact niche of S. cerevisiae in the natural environment (Griffiths et al. 2005) and it could represent a possible lab contaminant. However, as stated previously strict measures were applied to control for lab contamination and the same reasoning applied for Basidiomycota could perhaps also be valid for Ascomycota.
However, some sequences were suspected to be of secondary origin since closest relatives were represented by taxa known to have either symbiotic or parasitic life cycles. The two sequences related to Dinophyceae (Fig. 4) constitute one example. One sequence was identical to an unidentified symbiotic dinoflagellate isolated from a Polycystinea. It is well known that many species of Polycystinea contains symbiotic Dinoflagellates (Gast & Caron, 1996) and the sequence was isolated from a gut sample from which Polycystinea also had been identified. The other dinoflagellate sequence was closely related to Blastodinium
navicula which is a genus known to parasitize the guts of marine planktonic copepods
(Skovgaard 2005, 2007). Likewise, the sequence came from a gut sample from which a copepod had been identified. Additionally, the putative Apicomplexan identified from one gut sample (Table 1) is a likely internal parasite of leptocephali. The sequence was, though very distantly, related to Goussia janae. The genera Goussiais parasitizing fish and occurs in the epithelial cells of fish intestines (Jirku et al. 2002).
In addition, Stramenopiles and Entomophthoromycotina (Fig. 4) were also suspected to be of secondary origin. This since closest relatives for both groups consisted of taxa known to be parasitic (Van der Auwera et al. 1995, Hajek et al. 2003). However, the link to any of the other identified groups was not as clear as in the previous cases. Regarding Stramenopiles, a genera (Pirsonia sp.) known to parasitize diatoms (Kühn et al. 2004) occurred among closest relatives. In addition, the sequence was also distantly related to an uncultured eukaryote
obtained from surface seawater (Fig. 4). Similarly, Entomophthoromycotina consists of a group known to parasitize Arthropoda (Diptera) (Hajek et al. 2003). However, the sequence was not isolated from a sample from which an Arthropod was identified.
4.3. Leptocephali feeding ecology
The majority of gut samples were retrieved from A. anguilla leptocephali ranging in size from 4 to 14.5 mm in length (Appendix 2). The smaller quantity of non Anguilla sp. leptocephali ranged in size from 19-65 mm (Appendix 1) and was probably in a later stage of development. Developmental studies of A. japonica (Yamauchi et al. 1976, Kurokawa et al. 1995, Tanaka et al. 2001,) and A. anguilla leptocephali (Jonna Tomkiewicz, pers. communication) have shown that the yolk- sac is completely absorbed 7 to 12 days, respectively, post hatching. At this stage, the leptocephali have reached a length of approximately 6 to 8 mm. Consequently, nutrition needs to be gained from an external source at this point. This corresponds well to the results obtained in this study where prey items were detected in leptocephali having a size of 6 mm or more (Appendix 2). However, one exception exists where yeast- like fungi was detected from a leptocephali being 4.5 mm in length.
Feeding behavior of young leptocephali has previously been observed where early larval stages (≥7mm) have been fed paste food (Tanaka et al. 2001, Mochioka et al. 1993) or rotifers (Tanaka et al. 1995). In the study by Tanaka et al. (2001), leptocephali that failed to feed on the supplied paste food died from starvation shortly after leaving the yolk- sac stage. Several studies have also shown (Kurokawa et al. 1995, 1996, Kruse et al. 1996,) that the intestine of leptocephali is capable of enzymatic digestion at this early stage (≥7mm).
Furthermore, by looking at Appendix 2 a tentative increase in the diversity of prey taxa with increasing size of the leptocephali is visible. This could suggest that as the leptocephali grow larger and their swimming capability increases (Castonguay & McCleave, 1987) a larger array of various preys becomes available for them.
It has previously been proposed that leptocephali may use their large forwardly pointing teeth to grasp and puncture soft bodied prey and consequently suck their ‘protoplasmic juices’ (Hulet, 1978). In addition, due to morphological characteristics (e.g. forwardly pointing teeth, transparent body) and a lack of identifiable prey remains in the guts of leptocephali,
Westerberg (1990) proposed gelatinous zooplankton (e.g. Hydromedusae, Siphonophora, Scyphomedusae, Ctenophores and salps) to be their main source of nutrition. Indeed, the results presented here are much in accordance with the hypothesis suggested by Westerberg (1990) since a large majority of sequences affiliated with different groups of gelatinous zooplankton (Siphonophores being a major one). It could therefore be likely that gelatinous zooplankton is an important source of nutrition for young leptocephali and that their presence is not easily detected among gut contents leading to the observed lack of identifiable food items (Kracht & Tesch, 1981) that have puzzled researches for a long time. Gelatinous zooplanktons, such as Siphonophores, are known to constitute important prey items for many invertebrate groups (Larson et al. 1991). In addition, DNA gut content analysis of lobster larvae, being of approximately the same size as the leptocephali studied here, revealed Siphonophores and Salps as prey items (Suzuki et al. 2006). Moreover, many colony forming Polycystinea which was the most commonly identified taxa are known to have a gelatinous matrix (Michaels et al. 1995).
The theory suggesting DOC as a source of nutrition through epithelial uptake (Hulet, 1978, Pfeiler, 1986) has hitherto never been experimentally tested on living specimens. This is most likely due to the frailty of leptocephali (Miller & Tsukamoto, 2004). However, in Mochioka
et al. (1993) young leptocephali were kept in tanks with unfiltered running seawater
containing particulate organic matter. All the youngest starved to death within a short period. If leptocephali would be able to sustain growth primarily by DOC uptake through epithelia or by POM through swallowing of water they should not have become malnourished (Mochioka & Iwamizu, 1996). It appears that leptocephali also need other sources of nutrition than simply DOC and POM which the results presented here indicates.
Collections of the leptocephali examined in this study took place both during day and night time (Appendix 2). No difference, whatsoever, in frequency of gut samples appearing empty were detected between day and night sampled leptocephali. In a study by Otake & Mochioka (1993), particulate matter was found in the guts of different leptocephali species collected during night time. This may suggest that leptocephali are ingesting food both during day and night time. It is known that leptocephali larger than 5 mm perform diel vertical migration (Schoth & Tesch, 1982, Castonguay & McCleave, 1987) which could be due to either diel rhythm of feeding or predator avoidance. However, due to the unknown retention time of prey for leptocephali no firm conclusions can be made.
Larvaceans has previously been found to constitute an important part of the Sargasso Sea zooplankton community in terms of number (Deevey, 1971, Andersen, 2008). Considering that larvaceans earlier has been shown to constitute a source of nutrition for leptocephali (Mochioka & Iwamizu, 1996) it can be regarded as somewhat surprising that no larvaceans has been identified from any of the gut samples.
However, in the study by Mochioka and Iwamizu (1996) only the larvacean houses, and not the larvacean bodies, were detected within the guts of leptocephali. The average mouth size of leptocephali used in their study was smaller than the average size of larvaceans. It was therefore suggested that leptocephali use their teeth to grasp the larvacean houses, but that the larvacean itself is able to flee during the sluggish attack. Indeed, larvaceans are known to have good escape mechanisms (Alice Alldredge, pers. communication) and to abandon their houses when disturbed (Lohmann, 1909). Larvaceans also abandon their houses when they become clogged (Alldredge, 1976) and it could be that leptocephali also forage on already discarded houses. Considering that larvacean houses have been found to chiefly consist of polysaccharides (Körner, 1952) it could be that larvaceans are not detected by DNA approaches. However, in the study by Mochioka & Iwamizu (1996), collected leptocephali ranged in size from 38 to 128 mm, thus being three to twelve times larger in size than most of the leptocephali used in this study (Appendix 2). Nevertheless, some of the leptocephali used in this study were within the same size range (Appendix 1).
4.4. Methodological considerations
Many areas of possible limitations and biases needs to be considered when interpreting the results presented in this study. To begin with, gut contents are complex sources of DNA consisting of a mix of DNA from the predator itself, its inherent gut flora and potential prey items. When using PCR to amplify DNA from complex sources it is incorrect to purely assume that all DNA will be equally amplified. This can only be true if the amplification efficiency is equal for all DNA molecules in the template (Wintzingerode et al. 1997). When using universal primers, the DNA from taxa having precise complementary sequences will be preferentially amplified (Blankenship & Yayanos, 2005). Due to primer specificity, it could therefore be possible that some taxa failed to amplify. However, as previously mentioned, the results indicate that the 18S rDNA universal primers were able to amplify a wide range of taxa (Fig. 4).
Amplification efficiency could also be dependent on the size (bp) of the targeted fragment. This since prey DNA starts to degrade during digestion, consequently limiting detection to recently ingested prey. It has previously been shown that targeting smaller fragments (<300 bp) increase the detection time of prey DNA in gut samples (Zaidi et al. 1999, Hoogendoorn & Heimpel, 2001). In addition, by studying DNA from fecal samples Deagle and co- authors (2006) showed that the quantity of amplifiable prey DNA is inversely related to size of the amplified fragment. In this study, an approximately 500 bp fragment was used to target prey DNA in gut samples. This could potentially have resulted in a reduced PCR efficiency leading to increased number of guts appearing empty and/or a decreased number of detected taxa. However, previous work by others has shown that fragments up to 600 bp can be successfully amplified to detect prey items from gut contents (Blankenship & Yayanos, 2005, Juen & Traugott, 2005, 2006). Juen & Traugott (2005, 2006) found no difference in amplification success of prey DNA by targeting 127 and 585 bp long fragments, respectively, up to 24 h after ingestion by the predator. In this study, a universal primer set targeting a 210 bp fragment of the 18S rRNA (Dìez et al. 2001) gene was initially tested on sample set A. No major difference in number of unique bands was seen between the two primer sets when samples were analyzed by DGGE. However, when working with this primer set several methodological problems related to the isolation of unique DGGE bands was encountered. The work with this primer set was therefore not continued.
Furthermore, when intending to analyze gut contents by use of universal primers co- amplification of DNA from the predator is a major problem. DNA from the predator is usually present to a larger extent and often of a better quality compared to partly degraded prey DNA. During the first cycles of the PCR, templates occurring in fewer amounts (prey- DNA) tend to be missed. Consequently, co- amplification of DNA from the predator can mask the detection of possible prey items (Vestheim & Jarman, 2008). Different approaches have been used to limit the detection of DNA from the predator in dietary studies such as use of restriction enzymes post PCR (Blankenship & Yayanos, 2005), group- specific primers (Jarman et al. 2004, Deagle et al. 2007, Passmore et al. 2006) or predator specific blocking primers (Vestheim & Jarman, 2008). However, the use of restriction enzymes demands a cutting site unique only for the predator and is not efficient if host DNA already swamped the amplification of prey DNA. Group- specific primers require an a priori knowledge regarding diet, which was lacking for leptocephali. However, the use of specific blocking primers (Vestheim & Jarman, 2008) could perhaps have been applicable in this study.