ARTIFICIAL NEURAL NETWORKS
SUPPORTING CAUSE AND EFFECT
STUDIES IN PRODUCT-SERVICE SYSTEM
DEVELOPMENT
Omsri Kumar Aeddula, Johan Wall, and Tobias Larsson
Blekinge Institute of Technology, Sweden omsri.kumar.aeddula@bth.se
Abstract: A data analysis method based on artificial neural networks aiming to support cause-and-effect analysis in design exploration studies is presented. The method clusters and aggregates the effects of multiple design variables based on the structural hierarchy of the evaluated system. The proposed method is exemplified in a case study showing that the predictive capability of the created, clustered, dataset is comparable to the original, unmodified, one. The proposed method is evaluated using coefficient-of-determination, root mean square error, average relative error, and mean square error. Data anal-ysis approach with artificial neural networks is believed to significantly im-prove the comprehensibility of the evaluated cause-and-effect relationships studying PSS concepts in a cross-functional team and thereby assisting the dif-ficult and resource-demanding negotiations process at the conceptual stage of the design.
Keywords: Artificial neural networks; Data analysis; Design exploration; Prod-uct-Service System (PSS).
1 Introduction
Concept evaluation in product development has historically been overly reliant on experts’ ambiguous and subjective judgments and qualitative descriptions [1]. Hence, a major quest in engineering design is the search for information and the subsequent analysis and build of knowledge. An efficient way to generate data is through experimentation. This means running some kind of test procedure for vari-ous input data and to study how these data affect the output of the procedure. Ex-perimentation is commonly done using models, simplified representations of the studied system, nowadays predominantly mathematical models. Experimentation with mathematical models is here referred to as simulation. Building and solving
mathematical models, considering a diverse set of systems and disciplines, has re-ceived significant attention within the research community during the last decades. However, the question regarding how designers should interpret and use these mod-els and solutions in design has been largely neglected [2]. This problem is even more pronounced considering that designing industrial products or services is now-adays normally a group effort and rarely an individual act [3].
The transition away from product view, towards providing product-service sys-tems, increasing product complexity, and the long-prevailing concurrent engineer-ing approach makes inroads for this development [4]. This emphasizes the need for collaborations, internally within the organizations and externally with suppliers, customers, and other stakeholders in the value chain, especially in the early phases of product development, where the information is scarce, vague, and potentially conflicting.
Supporting cross-functional design teams with data analysis and visualization, helping them to interpret and utilize simulation results, hence become a key success factor, while providing a potential setting for information sharing, communication, understanding, and building of knowledge. Data analysis assists in transforming in-formation into knowledge, exploiting the relationships among the data, to drive the product or service design process [5].
Bititci et al. [6] emphasize exploring the cause-and-effect relationships among the multiple variables involved, as a part to measure the quality of design improve-ment. Wall et al. [7] propose a data analysis method based on partial least square regression supporting cause-and-effect analysis in design exploration studies for linear and continuous variables. The proposed method clusters and aggregates the effects of multiple design variables based on the structural hierarchy of the evalu-ated system. According to [8], multiple linear regression analysis is a tool to under-stand the relationship between one dependent variable and several independent var-iables. Linear regression methods are easy to implement and simpler in design. The limitation of multiple linear regression analysis is that they are modelled for linear data, owing to which they cannot discern any nonlinear relationships in data [9]. However, design problems often contain non-linear relationships between design variables and attributes. Hence, a method able to cope also with nonlinear relation-ships is sought [10].
In recent years, artificial neural networks have been widely employed in model-ling dynamic systems, as they are found to accurately model continuous functions and shown to have good predictive performance in simulations of non-linear dy-namic systems, due to their adaptability, flexibility, and optimization capabilities [11]. They have the ability to learn the system behaviour from samples by inspec-tion. This paper extends and modifies the method proposed by [7].
An artificial neural network-based data analysis method to understand quantified cause-and-effect relationships of the studied system is proposed. More specifically the aim is to develop a method able to support quantification of dependencies be-tween design variables (independent variables) and design attributes (dependent variables), irrespective of the data linearity, on a component or subsystem level in
cases where more than one independent variable drives the configuration of the component or subsystem.
The remainder of this paper is organized as follows; In Section 2, the proposed data analysis method is presented. In Section 3 the proposed method is exemplified through a case study. The paper concludes with discussion, conclusions, and direc-tions for future work.
2 Data Analysis Method
A cause-and-effect relationship may be studied by establishing mathematical equations between design variables (independent variables) and design attributes (dependent variables). Design variables are entities that may be changed in an experiment affecting the shape or properties of the studied system. An attribute can be defined as any aspect of the product itself or its use that can be used to compare product alternatives [12]. As an example, the attributes of an automobile might be acceleration or fuel consumption. Quantification of dependencies between design variables and design attributes is established by analyzing the design variable’s contribution towards the design attribute. Linear regression methods analyze the design attributes dependencies on the design variables from the generated linear mathematical equation coefficients [13]. This type of analysis fits for linear observed variables and limits the applications to data with non-linearities and for clustered variables.
The variables in a design exploration study might be classified as a two-level hierarchy including design variables and design attributes. Typically these design variables are not identifiable as components or subsystems. Rather, a subset of design variables in a design exploration drives the configuration of a particular component or subsystem and also attributes associated with that component or subsystem. As this “intermediate level” of components and subsystems are not directly included in the conducted experiment, data to populate, and in the next step analyze it, does not exist. Rather it is to be inferred from the set of observed design variables by clustering the identified subset of design variables and aggregate their effect on the design attribute. Creating an intermediate level without losing the significant contributions of other non-clustering design variables is a vital task.
Data linearity affects the “goodness” of fit of the intermediate level in the structural hierarchy [7]. This paper proposes a variable clustering method, in combination with an artificial neural network to fit the intermediate level, irrespective of the linearity without altering the significant contributions of other non-clustering design variables. The independent variables are clustered based on the structural decomposition given by the structural hierarchy of the studied system. This inline with the research aim presented in the introduction. Generating new, clustered, variables inferred from the observed design variables is challenging, and adding the element of relationship exploration without losing the significant contributions of other design variables serves to confound the process even further.
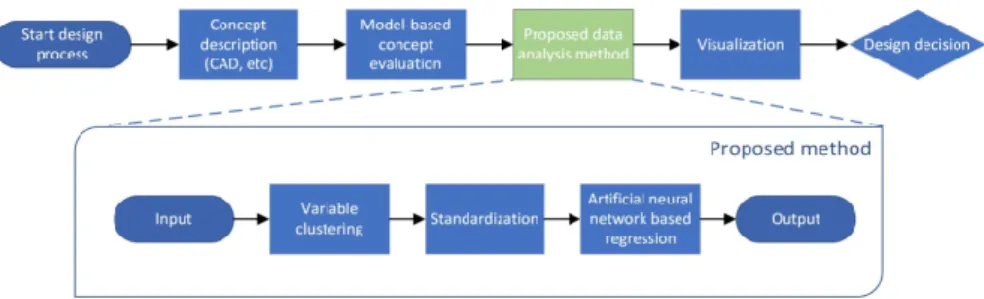
Figure 1 depicts an overview of the proposed method, schematically also showing its role in the concept evaluation process. In the proposed method, data is initially analyzed to identify the continuous and categorical variables. A subset of design variables, according to the structural hierarchy, are clustered and each design variable forms a node in the input layer of the designed artificial neural network. The network has a single output node with clustered variable constructs. Exploration of the neural networks layer weights reveals the contributions of design variables on the design attribute [14]. Design variables and design attributes are normally of different metric units. In this work, they are standardized to scale down all the variables to a common metric scale. Standardization reduces the mean value of the variables to “0” and their standard deviation to “1”, aligning all the variables, distributed normally, on the same scale. This helps to understand the contributions of design variables on a design attribute when they have different metric units [15]. An artificial neural network with designated nodes based on the number of design variables and a predetermined number of hidden layers is employed to understand the cause-and-effect relationships for the desired hierarchical levels or between desired design variables and a design attribute.
Fig. 1. Overview of the proposed method.
2.1 Artificial Neural Networks
An artificial neural network is a mathematical and computational model that simulates the human brain functions of perception, computation, and memory. The ability of neural networks to learn, and generalize from the input data makes them a powerful tool to solve numerous real-world applications [16]. An artificial neural network is a system consisting of processing elements namely nodes in each layer with connections (Synapse) between them. Its inherently nonlinear structure is particularly useful in exploring complex relationships of real-world problems. Artificial neural networks learn from the data through iterations without any prior knowledge, capable of handling data with noisy, linear, and non-linear relationships [17].
In the studied system, the architecture of the artificial neural network is charac-terized by a single input layer, a single hidden layer with a non-linear activation
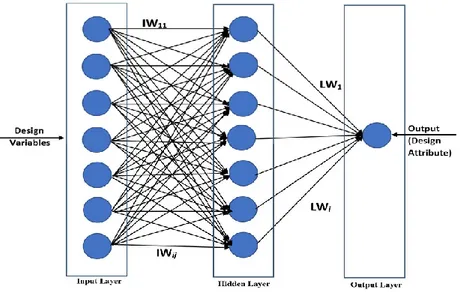
function, and a single output layer. A multi-layer perceptron, also referred to as a feedforward network is employed featuring supervised learning. The network maps a set of inputs, design variables, onto a design attribute linking through the hidden layer. The neural network is depicted in figure 2. The input layer is a set of neurons with design variables and the output layer contains a single neuron with a design attribute. IW and LW are the weights associated with the input-hidden layer and hidden-output layer respectively.
The adapted neural network is described [18], according to equation (1):
= (∑ ∗ ∑ ∗ + ( ) + ( ))
(1)
Where y is the design attribute; and indicate the weights connecting the input layer with hidden layer, and hidden layer with output layer respectively; h is the total number of hidden layer neurons; d is the number of input layer neurons;
( )
and ( ) are the biases for the hidden neuron and the output neuron. finner is a hyperbolic tangent sigmoid activation function. A hyperbolic tangent sigmoid trans-fer function is given by equation (2):
(n) = ( (
∗ )) (2)
Network weights are identified using the following iterative method [19], ac-cording to equation (3) & (4):
{ } = { } −
{ }({ } ) (3)
= ∑ { − } (4)
Where is the actual output value; is the estimated value; and n is the index of the training data.
A Levenberg-Marquart algorithm is employed to train the adapted network, as the algorithm combines the benefits of gradient descent and gauss-newton methods and it speeds up the convergence rate [20]. The algorithm trains the neural network, as long as the weights, net inputs, and transfer functions have a derivative function. According to [21], the connection weights method proved to be better compared to other variable contribution methods such as the step-wise method, profile method, and perturb method. Connection weights method make use of the weight vectors IW and LW in determining the design variables contributions (RI) to the design attribute [22], according to the equation (6):
( , )=
( ( , )) ∗|( )|
= ∑∑∑ ( , )
( , ) (6)
Where h is the total number of neurons in the hidden layers; and n is the total number of neurons in the input layer.
Fig. 2. Artificial neural network architecture.
2.2 Variable Clustering
Design variables clustering involves constructing latent variables, inferred from the observed design variables. In the studied system, design variables are clustered ac-cording to the referenced structural hierarchy. Each design variable to be clustered is expressed as a product of two matrices with weights for each variable value and original data with a rotated co-ordinated system, according to the equation (7).
= [ ] × (7)
Where [w] is the weight matrix of the design variable; and Z is the rotated coor-dinated system matrix.
The rotated matrix is analyzed to estimate the variance (v) of the rotated matrix. Clustered variables are identified as a sum of the product of total variance of the rotated matrix with the rotated matrix of associated design variables to be clustered, according to the equation (8):
Where Xnew is the new clustered variable in the intermediate hierarchy level, ac-cording to variable hierarchy; Vi is the total variance of the rotated matrix of the ith design variable, and; n is the number of variables to be clustered.
3 Case Study
To exemplify the proposed method, it was used to analyse an existing dataset orig-inating from a design exploration study evaluating proposed concepts of road con-struction equipment. In the study, 700 variants of the vehicle platform were studied. Variants driven by seven design variables and 16 design attributes were assessed. The dataset is divided into two sets with 70% of data for the artificial neural network process and 30% for testing the derived observations from the proposed method. The adapted neural network divides the input data into three sets; training, valida-tion, and testing sets, with 70% of input data going to the training set.
A Value-Driven Design (VDD) approach was applied in the design experiment as Systems Engineering (SE) research has stressed the importance of the value model to frontload engineering design activities [23]. This model is expressed as a single objective function that aims at measuring the “goodness” of the design. More information on how this dataset is generated and the applied modelling and simula-tion scheme can be found in [24]. The model-based experimentasimula-tion relies on a hy-brid model environment evaluating both performance and resource space. The value model was fed with the output of these models to render a value score for the design configuration under analysis. All aspects of value were quantified in monetary terms, enabling easy trade-off with more traditional requirements. This quantifica-tion process was based on the implementaquantifica-tion of Net Present Value (NPV) from the VDD literature [25]. The dataset also contained information enabling mapping each design variable directly to components or subsystems in the structural hierarchy.
The studied dataset contained three categorical variables rendering nonlinear be-haviour. These variables were transformed into continuous variables, generating dummy variables equal to the number of classes in a categorical variable [26]. Dummy variables are continuous variables with logical values representing sub-groups of the categorical variable. The model was custom trained to distinguish between categorical and continuous variables and transforming all categorical var-iables to continuous varvar-iables.
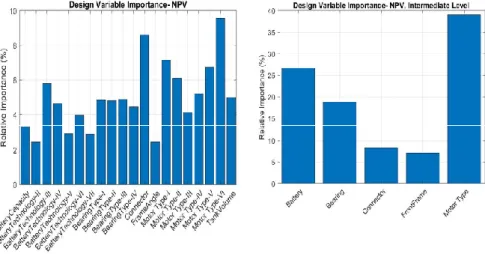
To exemplify the method, NPV was chosen as a design attribute, and the relative importance of the continuous design variables was assessed. The relative im-portance values could be used to understand the cause-and-effect proposition on the magnitude scale, where it represents the relative change in the design variables for a unit change in the design attribute value. The relative importance of the design variables for the design attribute “NPV” is shown in the left part of figure 3. The design variables were clustered according to the structural hierarchy, rendering an intermediate level with five clustered design variables. At this stage, these five var-iables are interpretable as subsystems or components of the studied system. The
contributions of the clustered design variables are shown in the right part of figure 3. The non-clustered variable “connector” has a contribution value of 8.6 both in the left and right part of figure 3, indicating that the significance of the non-clustered variable remains the same.
The mathematical equation framing design attribute from design variables, ac-cording to equation (1) is a nonlinear function, thereby the proportionality is also a nonlinear function. The cause-and-effect relationship between a specific design var-iable and the design attribute was analysed by varying the value of a design varvar-iable while keeping all other design variables constant. This method of estimation is cum-bersome, as the artificial neural networks popularly referred to as “black box” [16], does not provide a direct method to estimate the variable contribution with magni-tude and direction directly.
Fig. 3. Variable importance.
Statistical analysis technique, co-efficient of determination (R2) was used for
methodology validation. It determines how close the predicted data matches the original data, according to the equation (9) [27].
= 1 − ∑( )
∑( ) (9)
where y represents the actual data values; Y is the predicted (estimated) data val-ues; and is the mean value of y.
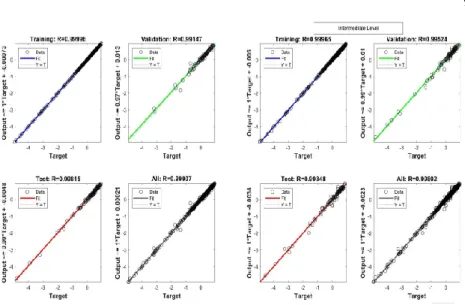
Figure 4 shows visualization of the goodness of fit for the NPV design attribute based on the proposed neural network architecture.
Fig. 4. Artificial neural network regression plot.
The value of the regression coefficient of determination ranges from [0,1]. As the value of R2 approaches unity, the predicted values are equal to the actual data
values, i.e., the closer the value of R2 to 1, the greater is the fit of the data, and the
closer the value of R2 to 0, the poorer is the fit of the data. For NPV, R2 tends out to
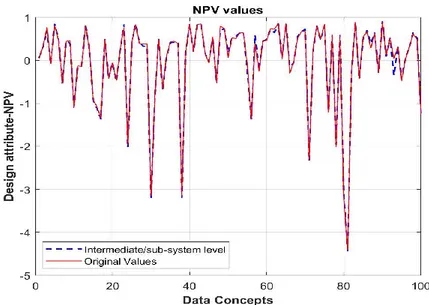
be 0.9990, in comparison coefficient of determination of assessed attributes are 0.98 and above. Clustered variables were derived from a set of observed design variables, thereby an indirect method was used for validation of intermediate level. Figure 5 shows the predictive capability of the derived neural network model using 30% of the unused design attribute (NPV) data both at the intermediate level and component level. Root mean square error (RMSE) and average relative error (RE) measures the deviation of the predicted values from actual observed values. Prediction of unused design attribute values, along with RMSE and RE, according to equation (10) and (11), [15] validates the methodology.
= ∑ ( − ) (10)
= (11)
Where y represents actual data values; and Y represents predicted data values. At the intermediate level, RMSE for the estimated design attribute tends out to be 0.0026 and average relative error of 0.0033, similarly, at the component level, RMSE for the design attribute tends to be 0.0023 and average relative error of 0.0029.
Fig. 5. Estimated data vs Observed data.
4 Discussion and Conclusion
An artificial neural network-based data analysis method that clusters and aggregates the effects of multiple design variables in a study is presented. The proposed artifi-cial neural network is trained using the Levenberg-Marquart algorithm, with 70% input data as training data. The method focuses on the exploration of cause-and-effect analysis providing a structured input to a visualization construct. The inten-tion is to generate an intermediate level and map the analysed data based on the structural hierarchy of the proposed concept.
The proposed method is based on artificial neural networks and matrix decom-position for variable clustering, generating an intermediate level in the structural hierarchy, thereby reducing the dimensionality of the data and hence decrease in computational complexity compared to the original data. The proposed method en-sures that the significances of the variable contribution of the non-clustered design variables are not lost during the experimentation. The goodness of fit measure in the intermediate level reveals that the adapted neural network model closely fits the data, with clustered variable preserving the original information of the design able. The proposed method extends the predictive range of linear relationship vari-able modelling, and the model is trained to solve complex data, overcoming the assumptions in [7]. The proposed method has no limitation to the number of varia-bles, and the intermediate level analysis supports in reducing the computational re-sources and time compared to the computation of all design variables
The method is exemplified through a case study including visualisation of cause-and-effect relationships by bar graphs of the studied concept. Applying a validation scheme based on the coefficient-of-determination, testing of non-trained data, RMSE, and relative error, it is shown that the data structure using a "virtual" inter-mediate level performs, considering the non-linearities in the original dataset, com-parably to the original dataset when it comes to predicting attributes. Future works aim to extend the proposed method by implementing a cascaded network for clus-tering based on unsupervised learning and comparing it with other aggregating var-iable methods such as the Karhunen-Loeve method.
Acknowledgments
The research leading to these results has received financial support by the Swe-dish Knowledge and Competence Development Foundation (Stiftelsen för kun-skaps- och kompetensutveckling) through the Model Driven Development and De-cision Support research profile at Blekinge Institute of Technology.
References
[1] Z. Zhang, L. Gong, Y. Jin, J. Xie, and J. Hao, ‘A quantitative approach to design alternative evaluation based on data-driven performance prediction’, Adv. Eng. Inform., vol. 32, pp. 52–65, Apr. 2017, doi: 10.1016/j.aei.2016.12.009.
[2] H. Komoto and K. Masui, ‘Classification of design parameters with system modeling and simulation techniques’, CIRP Ann., vol. 63, no. 1, pp. 193–196, 2014, doi: 10.1016/j.cirp.2014.03.098.
[3] C. McComb, J. Cagan, and K. Kotovsky, ‘Rolling with the punches: An examination of team performance in a design task subject to drastic changes’, Des. Stud., vol. 36, pp. 99– 121, Jan. 2015, doi: 10.1016/j.destud.2014.10.001.
[4] E. Sundin, G. Ö. Sandström, M. Lindahl, A. Ö. Rönnbäck, T. Sakao, and T. C. Larsson, ‘Challenges for Industrial Product/Service Systems: Experiences from a learning network of large companies’, p. 7.
[5] D. Van Horn, A. Olewnik, and K. Lewis, ‘Design Analytics: Capturing, Understanding, and Meeting Customer Needs Using Big Data’, in Volume 7: 9th International Conference on Design Education; 24th International Conference on Design Theory and Methodology, Chicago, Illinois, USA, Aug. 2012, pp. 863–875, doi: 10.1115/DETC2012-71038. [6] U. Bititci and S. Nudurupati, ‘Driving continuous improvement’, Manuf. Eng., vol. 81, no.
5, pp. 230–235, Oct. 2002, doi: 10.1049/me:20020506.
[7] J. Wall, O. K. Aeddula, and T. Larsson, ‘Data Analysis Method Supporting Cause and Effect Studies in Product-Service System Development’, Proc. Des. Soc. Des. Conf., vol. 1, pp. 461–470, May 2020, doi: 10.1017/dsd.2020.123.
[8] J. F. Hair, Ed., Multivariate data analysis with readings, 4th ed. Englewood Cliffs, N.J: Prentice Hall, 1995.
[9] J. D. Jobson, ‘Multiple Linear Regression’, in Applied Multivariate Data Analysis, New York, NY: Springer New York, 1991, pp. 219–398.
[10] J. B. Tenenbaum, ‘A Global Geometric Framework for Nonlinear Dimensionality Reduc-tion’, Science, vol. 290, no. 5500, pp. 2319–2323, Dec. 2000, doi: 10.1126/sci-ence.290.5500.2319.
[11] S. S. Haykin, Neural networks: a comprehensive foundation, 2nd ed. Upper Saddle River, N.J: Prentice Hall, 1999.
[12] K. G. Grunert, ‘Attributes, attribute values and their characteristics: A unifying approach and an example involving a complex household investment’, J. Econ. Psychol., vol. 10, no. 2, pp. 229–251, Jun. 1989, doi: 10.1016/0167-4870(89)90021-4.
[13] Understanding Regression Analysis. Boston, MA: Springer US, 1997.
[14] J. D. Olden and D. A. Jackson, ‘Illuminating the “black box”: a randomization approach for understanding variable contributions in artificial neural networks’, Ecol. Model., vol. 154, no. 1–2, pp. 135–150, Aug. 2002, doi: 10.1016/S0304-3800(02)00064-9.
[15] J. L. Devore, Probability and statistics for engineering and the sciences, Eighth edition. Boston, MA: Brooks/Cole, Cengage Learning, 2012.
[16] M. H. Hassoun, Fundamentals of artificial neural networks. Cambridge, Mass: MIT Press, 1995.
[17] D. R. Baughman and Y. A. Liu, Neural networks in bioprocessing and chemical engineer-ing. San Diego: Academic Press, 1995.
[18] C. M. Bishop, Neural networks for pattern recognition. Oxford : New York: Clarendon Press ; Oxford University Press, 1995.
[19] T. Marwala and SpringerLink (Online service), Artificial Intelligence Techniques for Ra-tional Decision Making. Cham: Springer InternaRa-tional Publishing : Imprint : Springer, 2014.
[20] H. P. Gavin, ‘The Levenberg-Marquardt method for nonlinear least squares curve-fitting problems c ©’, 2013.
[21] J. D. Olden, M. K. Joy, and R. G. Death, ‘An accurate comparison of methods for quanti-fying variable importance in artificial neural networks using simulated data’, Ecol. Model., vol. 178, no. 3–4, pp. 389–397, Nov. 2004, doi: 10.1016/j.ecolmodel.2004.03.013. [22] M. Gevrey, I. Dimopoulos, and S. Lek, ‘Review and comparison of methods to study the
contribution of variables in artificial neural network models’, Ecol. Model., vol. 160, no. 3, pp. 249–264, Feb. 2003, doi: 10.1016/S0304-3800(02)00257-0.
[23] P. D. Collopy and P. M. Hollingsworth, ‘Value-Driven Design’, J. Aircr., vol. 48, no. 3, pp. 749–759, May 2011, doi: 10.2514/1.C000311.
[24] M. Bertoni, G. Pezzotta, B. Scandella, J. Wall, and P. Jonsson, ‘Life cycle simulation to support cross-disciplinary decision making in early PSS design’, Procedia CIRP, vol. 83, pp. 260–265, 2019, doi: 10.1016/j.procir.2019.03.138.
[25] M. Price, D. Soban, C. Mullan, J. Butterfield, and A. Murphy, ‘A novel method to enable trade-offs across the whole product life of an aircraft using value driven design’, J. Aerosp. Oper., vol. 1, no. 4, pp. 359–375, 2012, doi: 10.3233/AOP-120028.
[26] P. S. L. Yip and E. W. K. Tsang, ‘Interpreting dummy variables and their interaction effects in strategy research’, Strateg. Organ., vol. 5, no. 1, pp. 13–30, Feb. 2007, doi: 10.1177/1476127006073512.
[27] J.-R. Kurz-Kim and M. Loretan, ‘A Note on the Coefficient of Determination in Models with Infinite Variance Variables’, SSRN Electron. J., 2007, doi: 10.2139/ssrn.996664.