http://www.diva-portal.org
This is the published version of a paper published in JASSS: Journal of Artificial Societies and Social
Simulation.
Citation for the original published paper (version of record):
Bagley, M J. (2017)
A simulation of entrepreneurial spawning.
JASSS: Journal of Artificial Societies and Social Simulation, 20(3): 9
https://doi.org/10.18564/jasss.3444
Access to the published version may require subscription.
N.B. When citing this work, cite the original published paper.
Open Access
Permanent link to this version:
A Simulation of Entrepreneurial Spawning
Mark J. O. Bagley
11International Business School, Jönköping University, Gjuterigatan 5, Jönköping, 551 11, Sweden
Correspondence should be addressed to mark.bagley@ju.se Journal of Artificial Societies and Social Simulation 20(3) 9, 2017 Doi: 10.18564/jasss.3444 Url: http://jasss.soc.surrey.ac.uk/20/3/9.html Received: 01-07-2016 Accepted: 23-03-2017 Published: 30-06-2017
Abstract:This paper describes how patterns of industrial clustering arise with respect to the size of an initial firm when measured in terms of innovation. Through principles of evolutionary economics, the aim of this pa-per is to examine the ’birth’ of industrial clusters. We take an endogenous and supply-side approach, where firms in a region spawn from incumbents. Technology is qualitatively described using a code set mapped on a cognitive space. Assuming inheritability of networking skills, we seek to model how the size of an initial firm influences future patterns of cluster formation through a model of technical cognition and a mimicking of cre-ativity. It is found that initial firm size has a lasting impact on clustering patterns through its influence on the level of cognitive distance of the underlying agents. The model replicates the stylised facts of entrepreneurial cluster formation.
Keywords:Industrial Clusters, Spin-Offs, Schumpeter, Evolutionary Economic Geography, Technological Change
Introduction
1.1 The traditional paradigm of agglomeration economies expanding on Marshall (1920) and Jacobs (1969) focusses on firms choosing to move or locate alongside similar businesses to benefit from knowledge spillovers, special-ized infrastructure and economies of scale. However, more recent models have taken an evolutionary approach to analyzing industrial cluster formation. Specifically, industrial clusters arise as a result of spoffs from in-cumbent firms. The geographic clustering of firms of similar industry as a result of entrepreneurial spawning is a well-documented phenomenon. Klepper (2011) sums up three empirical regularities that link entrepreneurial spawning with industrial clusters. First, there is a performance premium of spoffs starting in the same in-dustry as the parent firm. Entrepreneurs ’inherit’ the knowledge and routines of their former workplaces and deploy these attributes to the newly established firm. Second, there is a premium for locating a spin-off in the same region as the parent firm. Entrepreneurs have little incentive to relocate to a new area when they have al-ready established geographically-bounded networks and ties. Finally, the birth of industrial clusters coincides with new technologies and the evolutionary branching of a given industry.
1.2 This paper will adhere to these concepts of inheritance and evolutionary branching and will describe how ex-isting industry structure in a region conditions spawning patterns using a highly-simplified model of technical cognition. To understand the birth of clusters, we seek to explore what role industry structure plays in cluster formation. If industrial clustering patterns are indeed a result of entrepreneurial spawning, then the specific patterns of industrial clusters could arise from the characteristics of the entrepreneurs themselves, which in turn may arise from the industrial environments they have been exposed to. Firms of different sizes require different skill sets; the resources needed to run a large firm are not necessarily the same as those of a smaller firm. Furthermore, different sized firms may attract different types of workers; more ’ambitious’ workers may wish to seek employment with a larger firm given the long-term promotion prospects they offer. Conversely, smaller firms offer a narrower industrial focus and potentially provide experience with small, newly established firms.
1.3 Empirical studies have examined the link between spin-offs1and their parent firms. Smaller firms tend to spawn
more often, however these spin-offs tend to be of lesser quality when measured in profitability or size. Likewise, larger firms tend to spawn less frequently, but spin-offs tend to be of higher quality2. Past studies have found
a variety of factors that have an impact on this pattern, namely; disagreements between the innovator and the firm, imperfect information on innovative employees, product scope and focus, and self-selection. What remains is whether spin-off patterns can be explained by market structure, the amount of knowledge, and net-working. Can we explain clustering behaviour as a product of cognition of various actors? This paper adheres to the view that industrial clusters are a result of the level of technical cognition within the system, and this level of cognition is a function of the initial condition, i.e. the initial size of the de novo firm.
1.4 Frenken & Boschma (2007) expand on previous studies of path dependence Simon (1955); David (1985); Arthur (1989) by viewing economic development as an evolutionary branching process of product innovations, while overcoming the problematic issues of using spatial entities as the unit of analysis. The unit of analysis is instead the firm, and the existing variety within firms and cities provide the scope of innovation that leads to an evo-lutionary process of economic growth. A set of probabilistic organizational parameters describe the branching process which in turn is a product of incremental and radical innovations. The parameters measure the likeli-hood that an entrepreneur will cultivate a new idea in her current firm, an alternative firm, or as a new firm in the form of a spin-off. Given a firm and city of a certain size, organizational parameters adjust through a sys-tem of positive and negative feedback loops. As first modelled by Simon (1955), the organizational parameters produce a Zipf’s law for both the firm and city size distribution. According to a set of exogenous factors, as-sumptions of entrepreneurial motivations and actions lead to an explanation of clustering patterns, and these actions in turn contribute to the evolution of future entrepreneurial decisions.
1.5 This paper will extend Frenken & Boschma (2007) model by using ideas and knowledge as the unit of analysis. By adhering to the simplicity of Frenken & Boschma (2007) model, we contextualize the presence of specific resources, which is knowledge and ideas. By doing so, we address the aforementioned assumptions by mod-elling spin-offs as a manifestation of knowledge and ideas, shaped at the firm level. We may therefore consider how industrial conditions influence the branching process of product innovations.
1.6 We employ an abstract computational model that allows us to model concepts (in this case knowledge and ideas) that are somewhat immeasurable in the real world. The context of analysis is not employees, inventors or entrepreneurs. Rather, such entities act as vectors that conceptualize knowledge and ideas through Schum-peterian motivations. Knowledge and ideas are unique and are the primary focus and means of measurement in this paper. Each firm in the system carries one or more of these ideas that can be represented within what is called a cognitive space (explained below). We use the presumption that new ideas are a function of existing ideas. These ideas interact with each other and combine to form new ideas. The ability for one idea to interact with another is bounded by its cognitive reach, which in turn is a function of the size of a firm’s parent firm at the time of spin-off. Furthermore, a new idea may lead to the spawning of a new spin-off firm if such an idea fails to fit in within the old firm’s existing knowledge set. Due to series of factors, a firm’s knowledge set (which expands as a firm grows) is often a function of the size of the firm’s parent firm. Finally, we also assume that an entrepreneur has knowledge of her parent firm’s idea set. We use stylised facts of spin-off patterns as a guideline for model validation.
1.7 Thus, while defining smaller firms as having a smaller knowledge set, such firms are less likely to grow as they have fewer existing ideas to combine. However, if a smaller firm originated as a spin-off from a large firm, this may not be the case. Such spin-offs may inherit the networking abilities of the parent firm as well as utilizing the parent firm’s knowledge set. The founders of such small firms, who typically originate from senior management from the parent firm, facilitate these characteristics. Firms also inherit long-term growth strategies through this manner. Thus, initial market structure has a path-dependent impact on the pattern of industrial spawning.
1.8 In the following section, we provide a framework that links firms, entrepreneurs and knowledge, thereby explor-ing the differences of how incremental and radical innovations arise. We then introduce the model by transfer-ring these concepts to a formal model by introducing the cognitive space and how firms and entrepreneurs, acting as vectors for knowledge and ideas, behave within this space. As a test for validation, we then compare the results of this simulation to the stylised facts of entrepreneurial spawning patterns with respect to the size of the incumbent firm. Finally, we use the model’s results as an explanation behind Zipf’s law, that is, the con-straints of a firm’s own knowledge lead to the rank-size distribution of firms observed in the real world. The ultimate section concludes.
A Model of Entrepreneurial Spawning
Firms, entrepreneurs, and knowledge
2.1 The relationship between firms and their subsequent spin-offs reflects the characteristics of the firms them-selves3. Klepper & Sleeper (2005) use the notion that parent firms "give birth" to spin-offs, who in turn inherit a set of traits. In this case these traits may be thought of as knowledge and ideas. In a sense, it is the qualities of a parent that is of relevance to the study of spin-offs. Spin-offs inherit knowledge of their parents’ product focus and production routines. However, although offspring do take many of their attributes from their parents, they do have certain characteristics that differentiate them from their predecessors. To use an evolutionary anal-ogy, the increasing fitness of a species is not only the result of the combinations and recombinations of genetic material, but also a function of new genetic identities in the form of mutations.
2.2 An assumption of the model in this paper is that these spin-offs are a result of the "Schumpeterian entrepreneur", a rare and radical idea generator who in turn opens a new market landscape. Provided the radical idea is per-ceived to be profitable (either directly or indirectly), the entrepreneur will leave her firm and establish a new one. Thus, a computational model is useful when analysing industrial clusters as it considers the heteroge-neous nature of the initial conditions of market structure. New firms spawn from existing firms when agents happen upon an idea that is perceived as innovative, and this perception of innovativeness is a function of both the profoundness and quality of the new idea. Furthermore, this measure of perception is a function of the ac-tors’ existing knowledge set, which is bounded by the entrepreneur’s own exposure to ideas already present in her own Weltanschauung, or world-view, which is in turn bounded by her position in the cognitive field. New ideas are therefore products of old ones, a pattern often seen. Take, for example, the printing press, which did not arise out of ’thin air’ but was instead a combination of existing technologies, catalysed by the skill of the inventor. The basic mechanism of the printing press was taken from the existing wine press and the develop-ment of oil-based ink. Gutenberg, who had a background as a goldsmith, improved upon existing type-setting technologies while combining these existing technologies. The mechanization of paper manufacture as well as the switch from scrolls to codex provided the motivation of invention. The printing press in turn eased the spread of ideas, leading to the enlightenment, which in turn led to the birth of further new ideas and so on4. 2.3 Thus, the innovation potential of a firm is bound by the firm’s internal and external knowledge set. Antonelli
(2010, p. 165), expanding on work by Patrucco (2009), maintains that firms must rely on knowledge explo-ration strategies to innovate in the long-term, and "only when a firm is able to fully coordinate learning and research activities conducted within its boundaries with the relevant sources of external knowledge, both tacit and codified, can new knowledge be successfully generated". However, not all firms are bound by the same knowledge-search curve. Spin-offs traditionally arise from an entrepreneur with a history of experience and/or senior management in another firm (Andersson & Klepper 2013; Klepper & Sleeper 2005). One can assume that such individuals have varying levels of expertise of firm coordination and product knowledge, as well as con-trasting sizes of networks and networking ability. This variation in expertise is a function of the entrepreneur’s employment history. Entrepreneurs originating from larger firms tend to have larger networks (especially with her former firm), a greater knowledge set of ideas, and grander aspirations of future firm size.
2.4 A new idea, if radical enough, could in turn lead to the formation of a new firm; due in part to the entrepreneur’s perception of future profits, as well as the failure for the new idea’s ability to fit into the parent firm’s existing routine and cognitive set. In the context of this model, therefore, new firms are a product of the ’Schumpeterian entrepreneur’, a rare and radical idea generator:
"It is the entrepreneur who carries out new combinations, who leads the means of production into new channels" . . . "He also leads in a sense that he draws other producers in his branch after him. But as they are his competitors, who first reduce and then annihilate his profit, this is, as it were, leadership against one’s own will" (Schumpeter 1934, p. 89)
2.5 Dahlman et al. (1987), Kim (1980) and Lall (1992) outline the sensitivity of local conditions, in terms of the avail-ability of knowledge, on future development possibilities. The current model captures these effects by means of setting up these local conditions as the model’s initial environment. A region with one large firm as an initial condition will thus lead to a market structure radically different to one that begins with many small firms, given the heterogeneous and heuristic nature of the actors as outlined above.
The cognitive space
2.6 Real-world analysis is limited due to an immeasurable world. Solé et al. (2014) discuss the difficulties in studying technological change due to the lack of a genome mapping for various designs, as well as the complex nature of how these designs evolved and came into being. Given the level of abstraction in this model, a computational simulation presents a suitable choice as qualitative concepts can be difficult to measure. Thus, we introduce a measurable artificial world that serves as a proxy to understand real-world behaviour. This artificial world is the cognitive space, a concept we use to understand the different spawning patterns of small and large firms. To use the definition by Nooteboom et al. (2007, p. 1017), "Cognition denotes a broad range of mental activity, including proprioception, perception, sense making, categorization, inference, value judgements, emotions, and feelings, which all build upon each other". In the context of this paper, the cognitive space encapsulates this definition by providing a measurable playing ground for actors within the model.
2.7 A summary of the concepts defined in this section may be found in Table 1. We start the model by assuming one city-sized geographic area, where all firms locate. This eliminates the need to consider geographic proximity in the model, and to focus on cognitive aspects alone. Consider a piece of knowledge, idea or technology, which in this paper will be captured as a ken5. A ken is an abstract concept that may be interpreted as ’an element of knowledge’. Although technologies may be represented as a ken (or a combination of kens), not all kens are necessarily technologies. This ken comprises of several characteristics that give the ken its purpose. These characteristics add up to express a ken’s phenotype6, or its set of observable traits. To simplify, assume that all
kens lie in a three-dimensional vector-space, i.e. the cognitive space of the system. The phenotype of ken i may be expressed as:
ki= (p1i, p2i, p3i), ki∈ D, D ⊆ R3 (1)
where p1i, p2iand p3iâĂĽ combine to represent the phenotype of ken ki, which lies in the cognitive space7D.
Here, p1i, p2iand p3iare coordinates in the three-dimensional cognitive space. This allows for a measure for
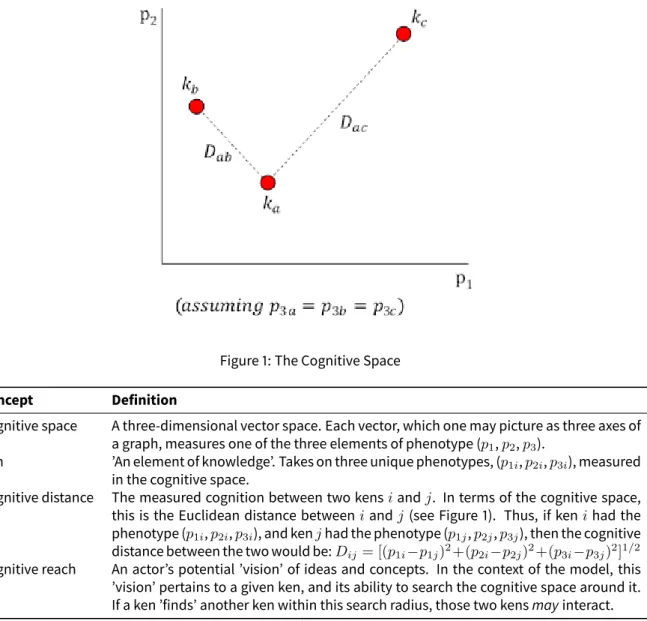
which kens qualitatively differ from one another. Thus, the cognitive space coincides with a technological one. Figure 1 illustrates this in terms of a two-dimensional context.
2.8 The cognitive space is infinite, meaning that there is an unlimited number of phenotypes possible. The cognitive distance, Dijof a pair of kens i and j is the cognition, D, between them and measured in a Euclidian manner. We
may view the cognitive distance as the relatedness of two kens, i and j, interpreted by a set of heuristic players, which may include firms and individuals. In Figure 1, with three kens ka, kband kc; Dab < Dac. Therefore,
kaand kc are more ’related’ to each other, in a cognitive sense, than ka and kb. Nooteboom et al. (2007, p.
1017) interprets cognitive distance as a shared ’interpretation system’ where "labor needs to share certain basic perceptions and values to sufficiently align their competencies and motives". In this case, cognitive distance measures the difference between two specific kens, and firms and individuals serve as the vectors for those kens.
2.9 Whereas the cognitive distance simply measures the level of cognition between two kens, this does not tell us their ability to ’interact’. The emergence of a new ken originates with the interaction of two existing kens, facilitated by the innovative behaviour of firms. This interaction is governed by the cognitive reach of that actor, Ri, or the actor’s potential ’vision’ of ideas and concepts8. The specific cognitive reach of each actor in period t
is imposed by a general Gompertz probability distribution with a shape parameter of 1 and a scale parameter r: Rit∼ f (r; D) = rerDe1−e
rD
(2)
2.10 Thus, the probability9of an interaction between kens i and j depends on r. The Gompertz distribution is chosen as it allows for a certain degree of comparatively high cognitive reach up until a certain point, until which it drops off to lower levels of probability10. With higher levels of r, the Gompertz distribution becomes ’squeezed’ and
therefore potential cognitive reach becomes limited to closer kens. Thus, increasing and decreasing r leads to a lower and higher cognitive reach. We assume that actors have a generally good knowledge of similar ideas, but this knowledge falls off dramatically after a certain point. Therefore, two kens may interact if the following condition is satisfied:
Rit≥ Dij (3)
2.11 Thus, the cognitive reach of one ken must be greater than or equal to the cognitive distance of the pair. Time in the model is measured in discrete units. In each time period, all kens establish a cognitive reach according to Equation 2 and, if meeting the condition in Equation 3, establishes a link with one other ken only. Thus,
Figure 1: The Cognitive Space
Concept Definition
Cognitive space A three-dimensional vector space. Each vector, which one may picture as three axes of a graph, measures one of the three elements of phenotype (p1, p2, p3).
Ken ’An element of knowledge’. Takes on three unique phenotypes, (p1i, p2i, p3i), measured
in the cognitive space.
Cognitive distance The measured cognition between two kens i and j. In terms of the cognitive space, this is the Euclidean distance between i and j (see Figure 1). Thus, if ken i had the phenotype (p1i, p2i, p3i), and ken j had the phenotype (p1j, p2j, p3j), then the cognitive
distance between the two would be: Dij= [(p1i−p1j)2+(p2i−p2j)2+(p3i−p3j)2]1/2
Cognitive reach An actor’s potential ’vision’ of ideas and concepts. In the context of the model, this ’vision’ pertains to a given ken, and its ability to search the cognitive space around it. If a ken ’finds’ another ken within this search radius, those two kens may interact.
Table 1: Summary of key concepts
outgoing links are limited to a maximum of one per ken. The number of incoming links per ken, however, is potentially infinite.
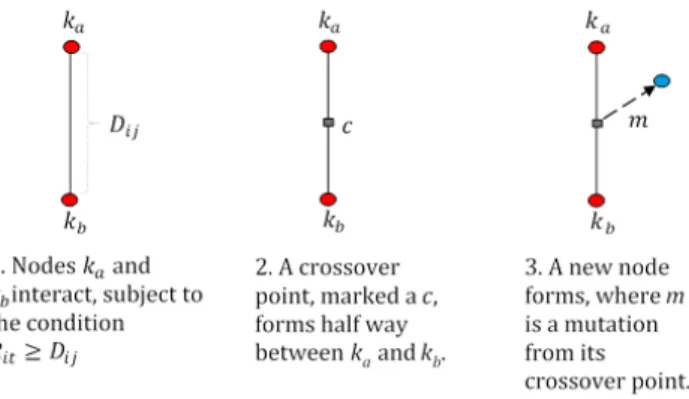
2.12 Upon the interaction of two kens, a third ken generates through both a crossover and mutation process. The mutation may be understood as the level of creativity employed during the birth of the third ken. For simplicity as well as to conserve computing power, a crossover (which in a biological framework is simply the recombina-tion of two phenotypes) is the halfway point of two kens. The mutarecombina-tion, which is the deviarecombina-tion from the point of crossover, is a function of the cognitive distance of the two. The mutation process may be seen in Figure 2. Mutation may be thought of as an accident, or a spurt of creativity.
2.13 The new ken is ’born’ and the specific point is a random distance with a probability imposed by a Gompertz distribution with a scale parameter Dij, as seen in Figure 2 and Equation 4.
m ∼ f (Dij; D) = DijeDijDe1−e
Dij D
(4) We put forward this constraint as any further deviation outside this limit would entail a level of creativity that is outside the influence of the two kens that influence that level.
Rule No. 1: If two kens, i and j, interact, a third ken is born, and the specific location of the third
Figure 2: The Crossover and Mutation Process
System behaviour
2.14 Schumpeter (1934, p. 65) describes the underlying mechanics of economic growth as "The spontaneous and discontinuous changes in the channel of the circular flow. . . the producer who as a rule initiates economic change, and consumers are educated by him if necessary. They are, as it were, taught to want new things, or things which differ in some respect or other from those which they have been in the habit of using. . . To produce other things, or the same thing by a different method, means to combine these materials and forces differently". There are five cases Schumpeter (1934) identifies where recombination occurs. This includes the introduction of a new good, the introduction of a new method of production, the opening of a new market, the conquest of a new source of supply or raw material and the carrying out of a reorganization of an industry.
2.15 Nooteboom et al. (2007) details the relationship between cognitive distance and innovation performance; as cognitive distance increases, there is an increase in learning by interaction. A ’stimulus’ occurs when people with different knowledge sets interact, which in turn consolidates previously diverse knowledge. This only oc-curs up to a certain point, however. When cognitive distance reaches a certain point, there is an insufficient level of mutual understanding. The relationship between cognitive distance and innovation performance is there-fore U-shaped. Actors, seeking to maximize their innovative potential, must therethere-fore find concepts that are sufficiently new to them, but not so new as to limit their understanding11.
2.16 Arthur (2005) adds to this assertion that new technologies arise from a Darwinian process, which itself is a pro-cess of variation of existing technologies and their subsequent improvement. Furthermore, new technologies are combinations of old ones, even if these new technologies bear little resemblance to the ones they derived from. This is a natural condition. Schumpeter (1934) stresses that any new combination must draw the neces-sary means of production from old combinations. Furthermore Arthur (2005) cites the example of the turbojet, which was a combination of the magnetron (high power output) and the klystron tube, which are both aspects of two very different purposes. Although a solution is sometimes found by systematically seeking out various possibilities, the usual route is often unsystematic and the discovery is accidental. Returning to the example of the printing press, Koestler (1964) points out that Gutenberg, in the process of seeking the ideal mechanism, first turned to traditional methods he was familiar with, such as printing from wood blocks by means of rub-bing and methods for coin-casting, both proving insufficient for means of mass-producing the written word. To solve this problem, Gutenberg had to turn to an entirely different kind of skill. He discovered this by chance, by taking part in a wine harvest. The wine press was used as the eventual element for the invention of the printing press.
2.17 The current model does not make any explicit distinction between incremental and radical innovation. Rad-ical innovation has been defined as something that disrupts or redefines a performance or trajectory (Chris-tensen & Bower 1996), a "radical exploration [that] builds upon distant technology that resides outside the firm", (Rosenkopf & Nerkar 2001, p. 290) or something that "serve[s] as the basis of ’future’ technologies, prod-ucts and services" (Ahuja & Morris Lampert 2001, p. 522). Building upon these viewpoints, this paper defines a radical innovation as the result of a new ken that is considerably different from the existing technology set. Rad-ical innovation is implicit, an indirectly observable change that causes further changes in the system. Although it is more than possible to define a concrete definition or distinction within the model, such a distinction would be ambiguous as radical innovation takes on a range of unbounded and continuous values. For the purpose of understanding this model, therefore, only an implicit distinction is made.
Figure 3: System Behaviour.
Figure 4: Kondratiev and Schumpeterian Growth Curves13.
adjustable parameter in the simulation (the other being global distribution of cognitive reach, dependent on r). Time is discrete, and within each unit of time actors act to produce the next value of nt. As discussed, any
two kens may interact if Rit ≥ Dij. A new ken is generated only if that ken occupies a previously unoccupied
section of the cognitive space. Although the cognitive space is continuous in nature, this is to account for the lack of value of a ken that is too similar to the existing technology set. Thus:
Rule No. 2: All kens must be unique to a part of the cognitive space. This part has an area equal
to one.
2.19 Furthermore, there is no measure for the relative quality of new kens, nor is there a fitness landscape. All ideas are ’good kens’ and worth pursuing. Figure 3 illustrates the system’s behaviour. Given an initial technology set, a radical innovation is born through the interaction of two kens with a relatively large cognitive distance, an extreme mutation, or both, seen in step two. We may consider this ken a radical innovation as its position in the cognitive space is relatively far away from the existing technology set. In time, interaction with the invention born in step two produces a consolidation of the technology set, which are kens that emerge in-between the invention and the rest of the kens. The more radical an innovation, the greater the potential growth of future technology, via means of incremental innovation. The overall effect is a rapid yet temporary increase in the number of kens because of the radical innovation. We may consider the new kens in step three as incremental innovations as they are new to the system but not ’radical’ in the sense that they are already bounded by an existing technology set. The system then enters a steady state until a new radical innovation occurs.
2.20 The result of this behaviour is an S-shaped growth curve, as seen in Figure 4. For illustrative purposes, take for example Kondratiev waves12on the left-hand side of the figure. Radical kens take place at the ’dips’, or inflection
points. After this point, spurts of innovation fill the gap that was created by that radical ken. Eventually, this rate of growth levels off when further incremental ken creation consolidates the gap between the new invention and the original technology set. A new spurt of innovation occurs when there is another eventual radical innovation. This process continues until perpetuity.
Figure 5: Rates of technological growth with different levels of r.
2.21 Schumpeter (1943, p. 83) expanded on these Kondratiev waves by introducing ’creative destruction’, or the "[revolution] of economic structure from within, incessantly destroying the old one, incessantly creating a new one". Furthermore, each wave becomes steeper than the last due to the acceleration of technological advance-ments. Figure 4 illustrates this. The heights of each successive wave in both the Kondratiev and Schumpeter growth curves are equal, denoted by a value of β. However, as each wave in the Kondratiev growth curve is of equal wavelength (measured by α), in the Schumpeter growth curve, wavelengths successively decrease (with each four measured by relative magnitudes α, γ, δ, and θ, with α > γ > δ > θ). A red dotted line traces the inflection points of both growth curves. In the case of Schumpeter (on the right-hand side), this produces a nonlinear line with an exponential nature. This is in contrast with the Kondratiev (on the left-hand side) with each wavelength being equal to α (producing a linear and straight red dotted line).
2.22 Figure 5 illustrates this behaviour by simulating the model at three different values for 1/r; 1.0, 1.5 and 2.0. The simulation is run 10 times for each of these three parameters. All three give the same S-shaped behaviour of technological growth. The increasing rate of growth is a result of the ever-increasing horizon of the technology set. New kens, and especially radical ones, are born most often on the periphery. If this periphery becomes ever-larger, because of the increased number of existing kens on that periphery, the number of potential new kens in the next time period increases. The inflection points of these curves (and thus the probability of inven-tion), however, are less frequent with smaller levels of 1/r. As the cognitive reach of kens increase, so does the technology set’s growth potential. Increasing 1/r further will eventually lead to a ’super-Malthusian’ growth rate, or a finite-time singularity described by Solé et al. (2014). Increasing the potential cognitive reach of kens through 1/r therefore accelerates the advancement of knowledge. Furthermore, the variance of the accumu-lation of knowledge increases at higher levels of 1/r. Lower levels of 1/r (such as when it is set to 1.0) often fail to produce significant knowledge growth. Biggiero & Valente (2016) using Kauffman’s (1993; 1996; 2000) NK model, also reach this conclusion, i.e. a lack of initial knowledge heterogeneity (which may be also understood as quantity in the current model) hinders knowledge growth in industrial clusters.
2.23 This model does not consider the redundancy of old technology, as it is generally assumed that the kens of redundant technology is ever-present and drawn upon by future kens. As time goes on, older kens have less use as a factor for new kens as they become confined deeper into the interior. New combinations make old ones redundant only in the sense that older technologies are not used as frequently as the new.
2.24 The technological growth rates in Figure 5 is largely consistent with our understanding of how ideas evolve. Arts & Veugelers (2014) expands on anecdotal evidence and use patent data to study innovation in biotechnol-ogy. For each patented invention, they were able to identify the search process of previous patents that led to the invention’s design. It was found that new technologies were a result of recombining and revising familiar technologies. However, recombining more familiar technologies typically do not produce novel breakthroughs. Bigger breakthroughs require a deeper technological understanding. The exponential nature of technological growth is due to the ever-increasing periphery of the stock of kens.
Spin-off conditions
2.25 Spin-offs in this model are multi-generational, i.e. a spin-off in one time period may serve as a parent firm in a later time period. The decision to spin-off is a function of the entrepreneur’s own knowledge set of kens, which
may come from her own firm or others. The entrepreneur’s knowledge set, which varies from entrepreneur to entrepreneur, limits her perceived degree of ingenuity of a new idea. Of course, this is a simplification, as one may discover ideas in organizations that are not firms (e.g. family, friends, unions, clubs, etc.). People tend to belong to multiple types of organization at the same time. Indeed, multiple membership is arguably an important property of social systems; allowing ideas, competencies and skills to transcend (Biggiero 2001). This paper, however, does not reject the idea of multiple membership of many types of organization14, although
the model does not deal with it explicitly. Actors draw on at least one ken from their own organization. We use ’firms’ to simplify our discussion. This does not imply that the vectors of ideas do not belong to other types of organization, and it also does not imply that they only seek out new combinations of knowledge directly from other firms. They may arrive at this point via other channels. What the model shows is simply how cognitively proximate two kens are.
2.26 A number of empirical studies examine the entrepreneur’s decision to leave an incumbent firm and establish a spin-off. Hvide (2009) used Norwegian data to analyse a model of interaction between the decision to be-come an entrepreneur and the employer’s motivation to keep the best ideas with the firm. Because larger firms have less information regarding employee quality, wages become less flexible. Therefore, higher quality work-ers are more likely to leave the firm and establish a start-up. Garvin (1983) refwork-ers to employees leaving parent firms out of a result of becoming frustrated with their employers. However, this frustration is due to an idea be-ing rejected. Klepper (2007), found that there was evidence with this frustration in the automotive industry as management tends to be constrained in recognizing employees with higher talent. Tenure, as well as perceived opportunities for future promotion may also have a negative impact on spin-off frequency (Andersson & Klep-per 2013). Tåg et al. (2013) and Elfenbein et al. (2010) found evidence that the decreased amount of hierarchy (measured in terms of the number of layers of management) in smaller firms contributes to the increased level of entrepreneurial spawning. This is presumably due to the increased perception of future opportunities and promotion and their accompanying financial incentives. However, Tåg et al. (2013) were only able to account for one-fifth of entrepreneurial spawning as a result of increased bureaucracy. Other studies focus on firm-level events to explain the frequency of spoff rates. Brittain & Freeman (1986) argue that in the semiconductor in-dustry, firms that were acquired by non-semiconductor firms or those that hired a CEO from outside of the firm were more likely to spawn new firms. Klepper & Sleeper (2005), in their study of the laser industry, found that the probability of firm spawning was related not only to the parent firm’s total experience in producing lasers, but also to the parent’s focus of producing a particular type laser, and not its general experience. Thus, spin-offs were a seen to be a function of not only their parents’ total knowledge of laser production, but also their targeted knowledge. Brittain & Freeman (1986) assume that firms that do not have a primary focus often rotate their employees across different business sectors, which in turn limits their access to the industrial knowledge needed by a prospective entrepreneur. There may also be a self-sorting mechanism with regard to larger firms; ambitious individuals may have a tendency to choose bigger firms at the start of their careers.
2.27 The remaining question concerns how the distribution of knowledge and ideas is linked to the spin-off decision of the entrepreneur. The aforementioned empirical studies rely on observable characteristics of the incumbent firm in relation to the entrepreneur. The next step is to link these observations and apply it to the branching process of product innovation as outlined by Frenken & Boschma (2007). Up until this point we have built a model that addresses the dynamics of technological growth. Now let us use this framework to address firm-level behaviour and the decision to spin-off. We design this part of the model to take into account the empirical observations discussed above. Equation 2 defined the cognitive reach between two kens. This was conditional on a pre-set condition defined as r, the scale parameter of the Gompertz probability distribution. We can ex-pand on this by making r an endogenous condition, determined by the size of a firm. Thus:
1 r =
( log10n0
a, for the first firm, a > 1
log10Lp, for all subsequent firms (at time of spinoff)
(5)
2.28 Where Lpis the size of the parent firm and a is an exogenously given constant15greater than one. This
inheri-tance process assumes that those in control of a new firm inherit the cognitive scope or ’vision’ of the firm she was employed at previously. If this firm is large, the larger cognitive reach of that larger firm reflects the need to ’know’ about the greater variety of various designs, processes and routines. Smaller firms (if they are de novo) have a naturally smaller 1/r due to the lack of need, i.e. a smaller scope or ’vision’ is required for the manage-ment of a smaller quantity of kens. Furthermore, a spin-off takes a value of 1/r that is a function of the size of her parent firm. This is because the entrepreneur brings with her the routines and skills that are applicable for the parent firm. This was verified by Agarwal et al. (2004), who found that an incumbent’s capabilities at the time of spin-off positively affect the entrant’s knowledge capabilities.
Figure 6: The Schumpeterian Condition16.
Rule No. 3: All firms have a value of r that is a function of the size of their parent firms, at the
time of spin-off.
2.29 One condition governs the possibility of a new ken leading to an entrepreneurial spin-off; the Schumpeterian condition. This condition must hold true for a spin-off to occur. As shown in Figure 6, the Schumpeterian condi-tion describes how radical a new ken must be to spawn as a new firm. This condicondi-tion is satisfied for a new ken with the phenotype {pk1, pk2, pk3} by:
pkw≥ µiw+ Sσiw, w = 1, 2, 3 (6)
where, for the parent firm of ken i, σiwis the standard deviations of pi1, pi2and pi3; and µiwthe respective
means. The Schumpeterian multiplier, S, dictates how extreme a new ken needs to be to be considered as an ’outlier’ of the parent firm’s existing knowledge set. The relative threshold for spin-offs differs from firm-to-firm, and depends not only on S but also the scope, focus and size of the parent firm when measured in terms of number of kens, captured by the standard deviational ellipse in Equation 6.
2.30 Furthermore, the spin-off also inherits the Schumpeterian multiplier from the parent firm, which is again de-pendent on the size of the parent firm (measured in kens). Formally:
S = (
log10n0, for the first firm
log10Lp, for all subsequent firms (at time of spinoff)
(7)
2.31 The Schumpeterian multiplier may also be thought of as the degree to which new ideas fit in to the existing firm. Following from Cassiman & Ueda (2006), exceeding this multiplier is effectively an incentive for an entrepreneur to leave the parent firm and establish a start-up. This is the degree to which an entrepreneur views a new idea as radical. The entrepreneur, the parent firm, or both, may have a ’sense’ of this multiplier. These are passed down from firm-to-firm as an entrepreneur, if her firm is not de novo, is assumed to come with the experience of managing a large firm. A de novo small firm would have a smaller Schumpeterian multiplier as the management required would need to only be adept at managing a smaller scope. The relationship between de novo firm size and its future potential for growth is transformative; the larger the firm, the standard deviational ellipse of that firm increases disproportionally. However, given that spin-offs (and specifically, the founders of spin-offs) inherit a sense of scope from their parent firm, the Schumpeterian multiplier carries through as a function of the size of the parent firm at the time of spin-off, just as in the case of r17.
Rule No. 4: All firms ’inherit’ S that is a function of the size of their parent firms.
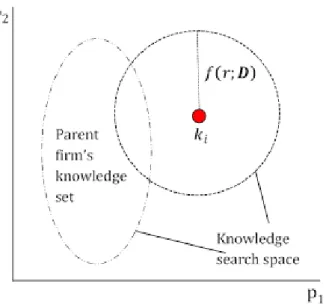
2.32 So far, kens interact per their cognitive reach as shown in Equation 2. However, interaction is not limited to this property. It is also assumed that a firm, if it is a spin-off firm, may also be able to interact with kens belonging to its parent firm (illustrated in Figure 7), and with equal probability18. An entrepreneur is assumed to have a
Figure 7: Knowledge search space.
follows from Klepper (2010) in that hereditary issues may lead to clustering of firms. Furthermore, we take the view that larger firms require unique skills for coordination efforts, and this transpires into a higher networking ability of the entrepreneur, as well as an increased search space.
Rule No. 5: In addition to their own cognitive reach, a ken’s knowledge search space also
in-cludes the parent firm’s knowledge set19.
2.33 We may also interpret spin-off behaviour (encapsulated by the Schumpeterian multiplier) from the perspec-tive of Henderson & Clark (1990), who define two types of knowledge: component knowledge and architec-tural knowledge. While the former concerns the ’pieces’ of a technology, the latter is how these pieces are put together. Incremental innovations, which are much more common, involve the advancement of component knowledge. This is due to two principles: the ’dominant design’ of a technology and the restriction of a firm’s information channels to that dominant design20. Once an industry accepts a dominant design, information
channels within the firm adhere to it, producing a ’lock-in’ of evolution of a given product group. Established firms tend to limit themselves to improvements in component knowledge due to these information channel re-strictions. Advancements in architectural knowledge, on the other hand, produce radical breakthroughs. These prisons of information flow do not restrict newly established firms and are therefore free from making a costly transition to new system of thinking, and enjoy a relative tabula rasa in cognition, routines and processes.
2.34 A summary of the model may be seen in Figure 8. The simulation outlined above takes into account concepts of inheritance, interaction (bound by cognitive constraints), as well as a spawning process when new firms arise. The spawning process itself has its own constraints that are brought about through earlier mechanisms. What results is a system where past firm size (measured in terms of kens) influences the present and future size of a firm via a path dependent process. To summarise, one sets up the simulation by first setting the size of the initial firm, n0, measured in kens (which in turn attain 1/r and S per Equations 5 and 7). The simulation then
begins its first time period, with kens interacting with one another according to Equations 2 and 3. New kens then come into existence via a crossover and mutation process as shown in Equation 4 and Figure 2. Then, new firms may or may not come into being as stated in Equation 6. Depending again on Equations 5 and 7, new kens attain their scale parameters and Schumpeterian multipliers. This marks the end of the time period, after which the process starts again with the interaction phase in the second time period. This ’loop’ continues indefinitely or for a stipulated number of time periods predefined by the user of the simulation.
2.35 A snapshot of the simulation may be seen in Figure 921. Spin-offs often occur on the periphery of the parent
firm’s existing knowledge set. This may or may not hinder the future growth performance of the parent firm, as it depends entirely on the parent firm’s attributes, i.e. its cognitive reach, Schumpeterian multiplier and current size. In this framework, firms do not ’fail’. In many cases, however, when spawning does occur, older firms may have a growth rate that approaches zero due to multiple spin-offs forming on the periphery of the parent firm’s knowledge set, which can effectively ’crowd out’ growth of the parent firm. Indeed, this has been
Figure 8: Simulation overview.
Figure 9: A simulation snapshot.
shown empirically (McKendrick et al. 2009; Phillips 2002). Furthermore, we exclude the possibility of mergers and takeovers, and analyse firms only in their own right from the time of spin-off.
Results and Discussion
3.1 The simulation models the firm as an entity of knowledge. We propose that it is knowledge that is both the enabler and constraint of firm growth. To illustrate this, we bridge the gap between the simulation and the findings of empirical work by comparing the model to stylised facts. The purpose of this is two-fold. First, this acts as a verifier to the simulation. Second, this gives the simulation, which in itself is based on a highly abstract view of knowledge and cognition, some degree of explanatory power behind spin-off patterns by taking into account qualities that are difficult to measure in the real world. Table 2 summarizes these stylised facts, along with the simulation’s results.
3.2 Within the simulation, the growth curves of individual firms typically display an initial spurt of growth followed by a levelling off to a rate of zero. The presence of other firms exacerbates the limits of firm growth, which, if bordering the periphery, are likely spawns of the declining firm.
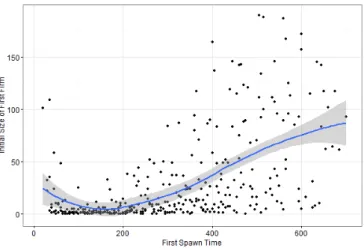
3.3 Therefore, it is common to observe that the majority of spawning occurs toward the beginning of a simulation, before the initial incumbent firm is at a size that erodes the possibility of new firms. Klepper & Sleeper (2005), in their study of the laser industry, found that spin-offs were more likely at the middle-age of the parent firm. In the simulation, firms exist into perpetuity, so there is no real definition of a firm’s ’middle-age’. The initial firm is exogenously given, with no indication of its age. However, Klepper & Sleeper (2005) propose that a change in the kind of information generated affects spawning times, which in turn compromises the knowledge available for employees to exploit. The first spawn, if any, usually occurs during the early stages of the simulation. The exogenously set constant, a, is responsible for this pattern. The larger the size of the initial firm, the later in the simulation the first spawn occurs. This may be seen in Figure 10, which plots three runs. In this simulation, the
Stylised Fact Result
Number of spawns
When measured per employee, larger firms tend to spawn less frequently, while smaller firms spawn more frequently (Gompers et al. 2005; Sørensen 2007; Elfenbein et al. 2010; Wagner 2004; Eriksson & Kuhn 2006; Klepper 2009).
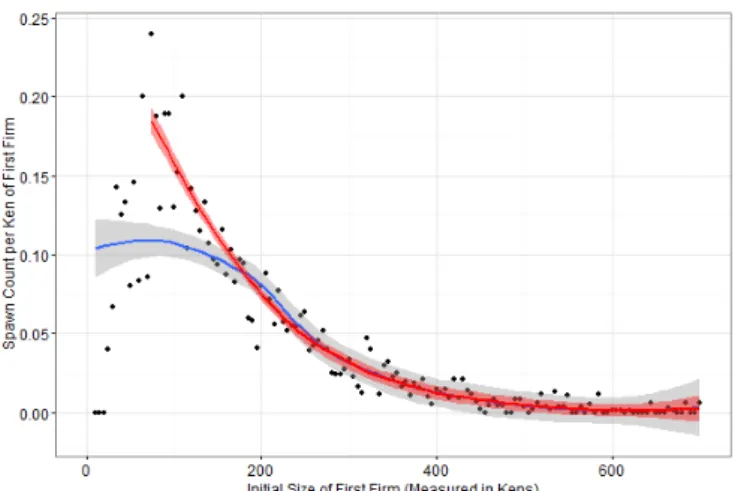
When measured per ken, we obtain a negative rela-tionship between initial firm size and the number of spin-offs (Figure 11).
Quality of spawns
When measured in terms of performance, larger firms tend to spawn firms of higher quality, while smaller firms spawn firms of lesser quality (Anders-son & Klepper 2013; Hvide 2009; Klepper 2009; Chris-tensen 1993; Franco & Filson 2000).
When measured in terms of kens, the size of the ini-tial firm provides a constraint on the size of any po-tential future firm (Figure 12).
Zipf’s law
Irrespective of how one defines firm size, the rank-size distribution of firms follows a Zipf distribution with a coefficient close or equal to one (Axtell 2001; Stanley et al. 1996; Amaral et al. 1997, 1998).
All simulations lead to a Zipf distribution irrespective of initial firm size. Zipf’s law is observed for a unique and consecutive subset of n0parameters (Table 3).
Table 2: Summary of key concepts
Figure 10: First spawn times.
model is run for 200 time periods.
3.4 Andersson & Klepper (2013) and Hvide (2009) found that the higher the quality of entrepreneurs leaving larger firms, the better performance of the spin-off founded by those outgoing employees. This is comparable to the findings in earlier work by Burton et al. (2002); Christensen (1993); Franco & Filson (2000). Furthermore, Gom-pers et al. (2005) found that although the largest companies spawn the most new firms, when measured in terms of annual spawning per million of employees it is actually the smaller firms that were more likely to spawn new firms. This was also confirmed by Sørensen (2007); Elfenbein et al. (2010); Wagner (2004); Eriksson & Kuhn (2006). Klepper (2009) found that, when measured by longevity, peak market share, early entry, and product quality and scope; better performing firms have higher rates of entrepreneurial spawning. When measured in terms of the number of spin-offs per employee, the rate of entrepreneurial spawning is higher for smaller firms. Gompers et al. (2005) found that firms that had an employment range of 100 employees or less (the lowest cat-egory) displayed a considerably higher rate of entrepreneurial spawning, at least four times that of any other category. Thus, the more likely incubators for entrepreneurs may well be that of other small, entrepreneurial firms, a setting where employees acquire the knowledge and skills needed to start a new establishment. All of these studies use variables that are largely observable. The model predicts spawning patterns according these stylised facts, and these may be seen in Figure 11, which illustrates the number of firms at t = 200 with respect to the size of the initial firm, as well as the size of each firm with respect to the initial size of the initial firm (in Figure 12). This builds upon the aforementioned empirical studies (Andersson & Klepper 2013; Hvide 2009; Gompers et al. 2005, etc.) by taking into account the nature of innovation, i.e. new technology being a function
Figure 11: Number of spawns at t = 200.
Figure 12: Size distribution of firms at t = 200.
of old ones. One firm, with an initially large size, will produce few firms, but these firms are large and similar in size to the original. A small firm will often lead to many smaller ones.
3.5 With very large firm sizes, the likelihood of a spin-off diminishes with a ’monopoly effect’; the initial firm, along with its Schumpeterian multiplier, becomes too large to make spawning behaviour likely as the firm internalizes all innovation. For very small firms, that is, with a technology set of less than 30, spin-offs are also less likely due to the cognitive reach of kens being too small to produce any new kens. The overall trend is one that is sub-exponential, but with greater variation as initial firm size increases. The variation is due to the presence of other firms, and the exponential shape is a result of the Schumpeterian growth of the entire system as illustrated earlier in Figures 4 and 5.
3.6 As seen in Figure 11, the number of spawns per ken falls as the size of the parent firm increases. Two overlaid fitted polynomial predicted lines illustrate this relationship; a blue fitted line (which considers all observations) and a red fitted line (which excludes the first 13 observations). The blue fitted line reflects a relatively low cog-nitive reach with respect to the Schumpeterian multiplier for small initial firm sizes. After that threshold, the reverse is true. Spin-off frequency is therefore a function of the relationship between r and the Schumpete-rian multiplier. The red line illustrates this post-threshold relationship. Aghion et al. (2005) found a similar relationship with respect to competition and innovation. At very low and very high levels of product market competition, innovation is constrained, whereas at intermediate levels a Schumpeterian effect dominates. Fig-ure 12 plots the final size of all spin-offs (marked in black) at the end of the simulation, compared to the final size of the initial firm (marked in red). Final spin-off size, measured in kens, roughly follows the final size of the initial firm. Hence, this replicates the stylized facts of previous empirical studies (Andersson & Klepper 2013; Hvide 2009; Klepper 2009; Christensen 1993; Franco & Filson 2000) that show that higher quality firms tend to spawn higher quality spin-offs.
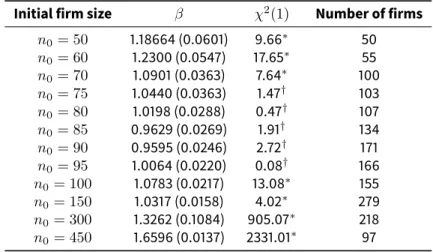
Initial firm size β χ2(1) Number of firms n0= 50 1.18664 (0.0601) 9.66∗ 50 n0= 60 1.2300 (0.0547) 17.65∗ 55 n0= 70 1.0901 (0.0363) 7.64∗ 100 n0= 75 1.0440 (0.0363) 1.47† 103 n0= 80 1.0198 (0.0288) 0.47† 107 n0= 85 0.9629 (0.0269) 1.91† 134 n0= 90 0.9595 (0.0246) 2.72† 171 n0= 95 1.0064 (0.0220) 0.08† 166 n0= 100 1.0783 (0.0217) 13.08∗ 155 n0= 150 1.0317 (0.0158) 4.02∗ 279 n0= 300 1.3262 (0.1084) 905.07∗ 218 n0= 450 1.6596 (0.0137) 2331.01∗ 97
All coefficients significant at the 1% level
* Reject at the 10% level of significance.
Exhibits Zipf’s law.
Table 3: Maximum Likelihood Estimates for the Zipf Distribution
1996; Amaral et al. 1997, 1998) observe that when plotting the log of the firm’s size against its rank22, the
out-come is a linear distribution with a slope close to one. In other words, the nthlargest firm is 1/n the size of the
largest firm. This distribution is unaffected by mergers and acquisitions, firm entry and exit, as well as large-scale demographic transitions and technological change (Axtell 2001). To test this observation on our simula-tion results, we perform a maximum likelihood (ML) estimasimula-tion to fit a Zipf distribusimula-tion, which may be seen in Table 3, which shows the estimates obtained at varying levels of n0. Irrespective of the setting, we obtain a Zipf
distribution with statistically significant ML estimates. Zipf’s law, however, applies when such ML estimates (i.e. the coefficient β) are equal to one. Within the context of the simulation, this occurs at initial firm sizes that are relatively small (but not too small), ranging from n0=75 to n0=95.
3.8 When observed in various social phenomena, a unifying explanation behind Zipf’s law is not clear. When graph-ing the relationship between word frequencies with respect to their size, Zipf (1949) proposed the principle of least effort, i.e. speakers and hearers of a given language will not work any harder than necessary to reach an understanding of that language. ZipfâĂŹs law has also been found in the rank-size distribution of webpages, explained by website growth rates, caching and networks (Adamic & Huberman 2002). With regard to cities, Simon (1955) found that those in the upper tail follow similar growth processes. Furthermore, shocks (such as regional shocks or municipal policy shocks) stop declining with size, after a certain size (Gabaix 1999). Thus, Zipf’s law arises through the adjustment of organizational patterns through a system of positive and negative feedback loops (Stanley et al. 1996).
3.9 Axtell (2001) found that, with regard to firm sizes, the shape of such power law distributions, such as Zipf’s law, is independent on how size is defined. Thus, following from Stanley et al. (1996) and Brown & Medoff (1989), there are limits on firm dynamics. Firm growth rates follow a Laplace distribution, and the standard deviation in those growth rates decrease with respect to initial firm size according to a power law. Additionally, larger firms pay higher wages for the same job according to yet another power law (Axtell 2001, p. 1820). In the context of the simulation in this paper, these constraints are knowledge. Penrose (1959) found that (given the conditions of equilibrium analysis), there must be something to prevent the indefinite expansion of the firm.
3.10 Penrose (1959) identifies two constraints. The first of these is the ability to manage complexity. At some point, a firm may become "too big to be efficiently handled" (Penrose 1959, p. 18). In the context of our simulation, the Schumpeterian multiplier accounts for both the incentive for an entrepreneur to leave an incumbent firm (and establish a new one) as well as the degree to which a certain new idea fits in with the incumbent firm. Managing an ever increasing complexity of knowledge becomes burdensome for all firms at some point (even though larger firms may have a relatively easier constraint due to their larger multipliers). Penrose’s second constraint is that of knowledge itself. A firm can only grow as fast as its own knowledge, both within and beyond the firm. In the simulation, actors have a degree of ’vision’ which they obtain through a system of constrained inheritance. Furthermore, new ideas are only ever a product of existing ideas. Thus, as knowledge is a product of an evolutionary process, a firm is constrained by that evolutionary process. This may serve as an explanation of Zipf’s law in our simulation.
context of the model, Zipf’s law is an emergent phenomena that comes about when initial firm size is within a subset of initial conditions. This emergent property is when the initial firm size gives rise to a given number of firms via set of inherited parameters. Bridging this observation into the real world, we can make two points. First, there is perhaps an ’ideal’ de novo firm size, measured in terms of its knowledge set, which is sustainable. Second, and more fundamentally, the constraints brought about by human cognition constrict the initial con-ditions available. These initial concon-ditions, which in turn influence future firm sizes through path dependence, are based upon actors’ understanding of the knowledge landscape around them. Physical and social technolo-gies that change this level of cognitive reach (and hence alter the equation set out in 5), may in turn alter the conditions in which Zipf’s law emerges. Indeed, Axtell (2001) found that although Zipf’s law remained constant throughout the years of study, the average size of firms did not. Technology alone may therefore have an impact on firm size, but not firm-size distribution, which is dependent on the cognitive abilities of actors.
Conclusion
4.1 The computational simulation in this paper, although artificial in the strictest sense, may have real-world im-plications for analyzing the comparative statics of various geographical regions. In other words, can we explain technological diversity between regions by the size of initial firm? Klepper (2007) found that, for the automobile cluster of Detroit, the geographic concentration of industry is the result of four early successful entrants, and subsequent spin-offs were a function of disagreements with the parent firms’ existing R& D strategies. Thus, given the assumptions and mechanisms of the above simulation, predictions of regional evolution could be made based on the region’s current market structure. Regions with few, larger firms could have a significantly different path-dependent fate compared with a region of many smaller firms (but within the same industry). If units of knowledge (or kens) can proxy for firm size, this model has replicated the empirical regularities of pre-vious studies. Further research could explore this question by expanding the model to include multiple (and industrially dissimilar) firms as an initial condition.
4.2 The findings of this paper add to the argument put forward by Klepper (2009), in that the superior performance of firms in a geographical area is due to the higher quality of spin-offs and not any specific geographic attributes. This paper does not address geographic distance, and assumes that all firms are located within the same ge-ographic area. The paper does, however, highlight the role of cognitive distance in its role in the performance of firms. The performance of spin-offs is a function of the cognitive properties that pertain to them. Further-more, inexperienced firms that choose to locate within a cluster tend to perform better than those who do not. Although this paper does not address these type of firms, it may be argued that this is a result of knowledge spillovers. However, this would also mean that such inexperienced de novo firms would have a disadvantage compared to spin-offs in a region as they lack the advantage of preferential knowledge of the parent firmâĂŹs idea set. This ties-in with Andersson & Klepper (2013), who found that pulled spin-offs in the same sector as their parents have a lower hazard rate of survival compared to other types of spin-offs.
4.3 The model has potential to be extended in a number of ways. One of these could be the ’death’ of firms. How-ever, considering the possibility of takeovers and sell-offs, the patents and ideas present in a defunct firm would be transferred to a new one, and this would effectively change the dynamics of the cognitive understanding of various technology sets on the firm-level. Another issue is the potential effects that result from closed firms. If a firm dies, its employees may have to become ’forced entrepreneurs’, effectively rescuing their specialized skills by establishing a firm similar to the defunct one. This mechanism is not captured by this paper’s interpreta-tion of entrepreneurship and the cognitive consequences are likely to be similar to the merger and acquisiinterpreta-tion scenario.
4.4 This paper described the effects of initial firm size on industrial clustering patterns using a highly simplified model of technical cognition. An initially large firm gives rise to fewer, but larger, spin-offs when measured in terms of their produced knowledge set. Conversely, smaller initial firms, over a certain threshold, tend to spawn fewer firms and of smaller size. If firm size, measured in terms of the number of generated ideas, could proxy for profits, employee size or market share, the model confirms empirical regularities. Specific patterns of industrial clustering are a result of the characteristics of entrepreneurs themselves, modelled through the differences in their cognitive reach, and these differences are endowed through a process of inheritance.
4.5 In sum, this paper has modelled clustering patterns via a process of recombinant innovation. The difficultly in measuring or defining a firm’s set of ideas is rectified due to the model’s level of abstraction. Altering and extending the rules of this model may hopefully provide a basis for future work in evolutionary economic ge-ography.
Notes
1Specifically, this paper examines pulled spin-offs, in which an employee leaves an incumbent firm to
estab-lish a new venture, while the incumbent firm may or may not continue to operate.
2Sørensen (2007); Elfenbein et al. (2010); Sørensen & Phillips (2011) find that the larger the spin-off’s parent,
the worse the spin-off’s financial performance and hence the shorter the firm’s longevity.
3Other factors are of course fundamental. These can include those that are external to firms and their
spin-offs (i.e. industry structure and profitability, access to credit and availability of skills) as well as internal (i.e. career paths, incentive mechanisms and organizational identity). Indeed, Schumpeter (1934) stressed the role of credit in the business cycle and as a critical conduit for the entrepreneurial process. These factors are empir-ical facts. After empirempir-ically controlling for these factors, authors such as Klepper (2007, 2009, 2010) and Klepper & Sleeper (2005) found that what is left over is an implied inheritance process of knowledge, skills and routines. The simulation in this paper aims to fill that void.
4It should be noted, however, that the benefits of the printing press were only felt on the scale of cities.
Dittmar (2011), using aggregate productivity and per capita income as measures of surplus, found that the gains from books were initially only found in printing cities. Only upon the introduction of mass-transportation tech-niques centuries later were the benefits felt world-wide. This patter was similar to the rise of the use of com-puters and the Internet, the mass benefits of which were only felt until the mid- 1990’s.
5Ken is the Scots English word for "to know, perceive or understand", "a piece of knowledge" or "the scope
or bounds of one’s understanding" (Dictionary of the Scots Language 2016). This is not to be confused with the so-called ’kene’ as defined by Gilbert (1997), a portmanteau of ’knowledge’ and ’gene’, which is defined as the entire knowledge base of a firm.
6In this paper, we frequently use biological analogies to describe certain abstract concepts. However, one
needs to bear in mind that such analogies do not (and should not) extend to social systems as a whole. Social systems do not display the same properties as biological ones. This includes the presence of multiple member-ship (i.e. being part of many organizations at the same time), the lack of what may be defined as a ’boundary’ (see Williamson 1975, 1985; Pfeffer & Salancik 1978; Ashkenas et al. 1995; Jarillo 1993), and the lack of a clear definition of what a role (or competency) is within an organization. Biggiero (2001) gives a clear warning of the fallacy in describing firms using purely biological concepts as this is misleading for understanding social systems.
7Cognition is a three-dimensional vector comprised of all possible phenotypes, i.e. D = [p
1, p2, p3]T 8Biggiero (2001), building on work by Williamson (1975, 1985); Pfeffer & Salancik (1978); Ashkenas et al. (1995);
Jarillo (1993) showed that firms (either composed of such actors, or as the actors themselves) are not closed systems as they are constantly searching for efficient resources, and these resources may include knowledge.
9The cognitive reach may be illustrated using the distribution’s quantile function, where u is a random draw
of any real number less than 1, i.e. F1(u) = r ln[1 − ln(1 − u)], u ∈ [0, 1)
10This is modelled on Hirsch (1992), who showed that, given groups of neurons that are physically similar but
with bell-shaped distributed activation thresholds, the resulting network group of neurons will have a sigmoidal distribution of activation thresholds.
11This paper takes the moderate constructivist epistemology (Biggiero 2012) that knowledge may be both
reified meta-information, i.e. an ’object’, as well as an emergent property of a network. While the former may be ’possession’, the latter is viewed as ’practice’. In the case of the latter, and in the context of the current model, an unseen and undefined network is implied. Imagine the cognitive space as a geographical one, containing a series of road networks. Firms (or kens) that are cognitively proximate to one another are connected via shorter roads. However, that does not necessarily mean that two firms (or kens) can easily connect. That depends on the effectiveness of transportation (or, to break away from this geographic analogy, their cognitive reach).
12A description of these first appeared in English by Kondratieff (1979), although Kondratieff’s original
con-cept originated some decades earlier.
13Author’s own interpretation, using Kondratieff (1979) and Schumpeter (1943).
14There are no borders within the cognitive space, and firms do not imply borders either. Multiple
member-ship of organizations may exist everywhere and nowhere. There is nothing that implies it does not, and there is nothing to imply that it does. Moreover, an idea-generating institution does not have to be a profit-producing or-ganization but also does not even have to be an oror-ganization. We can view this model in terms of, for example,
music genres coupled with mathematics, even though music theory has no axiomatic foundation in modern mathematics. Thus, it is important to use an abstract mindset when thinking about this model. For a less ab-stract approach that uses real data in a knowledge space, see Biggiero & Basevi (2016) and Biggiero & Angelini (2015) for research that deals explicitly with R& D collaboration networks.
15This constant may be thought of as a ’damper’ that reflects the lack of competition pressures and the de
novo nature of the employees, i.e. the lack of experience from previous firms. The significance of this constant becomes important during the model’s run as it increases the probability of the first firm producing a spawn.
16Again, for simplicity, we illustrate using a two-dimensional cognitive space
17Both 1/r and S follow the same principles, as seen in Equations 5 and 7. However, unlike 5, there is no
’damper’ a. We can assume that cognitive reach and the Schumpeterian multiplier behave differently in this respect. While we can envisage a lack of experience (due to being a de novo firm) may impact the search be-haviour of actors, there is little reason to suspect that there would be a similar damper on the incentives of entrepreneurs (as well as the incentives of incumbent firms). This is why a only appears in Equation 5, and not Equation 7.
18Consider ken i, which is part of the knowledge set of a spin-off firm. Before the crossover and mutation
process, ken i links up with another ken that may belong to one of two sets. The first set is comprised of all kens in the spin-off’s parent firm. The second set is comprised of all kens in i’s search area as dictated by Equation 2. In any given discrete time period, ken i may link up with kens in either set with equal probability.
19A firm does not inherit the parent firm’s knowledge base, but has the means to search it, and only through
one of its own kens. There is an implicit assumption that spin-offs are connected to their parent firms via a net-work of sorts. Compared with other firms, there is a better sense of familiarity with the parent firm. Maintained connections, as well as past immersive experience with the parent firm provides this familiarity. The kens of the parent firm act as ’library’ that the spin-off’s kens may use.
20This is an expansion on the work by Nelson & Winter (1982)
21This snapshot gives the appearance that firms take the form of ’islands’ that occupy the sea of the cognitive
space. It is important to note that the model gives rise to the appearance of islands, depending on initial pa-rameters. There is, theoretically, nothing preventing firms from ’overlapping’ with one another to share zones in the cognitive space. Indeed, this is one potential outcome.
22i.e., log R = α + β log n, where R is the firm’s rank and n is its size.
References
Adamic, L. A. & Huberman, B. A. (2002). Zipf’s law and the internet. Glottometrics, 3(1), 143–150
Agarwal, R., Echambadi, R., Franco, A. M. & Sarkar, M. B. (2004). Knowledge transfer through inheritance: Spin-out generation, development, and survival. Academy of Management Journal, 47(4), 501–522
Aghion, P., Bloom, N., Blundell, R., Griffith, R. & Howitt, P. (2005). Competition and innovation: An inverted-U relationship. The Quarterly Journal of Economics, 120(2), 701–728
Ahuja, G. & Morris Lampert, C. (2001). Entrepreneurship in the large corporation: A longitudinal study of how established firms create breakthrough inventions. Strategic Management Journal, 22(6-7), 521–543
Amaral, L. A. N., Buldyrev, S. V., Havlin, S., Leschhorn, H., Maass, P., Salinger, M. A., Stanley, H. E. & Stanley, M. H. R. (1997). Scaling behavior in economics: I. Empirical results for company growth. Journal de Physique I, 7(4), 621–633
Amaral, L. A. N., Buldyrev, S. V., Havlin, S., Salinger, M. A. & Stanley, H. E. (1998). Power law scaling for a system of interacting units with complex internal structure. Physical Review Letters, 80(7), 1385
Andersson, M. & Klepper, S. (2013). Characteristics and performance of new firms and spinoffs in Sweden. In-dustrial and Corporate Change, 22(1), 245–280
Antonelli, C. (2010). Pecuniary externalities and the localized generation of technological knowledge. In The Handbook of Evolutionary Economic Geography, (pp. 162–181). Cheltenham: Elgar
Arthur, W. B. (1989). Competing technologies, increasing returns, and lock-in by historical events. The Economic Journal, 99(394), 116–131