Comparisons to Investigate the Population Structures of
Actinomyces naeslundii
and
Actinomyces oris
Uta Henssge1, Thuy Do1, Steven C. Gilbert1, Steven Cox1, Douglas Clark1, Claes Wickstro¨m2, A. J. M. Ligtenberg3, David R. Radford1, David Beighton1*
1 Department of Microbiology, The Henry Wellcome Laboratories for Microbiology and Salivary Research, King’s College London Dental Institute, London, United Kingdom, 2 Department of Oral Biology, Faculty of Odontology, Malmo¨ University, Malmo¨, Sweden, 3 Department of Oral Biochemistry, ACTA, Amsterdam, The Netherlands
Abstract
Actinomyces naeslundii and Actinomyces oris are members of the oral biofilm. Their identification using 16S rRNA sequencing is problematic and better achieved by comparison of metG partial sequences. A. oris is more abundant and more frequently isolated than A. naeslundii. We used a multi-locus sequence typing approach to investigate the genotypic diversity of these species and assigned A. naeslundii (n = 37) and A. oris (n = 68) isolates to 32 and 68 sequence types (ST), respectively. Neighbor-joining and ClonalFrame dendrograms derived from the concatenated partial sequences of 7 house-keeping genes identified at least 4 significant subclusters within A. oris and 3 within A. naeslundii. The strain collection we had investigated was an under-representation of the total population since at least 3 STs composed of single strains may represent discrete clusters of strains not well represented in the collection. The integrity of these sub-clusters was supported by the sequence analysis of fimP and fimA, genes coding for the type 1 and 2 fimbriae, respectively. An A. naeslundii subcluster was identified with both fimA and fimP genes and these strains were able to bind to MUC7 and statherin while all other A. naeslundii strains possessed only fimA and did not bind to statherin. An A. oris subcluster harboured a fimA gene similar to that of Actinomyces odontolyticus but no detectable fimP failed to bind significantly to either MUC7 or statherin. These data are evidence of extensive genotypic and phenotypic diversity within the species A. oris and A. naeslundii but the status of the subclusters identified here will require genome comparisons before their phylogenic position can be unequivocally established.
Citation: Henssge U, Do T, Gilbert SC, Cox S, Clark D, et al. (2011) Application of MLST and Pilus Gene Sequence Comparisons to Investigate the Population Structures of Actinomyces naeslundii and Actinomyces oris. PLoS ONE 6(6): e21430. doi:10.1371/journal.pone.0021430
Editor: J. Ross Fitzgerald, University of Edinburgh, United Kingdom Received May 6, 2011; Accepted May 27, 2011; Published June 30, 2011
Copyright: ß 2011 Henssge et al. This is an open-access article distributed under the terms of the Creative Commons Attribution License, which permits unrestricted use, distribution, and reproduction in any medium, provided the original author and source are credited.
Funding: The authors acknowledge support from the Dental Institute, King’s College London, and from the Department of Health via the National Institute for Health Research (NIHR) comprehensive Biomedical Research Centre award to Guy’s & St Thomas’ NHS Foundation Trust in partnership with King’s College London and King’s College Hospital NHS Foundation Trust. The funders had no role in study design, data collection and analysis, decision to publish, or preparation of the manuscript.
Competing Interests: The authors have declared that no competing interests exist. * E-mail: david.beighton@kcl.ac.uk
Introduction
Actinomyces naeslundii and Actinomyces oris are part of the commensal oral microbiota [1–3], may play a role in pathogenesis of caries [1] and have been isolated from extra-oral infections [4]. The identification of these species has proven difficult over the years since no reliable phenotypic characteristics are known to distinguish between either species [5] though for a period catalase production was used to distinguish between A. naeslundii and isolates then described as human Actinomyces viscosus [6]. Many of these difficulties were resolved by the extensive genetic studies reported by Johnson and colleagues [5] in which A. naeslundii genospecies 1, 2 and WVA 963, on the basis of DNA-DNA hybridization data, were described. Formal species descriptions were not given as they were unable to distinguish between the genospecies with phenotypic tests. However, genotype specific antisera were developed [7] which permitted the identification of A. naeslundii genospecies 1 and 2 from samples of dental plaque and infected dentine associated with dental caries [1]. Subsequent
identification of isolates as members of genospecies 1 or 2 have relied on genospecies-specific antisera [7] which has enabled the distribution and phenotypic properties of the two genospecies to be compared. Thus A. naeslundii genospecies 2 isolates were demonstrated to bind to N-acetyl-b-D-galactosamine and acidic proline-rich proteins and to exhibit an N-acetyl-b-D-galactos-amine binding specificity signified by N-acetyl-b-D-galactosN-acetyl-b-D-galactos-amine- N-acetyl-b-D-galactosamine-inhibitable coaggregation with the specified streptococcal strains. A. naeslundii genospecies 1 also bound to N-acetyl-b-D-galactos-amine, but commonly not to acidic proline-rich proteins and possessed another N-acetyl-b-D-galactosamine binding specificity to a different set of streptococcal isolates [8]. However, the hemagglutination patterns of strains ascribed to genospecies 1 and 2 were not uniform indicating phenotypic heterogeneity of the surface properties within these taxa. Sequence analysis of the fimA gene, coding for the type 2 fimbriae, from isolates of the two genospecies indicated that there was greater similarity in sequence within genotypes than between genotypes. However, diversity of fimA sequences within each genotype was apparent and strains
LY7 and P-5-N clearly harboured fimA genes with sequences different to those of the other three studied in each genotype although the fimP gene from 5 A. naeslundii genospecies 2 isolates exhibited $98 sequence homology. Members of these two genospecies also exhibited different patterns of interaction with other bacteria, red blood cells and salivary proteins [9]. These two genospecies are early colonisers of tooth surfaces but A. naeslundii genospecies 2 is isolated from the mouth more frequently and in greater numbers than A. naeslundii genospecies 1 [5,10].
We have recently reported the descriptions of Actinomyces naeslundii (previously Actinomyces naeslundii genospecies 1), Actinomyces oris (previously Actinomyces naeslundii genospecies 2) and Actinomyces johnsonii (previously Actinomyces naeslundii genospecies WVA963) by means of sequence analysis of housekeeping genes [2]. We found that some isolates identified as genospecies 1 by Hallberg et al [8,10] on the basis of their reactions with genospecies-specific antisera [7] were A. oris and that the sequenced actinomyces strain ‘‘A. naeslundii’’ MG-1 is a member of the species A. oris [2].
Previous studies have also reported on the intra- and inter-species diversities of A. naeslundii and A. oris, as A. naeslundii genospecies 1 and 2 using DNA fingerprinting [11], ribotyping [5,12], amplified 16S ribosomal DNA restriction analysis (AR-DRA) [4,13], DNA probes [14], sequence analysis of fimA genes [9] and REP-PCR amplicons analysis [10]. All these studies have demonstrated extensive heterogeneity within each taxon. In this report we have applied a multilocus sequencing typing (MLST) approach [15] to investigate the diversity of the two species and used analysis of partial fimA and fimP gene sequences to validate the diversity apparent in the MLST analysis.
Materials and Methods
Bacterial strains and growth conditions
The partial sequences of 16S rRNA genes, selected house-keeping genes and genes for fimbrial proteins, fimA and fimP, were determined for strains in a collection of A. naeslundii, A. oris, A. johnsonii (Table S1). Additional gene sequence data were derived from the genomic data of ‘‘A. naeslundii’’ strain MG-1 (http://cmr.jcvi.org/tigr-scripts/CMR/GenomePage.cgi?org = gan). Isolates were stored at 280uC in cryo-preservative fluid. Bacteria were subcultured twice on fastidious anaerobe agar (FAA; Lab M Ltd.) supplemented with 5% defibrinated horse blood and cultivated anaerobically at 37uC for 24 to 48 h.
DNA was extracted using Proteinase K as described previously [16]. Briefly, cells were washed once in 2 M NaCl, centrifuged and resuspended in 50ml TE buffer containing 0.5% TweenH20 (Tris-EDTA buffer, pH 8.0). Proteinase K solution (10 mg/ml stock solution) was added to a final concentration of 200mg/ml. The tubes were incubated at 55uC for 2 h and subsequently heated at 95uC for 5 min. The tubes were centrifuged at 13,000 rpm for 1 min, the supernatants were transferred into new microcentrifuge tubes and the DNA extracts were stored at 220uC.
Partial 16S rRNA sequences (GQ421308–GQ421320 and JF776381–JF776392), approximately 1390 bp in length, of selected strains were determined with the universal primers 9f and 1512r for amplification and 9f, 519r, 357f, 1100r and 1492r for sequencing [17]. Partial sequences of the genes atpA [ATP synthase F1, alpha subunit, ANA_0169], metG [methionyl-tRNA synthetase, ANA_1898], rpoB [DNA-directed RNA polymerase, beta subunit, ANA_1497], pgi [glucose-6-phosphate isomerase, ANA_0727], gltA [citrate synthase I, ANA_1674] and gyrA [DNA gyrase, A subunit, ANA_2224] have been previously reported [2] (EU603149–EU603264 (pgi), EU620779–EU620894 (atpA), EU620895–EU621010, (gltA), EU621011–EU621126 (gyrA),
EU621127–EU621242, (metG) and EU621243–EU621358 (rpoB))Partial sequences of pheS [phenylalanyl-tRNA synthetase, alpha subunit, ANA_1034] (GQ354571–GQ354683) were also determined using combinations of PheS-F (GACGAGGACGG-CATCAAT, CATCGCCAAGGCTCTGA, TCGGCACCCTG-GACAA and CTGTCGGCACCCTG-GACAAGGCGTCGGCACCCTG-GACAA) and PheS-R (CTG-GGAGAAGCGGATGT; GCCGAACTGCTGGAGAA, ACCG-CCCTTCTTCTGG, GAACCACAGGTCCATCT and CGAA-GCCCGTGTAGACCT) primers to amplify a portion of the gene and PheS-sqF (CGCCGAGGAGGAGAT) and PheS-sqR (GCT-GGGCTCGGTGAA) to sequence, in both directions, an internal fragment of the amplicon.
The PCR reactions were performed either in 0.2 ml micro-centrifuge tubes or in non-skirted 96-well PCR plates (Thermo Scientific, UK) in a total volume of 15ml. The reaction mix contained 1ml DNA template, 0.2mM of each primer (MWG), 0.5 mM MgCl2and Reddy-Mix (Thermo Scientific, UK). Due to
noticeable sequence variability and recurring high G+C mol% regions in pheS it was necessary to amplify and sequence the gene using multiple forward and reverse primers. When more than five primers were used in a PCR reaction the concentration of each primer was reduced to 0.16mM. The PCR conditions for all amplification reactions were as follows: initial denaturation at 94uC for 10 min; 30 cycles at 94uC for 45 s, 53uC for 35 s, and 72uC for 75 s; and final extension at 72uC for 10 min. PCR products were cleaned adding 4 units Exonuclease I (Fermentas, Canada) and 1 unit Shrimp Alkaline Phosphatase (Thermo Scientific, UK) to each reaction which were then incubated at 37uC for 45 min and subsequently heated at 80uC for 15 min to inactivate the enzymes. The DNA fragments were sequenced using an ABI Prism cycle sequencing kit (BigDye terminator cycle sequencing kit with AmpliTaq DNA polymerase FS).
fimA and fimP gene sequencing
Type-2 fimbriae fimA [ANA_0024 fimbrial structural subunit] and type-1 fimbriae fimP [ANA_2510 Type-1 fimbrial major subunit precursor] of strain MG-1 were used as the basis for the design of primers to amplify these genes. The partial fimA fragment analyzed equates to positions 739–1381 (659 bp) in the A. oris MG-1 gene and is located between the conserved regions of pilin motif and E box (JF825156–JF825240 (fimA) and JF825241–JF825307 (fimP)). The partial fimP fragment covered the positions 571–1234 in strain A. oris MG1 and was also located between the pilin motif and E box. It was necessary to use sets of primers (Table 1) in the initial amplification reaction due to the sequence diversity of the two pilus genes. For the PCRs the reaction mix contained 1ml DNA template, 0.2mM of each primer (MWG), 0.5 mM MgCl2
and Reddy-Mix (Thermo Scientific). The Reddy-Mix included 1.5 mM MgCl2, 0.2 mM each dNTP, 20 mM (NH4)2SO4,
75 mM Tris-HCl (pH 8.8 at 25uC), 0.01% (v/v) TweenH20 and Thermoprime Plus DNA Polymerase (0.025 units/ml) in a total volume of 15ml. A multi-primer approach was utilized in which usually four primers were included, but up to six primers were included in some reactions. DNA amplification was carried out using the following programme: 94uC for 10 min, 10 cycles of 94uC for 45 sec, 56uC for 35 sec and 72uC for 75 sec followed by 20 cycles of 94uC for 45 sec, 53uC for 35 sec and 72uC for 75 sec and 72uC for 7 min for the final elongation. The amplicons were sequenced as described above.
Analysis of house-keeping gene data and ST assignment Chromatograms of forward and reverse sequences of pheS were analysed, trimmed and aligned using BioEdit [18]. The sequence data of the A. oris and A. naeslundii for each locus were analysed and
unique allele sequences were given continuous numbers and every unique allelic profile was given a unique sequence type (ST) [15]. STs were assigned to all A. oris and A. naeslundii isolates such that STs 1–68 were A. oris and STs 69–100 were assigned to the A. naeslundii strains. A neighbor-joining tree was constructed in MEGA4 [19] using the concatenated sequences of each ST and bootstrap values calculated based on analysis of 1000 resampled datasets.
Further phylogenetic analysis of the sequence data of all A. oris and A. naeslundii STs was performed using ClonalFrame [20] a technique widely used to assess the evolutionary relationships between strains of the same and closely related bacterial species as it enables bacterial recombination to be taken into consideration when constructing phylogenetic history. The threshold for the consensus tree was set to 0.50 and 0.95. Six ClonalFrame runs were conducted using the default settings, 50,000 iterations which were discarded, followed by 50,000 iterations of which every 100th generation was sampled. Therefore, 501 trees per run were calculated and the data of the six runs were combined and a consensus phylogenetic tree was drawn in MEGA4 [19]. 16S rRNA sequence analysis
Partial 16S rRNA gene sequences of selected A. oris and A. naeslundii isolates identified as outliers to the main species groups were determined. A Neighbor-joining tree was constructed in MEGA4 and bootstrap values calculated based on analysis of 1000 resampled datasets. The tree included the sequences determined here and the sequences for the type strains of A. viscosus (X82453), A. naeslundii (X81062), A. johnsonii (AB545933.1) and A. oris (GQ421308).
The fimA and fimP sequences
These sequences were trimmed and edited using BioEdit. The derived sequences were aligned with fimA gene of four A. naeslundii genospecies 2 strains [A. oris] (DQ425102, DQ425099, DQ425101 and AF019629) and three A. naeslundii genospecies 1 strains [A.
naeslundii] (DQ425097, DQ425098 and DQ425100). The fimA sequence of A. odontolyticus strain PK984 (DQ425103) was also included in these analyses as were the fimP gene sequences of three A. naeslundii genospecies 2 strains [A. oris] (AF106053, AF107019 and AF107020), human ‘A. viscosus’ ATCC19249 (AF106034) and the fimA and fimP of A. oris MG-1. Neighbor-joining trees were constructed in MEGA4 for the fimA and fimP partial gene sequences and bootstrap values calculated based on analysis of 1000 resampled datasets.
Binding assays
The strains selected for these assays were cultured anaerobically at 37uC on Fastidious Anaerobe Agar (LabM, Bury, UK) supplemented with 5% (v/v) defibrinated horse blood and single colonies transferred to brain-heart infusion broth and grown anaerobically for 2 days. These cultures were used to inoculate Todd Hewett Broth (Oxoid) and grown anaerobically for 2 days. The cells were harvested by centrifugation (2000 g for 10 min), washed and resuspended in 1–3 ml saliva buffer (2 mM KH2PO4/
K2HPO4, 50 mM KCL, 1 mM CaCl2, 0.1 mM MgCl2)
contain-ing 0.02% NaN3and stored at 4uC prior to use.
Parotid saliva was obtained from a volunteer using a sterilized Lashley suction cup placed over the opening of a Stenson’s duct; parotid saliva flow was stimulated by sucking on a sugar-free lemon sweet (Simkins, Sheffield, UK). Ethical permission for the collection of human parotid saliva was obtained from the Ethics Committee of Guy’s and St Thomas Hospital Foundation Trust. Written consent for the collection of the saliva sample was obtained.
A proline-rich protein (PRP)-enriched fraction was obtained from parotid saliva by boiling to remove amylase [21], selective adsorption of statherin with hydroxyapatite [22] and precipitation of histatins with ZnCl2 [23]. The predominance of PRPs in the
resulting preparation was confirmed by SDS-PAGE and Coo-massie Blue staining. Gel and sol phases of purified human MUC5B (high molecular weight salivary mucin, MG1) and an Table 1. Primers used for the amplification and sequencing of the fimA and fimP genes.
PCR
target Primers
Primary primer sequence sets (59-39) Sequencing primers (59-39) bp fimA fimA-F (forward) 1.CCAAGCCCTTCGTGGT 2.CATCCACAAGCACCTCA 3.GGYRACATCGTCCAGAAG 4.MMTGGMTCTACGAYGTCM 5.GGGCGTCGGGCTGC 6.CRCAGCCGGTGTCCTC MACGTCTACCCYAAGAAC 659 fimA-R (reverse) 1.CGGAACCGACTGCTTG 2.CBGGWGCCTTGGWCTCA 3.ACCGGTCAGGGGCAG 4.GCGGTCAGGATGAGCAT 5.GACGGCGATCATCAGCAG 6.CBGGWGCCTTGGTCTC GCCTTGGTCTCVACCAG
fimP fimP-F 1.GTGCGARCAGACCGACA 2.CCKACGASGGCTGGAARAC 3.CCCGCTGACCCGAAC 4.TCACCATCACCAAGCTGAAC CCACGTCTACCCCAAGAA 679 fimP-R 1.SACGAGGCAGTAGTAGTCMT 2.GCTTGTTGGCGTAGGC 3.TCAGCTGGTCCTTCTTC 4.AGCCAGGACCCGGAAG 5.TTCTTCTCGGCCTTCTCAG 6.CGCAGGTAGTTGATCTCCA GGGGGCCTTGGTCTC doi:10.1371/journal.pone.0021430.t001
enriched sol fraction of MUC7 (low molecular weight salivary mucin, MG2) were prepared as previously described [24,25]. Protein concentrations were measured using a Pierce BCA kit with a BSA standard (Thermo Scientific). In the case of mucins, the figures were adjusted to take into account their protein percentages [26] for total concentrations.
Saliva and salivary proteins were coated on to MaxiSorb plates (Thermo Scientific) by overnight incubation of dilutions in buffer at 100ml per well. The PRP fraction were used respectively at concentrations of 4.0, 0.25 and 0.25mg/ml in 0.1 M NaHCO3/
NaCO3buffer, pH 9.6, at 4uC. The MUC5B gel and sol phases
and the MUC 7 fraction were used at concentrations of 110, 40 and 1.0mg/ml respectively in phosphate-buffered saline (PBS) at room temperature. All plates were washed 46 with PBS containing 0.1% Tween 20 (PBS-T). Microwell plates coated with 2.5mg/ml of human statherin were prepared as previously described [27] except that the statherin was coated by overnight incubation in sodium carbonate buffer (pH 9.6).
For the attachment experiments plates the PRP fraction were prepared in saliva buffer with and without 25 mM lactose [28,29].
With mucin-coated plates the Actinomyces were resuspended in PBS-T at a concentration of approximately 56108 per ml. The latter buffer was also used for subsequent washing steps with all these types of plate. For the statherin plates, Tris-buffered saline (TBS) containing 1 mM CaCl2 and 0.1% Tween was used to
resuspend bacteria and subsequent washing steps. Duplicate aliquots (100ml) of the bacterial suspensions were used, the plates were incubated at 37uC for 60 min to allow bacterial attachment, the supernatants decanted and the plates washed 46 with buffer. Attached bacteria were stained [30] by incubation at 37uC for 30 min with 100ml of a 5mM solution of SYTO 13 (Invitrogen, Paisley, UK). The dye was removed and the fluorescence determined (Labsystems Fluoroskan, Thermo Scientific). To standardize the attachment experiments, initial fluorescence measurements were made with serial dilutions in 100ml of saliva in the wells of microplates. The bacteria were spun down (2750 g for 30 min at 15uC) and the cells stained with SYTO 13. For subsequent experiments, bacteria were diluted to give a calculated fluorescence of 100 arbitrary units if complete attachment were achieved; in all assays background fluorescence, measured in the
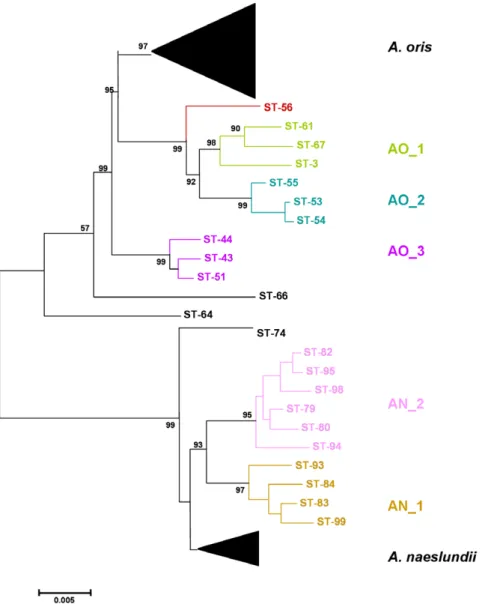
Figure 1. Neighbor-Joining tree of concatenated sequences of the 7 house-keeping genes ofA. naeslundiiandA. oris. Bar is 0.005 substitutions per site.
absence of labeled bacteria, was subtracted from test fluorescence values. For each type of plate coating, attachment measurements were made with 3 separate cultures of each strain used.
Results
The 37 A. naeslundii isolates were assigned to 32 unique allelic profiles (STs) while all 68 A. oris isolates yielded unique STs. A neighbor-Joining tree of the concatenated sequences from both species is shown in Fig. 1. The majority of A. naeslundii STs formed a single cluster which contained the A. naeslundii type strain and two additional clusters, AN_1 of 4 STs and AN_2 of 7 STs, were evident supported by bootstrap values of .90% with ST-74 on the periphery of the cluster. A greater level of diversity was found with
the A. oris STs in which the majority of STs formed a single cluster which contained the A. oris type strain and addition discrete clusters labeled AO_1 to AO_3 and with ST-56, ST-66 and ST-64 on the periphery of the A. oris clusters. Analysis of the ST data using ClonalFrame produced similar relationships between the A. oris STs (Fig. 2). AO_1 to AO_3 identified but STs 66 and 64, were apparently more closely related to A. naeslundii than to A. oris and ST-56 more closely related to A. oris but still peripheral. The clusters, AN_1 and AN_2, were discrete but ST-74 was within the A. naeslundii cluster containing the type strain of the species.
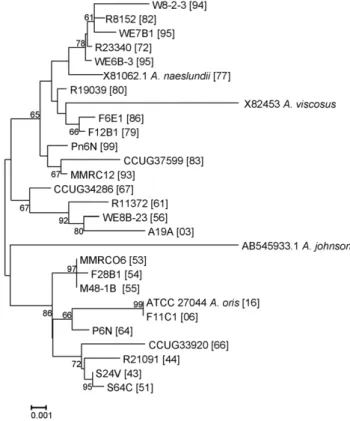
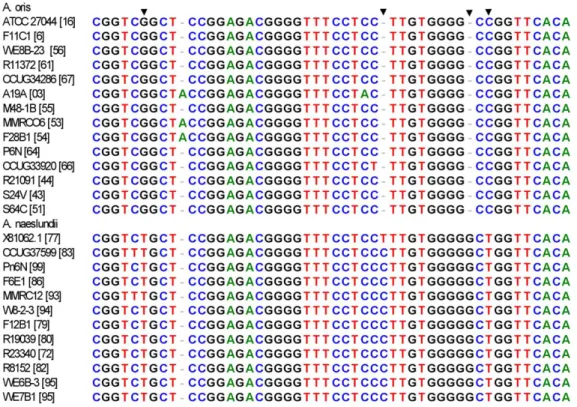
A neighbor-joining tree based on alignment of the 16S rRNA sequences of the selected STs, those not within the major groupings of the two species, is shown in Fig. 3. Overall the strains originally assigned to either A. oris or A. naeslundii formed two clusters but the bootstrap value supporting this division was not high. However, all the strains in the clusters AO_1 to AO_3 and STs 56, 66 and 64 were in a cluster with the type strain of A. oris. All strains in the clusters AN_1 and AN_2 and ST 74 were in a cluster that contained the type strain of A. naeslundii but also the type strain of A. viscosus. When the partial 16S rRNA sequences of the A. oris and A. naeslundii isolates were inspected a region that enabled differentiation between these species was identified (Fig. 4). Within the A. naeslundii cluster there were no sub-clusters that were congruent with the clusters observed in Fig. 1, however, some degree of congruence was apparent within the A. oris strains. Thus the strains in AN_1 formed a loose cluster in Fig. 3 which also included ST-56 while clusterAN_2 was discrete in both analyses as
Figure 2. 50% majority-rule consensus tree derived using ClonalFrame. Six ClonalFrame runs were conducted using the default settings, the initial 50,000 iterations were discarded and the next 50,000 iterations were sampled at every 100th generation was sampled.
Therefore, 501 trees per run were calculated and the data of the six runs were combined and the consensus tree was drawn in MEGA4 [19]. Scale is coalescent units.
doi:10.1371/journal.pone.0021430.g002
Figure 3. Neighbor-Joining tree of partial 16S rRNA gene sequences. Approximately 1400 bp sequences of 16S rRNA genes selected A. naeslundii and A. oris strains indicated by strain name and [sequence type] were determined. Sequences of A. naeslundii (X81062.1; ST77), A. viscosus (X82453), A. johnsonii (AB545933.1) and A. oris (GQ421308; ST16) type strains were included for comparative purposes. STs 1–68 are A. oris and 69–100 are A. naeslundii. Only bootstrap values of .60 are shown for clarity. Bar is 0.001 substitutions per site. doi:10.1371/journal.pone.0021430.g003
was AN_3 but which also included ST-66. ST-64 was more closely related to A. oris ATCC 27044, the type strain for the species.
The 16S rRNA sequence confirmed the allocation of isolates to A. oris and A. naeslundii on the basis of house-keeping genes. However, analysis of the concatenated sequences of 7 house-keeping genes, by neighbor-joining trees and ClonalFrame analysis, suggested that there existed within both species phylogentically distinct clusters which might constitute subspecies and this was supported, at least within the A. oris by a comparison of the partial 16S rRNA sequences. To investigate this further, we determined partial sequences of fimA and fimP to determine if the same phylogenetic relationships could be demonstrated using these genes for extracellular proteins.
The neighbor-joining tree based on partial fimA sequences of the A. oris, A. naeslundii, A. johnsonii, A. viscosus and A. odontolyticus are shown in Fig. 5. The major A. oris cluster identified in Fig. 1 was discrete but split into two subclusters. A.oris_a contained the sequence from the A. oris type strain and the sequences DQ425099 and DQ425102 while the A.oris_b contained the sequence from MG-1 and the sequence DQ425101. The fimA sequence from ST-56 was peripheral to these clusters. Strains in AO_1 and AO_2 were present in discrete clusters in the fimA tree while AO_3 was also present in a discrete cluster that contained the A. odontolyticus fimA sequence DQ425103. The remaining A. oris STs, 64 and 66, formed a cluster which included DQ425097 which was closely related to, but distinct from, the fimA sequences of A. naeslundii. The strains from clusters AN_1 and AN_2 also formed distinct clusters distinct from both the major A. oris and A. naeslundii clusters. ST-99, a member of the AN_1 cluster was now grouped within the major A. naeslundii cluster. The sequences from the A. johnsonii strains formed a discrete cluster and the sequence from the A. viscosus type strain was discrete and the sequence from ST-41 was on the periphery of the major A. naeslundii cluster.
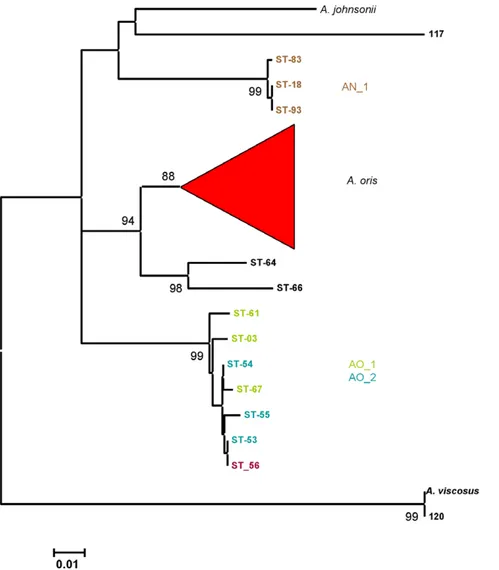
The neighbor-joining tree based on the partial fimP sequences is shown in Fig. 6. The A. johnsonii and A. viscosus strain sequences were discrete from those of A. oris and A. naeslundii. Gene fimP was only detected in 3 STs identified as A. naeslundii and these all corresponded to 3 of the 4 STs in AN_1. The other member of AN_1, ST-99, which also harbored a fimA different to that of the other members of AN_1 did not reveal fimP. A single cluster consisting of the STs in AO_1, AO_2 and ST-56 was evident, discrete from the major A. oris cluster. Strains in AO_3 did not harbor fimP. Two STs, 64 and 66, were discrete and on the periphery of the major A. oris cluster.
Actinomyces binding to salivary proteins
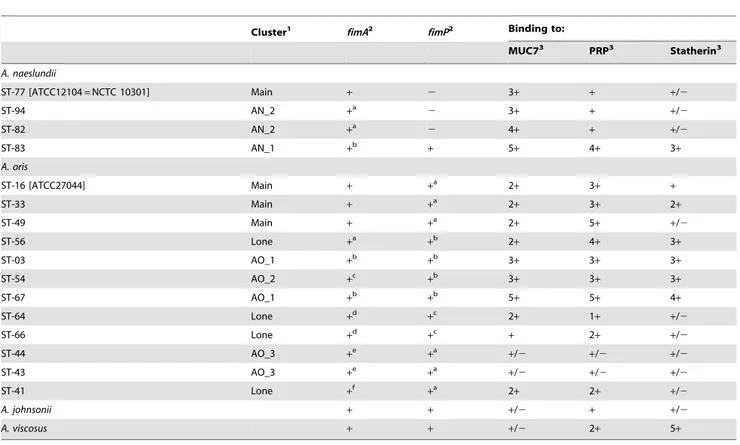
The A.naeslundii STs 83 (AN_1), 82 and 94 (AN_2) and the A. naeslundii type strain all bound to MUC7 (Fig. 7) but only ST-83 bound to a significant extent to both the PRP preparation and to statherin. A. oris strains ST-33 and 49 as well as the type strain bound to both MUC7 and the PRP preparation but only weakly to statherin. ST56, ST-3 (AN_1) and STs 54 and 67 (AN_2) exhibited high binding to MUC7, the PRP preparation and to statherin while STs 64 and 66 exhibited only weak binding to MUC7 and the PRP preparation. The two members of AO_3 examined (STs 44 and 43) exhibited very low binding to all salivary proteins. A. oris ST-41 exhibited binding only to MUC7 and the PRP preparation. The A. johnsonii type strains exhibited very low binding to all salivary proteins while the A. viscosus type strains exhibited high binding to statherin, no binding to MUC7 and low binding to the PRP preparation. The patterns of binding observed with MUC7 were also apparent with the MUC5B gel and sol preparations. The ability of the selected strains to bind to the salivary proteins, their cluster identity and the presence of fimA and fimP are summarized in Table 2.
Figure 4. 16S rRNA signature differentiatingA. naeslundiiandA. oris16S rRNA sequences. 16S rRNA sequences were aligned using BioEdit [18] and visually compared to detect sequence signatures that differentiated bewteen the species. Figure lists strain names and [ST]. The first base is base 1010 in 16S rRNA sequence of A. naeslundii NCTC 10301 (X81062). Signature bases are marked with arrowheads.
Discussion
The taxonomy of the Actinomyces ‘‘viscosus-naeslundii’’ group has been the subject of much research in order to find valid and reproducible methods to differentiate between these species which were isolated from both humans and rodents. Phenotypic methods to discriminate between these species have proved elusive [5] although for a time A. viscosus was, incorrectly, differentiated from A. naeslundii on the basis of catalase production [6]. Serological methods were applied to the discrimination of these species [7] but it was not until the extensive taxonomic study of Johnson and colleagues [5] that these serological data could be understood in relation to a definite taxonomy. Thus by applying DNA-DNA homology it was shown that human strains of ‘‘viscosus-naeslundii’’ group were divided in three different species as the DNA homology between them was ,70% [5]. The proposed classification was: A. naeslundii genospecies 1, A. naeslundii
genospecies 2 and the separate Actinomyces serotype WVA 963. The animal strain was classified as A. viscosus. In that study, these four taxa shared between 26 to 44% DNA relatedness to each other. A slightly higher similarity was found between A. viscosus and A. naeslundii genospecies 1 (55%). Furthermore, it was shown that within A. naeslundii genospecies 2, strains from A. naeslundii serotypes II, NV and A. viscosus serotype II were closer related to each other (63 to 79%) than to A. naeslundii serotype III (51 to 62%). Subsequently, antisera were used in many studies [1,10] to identify A. naeslundii from the human oral cavity as genospecies 1 or 2. 16S rRNA sequence analysis was widely used to identify many taxa but this approach was reported previously to be suitable for the discrimination of A. oris and A. naeslundii. However, our analysis here shows that there are limited but discrete sequence differences between these species and that these human species are separable but with a low bootstrap value. However, we [2] previously used a concatenated gene sequencing approach to discriminate between
Figure 5. Neighbor-joining tree showing relationships betweenfimAsequences. Partial fimA sequences of A. oris, A. naeslundii, A. johnsonii and A. viscosus strains were determined, aligned using BioEdit [18] and a neighbour-joining tree was calculated and visualised using MEGA4. Strain 117 is an additional A. johnsonii strain, see Table S1.
doi:10.1371/journal.pone.0021430.g005
Figure 6. Neighbor-joining tree showing relationships betweenfimPsequences. Partial fimA sequences of A. oris, A. naeslundii, A. johnsonii and A. viscosus strains were determined, aligned using BioEdit [18] and a neighbour-joining tree was calculated and visualised using MEGA4. fimP sequence 120 is from A. viscosus ATCC19246 [AF106034]. Strain 117 is an additional A. johnsonii, see Table S1.
strains identified as A. naeslundii and were able to amend the description of A. naeslundii (genospecies 1) and described new species A. oris (genospecies 2) and A. johnsonii (WVA 963).
Here we describe some of the divergence present within A. oris and A. naeslundii using an MLST approach supplemented with an analysis of the partial sequences of fimA and fimP genes. Within both species discrete clusters, characterized by high bootstrap values, were identified and a significant proportion of the collection of each species was present in these discrete clusters. Examination of the Neighbor-joining or ClonalFrame dendro-grams suggests that the strain collection we had investigated was an under-represented of the total population since, at least, STs 56, 64 and 66 appear to represent discrete clusters of strains not well represented in the collection.
Previously the fimA gene, the major subunit of type-2 fimbriae, was sequenced in four strains for each ‘‘A. naeslundii genospecies 1 and 2’’ revealing conserved regions as well as sequence differences [9]. The fimP gene, major subunit of type-1 fimbriae, was obtained from four strains of ‘‘A. naeslundii genospecies 2’’ and a human ‘‘A. viscosus’’ strain [31]. The fimA and fimP genes are distinct from the housekeeping genes used to construct the neighbor-joining tree. However, the relationships between the STs in the house-keeping gene tree and the fimA tree are very similar. Thus STs in AN_1 and AN_2 form discrete clusters in the fimA tree distinct from the
main A. naeslundii cluster although ST-99 [AN_1] harbored a fimA gene indistinguishable from that of the majority of A. naeslundii strains. Similarly with the A. oris strains AO_1, AO_2 and AO_3 formed discrete clusters with fimA although AO_3 formed a cluster with the A. odontolyticus fimA sequence [DQ425103]. This suggests that this gene was acquired by horizontal gene transfer from A. odontolyticus while ST-99 appears to have acquired a fimA gene from a member of the main A. naeslundii cluster supporting our earlier observation of horizontal gene transfer between A. oris an A. naeslundii [32]. The two STs 64 and 66, which on the basis of the neighbor-joining tree were more similar to A. oris while the ClonalFrame analysis suggested they were more closely related to A. naeslundii formed a small cluster adjacent to the A. naeslundii fimA sequences which also included the sequence of P-5-N1 [DQ425097]. The sequence of A. oris ST-41 was closely related to that of A. naeslundii. The A. johnsonii and A. viscosus sequences were discrete while the sequence of ST-56, a lone ST in the neighbor-joining analysis, was also discrete but closely related to the A. oris cluster.
Type-1 fimbriae (fimP) were mainly found in ‘‘A. naeslundii genospecies 2’’ and may be necessary for early colonization of the tooth through binding to the acquired pellicle. They promote protein-protein binding to tooth-adsorbed salivary acidic proline-rich proteins (PRPs) and statherin [33–35]. Bacteria only bind to
Figure 7. Relative attachment of actinomyces strains to salivary proteins. Bacteria were bound to salivary proteins and saliva preparations and labelled using the fluorescent stain SYTO 13. Bacterial cell binding was normalised such that maximum was 100 and equivalent to all added bacteria binding to substrate. The substrates were (A), a preparation of proline-rich proteins in the presence of lactose (B) MUC7 and (C) statherin. An is the A. naeslundii type strain [ST 77], Ao is the A. oris type strain [ST 16], Aj is the A. johnsonii type strain and Av is the A. viscosus type strain. doi:10.1371/journal.pone.0021430.g007
Table 2. Summary of the ST binding characteristics.
Cluster1
fimA2
fimP2 Binding to: MUC73 PRP3 Statherin3 A. naeslundii ST-77 [ATCC12104 = NCTC 10301] Main + 2 3+ + +/2 ST-94 AN_2 +a 2 3+ + +/2 ST-82 AN_2 +a 2 4+ + +/2 ST-83 AN_1 +b + 5+ 4+ 3+ A. oris ST-16 [ATCC27044] Main + +a 2+ 3+ + ST-33 Main + +a 2+ 3+ 2+ ST-49 Main + +a 2+ 5+ +/2 ST-56 Lone +a +b 2+ 4+ 3+ ST-03 AO_1 +b +b 3+ 3+ 3+ ST-54 AO_2 +c +b 3+ 3+ 3+ ST-67 AO_1 +b +b 5+ 5+ 4+ ST-64 Lone +d +c 2+ 1+ +/2 ST-66 Lone +d +c + 2+ +/2 ST-44 AO_3 +e +a +/2 +/2 +/2 ST-43 AO_3 +e +a +/2 +/2 +/2 ST-41 Lone +f +a 2+ 2+ +/2 A. johnsonii + + +/2 + +/2 A. viscosus + + +/2 2+ 5+ 1
Clusters as identified in Figure 1.
2
Within each species the superscripts for fimA and fimP designate different partial fimA or fimP gene sequences.
3
Binding scores are an arbitrary range from 2 to 5+. doi:10.1371/journal.pone.0021430.t002
PRPs when the proteins are bound to a surface at which they undergo a conformational change [36]. Furthermore, different ‘‘A. naeslundii genospecies 2’’ strains exhibited varied binding to either PRPs or statherin [37]. Type-2 fimbriae (fimA) were identified in both A. naeslundii genospecies 1 and 2 [38]. This type of fimbriae binds to b-linked galactose and galactosamine structures [39] and thus facilitates binding to glycolipids and glycoproteins on surfaces of epithelial cells and bacteria [40,41] as well as to the enamel pellicle [37]. Binding via the type-2 fimbriae is lactose inhibited. fimP is not present in the majority of A. naeslundii strains and here we only detected it in the three strains of AN_1. This sequence was distinct from all other fimP sequences. STs of AO_1 and AO_2 and ST-56 possessed highly similar fimP sequences, distinct from those of the main A. oris cluster, as did the two lone STs 64 and 66. Members of AO_3 were similar to those of the major group of A. oris strains. A. viscosus and A. johnsonii were distinct from all other sequences.
The binding properties of the selected strains overall mirrored the presence of the particular fimbriae genes. Thus, A. naeslundii STs 77, 94 and 82 adhered to well MUC7 while exhibiting only a low ability to bind to the PRP preparation or statherin. A. naeslundii ST-83, which possessed both fimA and fimP gene adhered well to all three salivary preparations. Although all A. oris STs possessed both fimA and fimP a number of different binding profiles were observed. Thus, members of the main A. oris cluster, AO_1 and AO_2 tended to adhere to all substrates, as did ST-56 while both AO_3 strains exhibited very low binding. The lone STs, 41, 64 and 66 exhibited overall low binding to the three saliva
preparations as did A. johnsonii but A. viscosus exhibited high binding to statherin as has been previously reported.
In conclusion these data clearly demonstrate considerable population diversity within each of the species A. oris and A. naeslundii and show that there is a phenotypic basis to the clusters generated by the analysis of the concatenated sequences of 7 housekeeping genes. The population structure was congruent with that obtained by an analysis of the fimA and fimP partial gene sequences. It is inappropriate to attempt to assign names to these discrete clusters but these data provide a basis for further study to accurately plot the establishment and distribution of these organisms in the human mouth and perhaps to better understand their role in the health of the oral cavity. The phylogenic relationships between these clusters may be elucidated by the application of whole genome sequence comparison techniques [42].
Supporting Information
Table S1 Allelic profiles and sequence types of the A.
oris and A. naeslundii strains. (DOC)
Author Contributions
Conceived and designed the experiments: UH DB SC. Performed the experiments: UH TD SCG DC. Analyzed the data: DB UH TD SC. Contributed reagents/materials/analysis tools: AL CW. Wrote the paper: DB UH TD DR.
References
1. Bowden GH, Nolette N, Ryding H, Cleghorn BM (1999) The diversity and distribution of the predominant ribotypes of Actinomyces naeslundii genospecies 1 and 2 in samples from enamel and from healthy and carious root surfaces of teeth. J Dent Res 78: 1800–1809.
2. Henssge U, Do T, Radford DR, Gilbert SC, Clark D, et al. (2009) Emended description of Actinomyces naelsundii and descriptions of Actinomyces oris sp. nov. and Actinomyces johnsonii sp. nov., previously identified as Actinomyces naeslundii genospecies 1, 2 and WVA 963. Int J Syst Evol Microbiol 59: 509–516. 3. Li J, Helmerhorst EJ, Leone CW, Troxler RF, Yaskell T, et al. (2004)
Identification of early microbial colonizers in human dental biofilm. J Appl Microbiol 97: 1311–1318.
4. Hall V, Talbot PR, Stubbs SL, Duerden BI (2001) Identification of clinical isolates of actinomyces species by amplified 16S ribosomal DNA restriction analysis. J Clin Microbiol 39: 3555–3562.
5. Johnson JL, Moore LV, Kaneko B, Moore WE (1990) Actinomyces georgiae sp. nov., Actinomyces gerencseriae sp. nov., designation of two genospecies of Actinomyces naeslundii, and inclusion of A. naeslundii serotypes II and III and Actinomyces viscosus serotype II in A. naeslundii genospecies 2. Int J Syst Bacteriol 40: 273–286. 6. Ellen RP (1976) Establishment and distribution of Actinomyces viscosus and
Actinomyces naeslundii in the human oral cavity. Infect Immun 14: 1119–1124. 7. Putnins EE, Bowden GH (1993) Antigenic relationships among oral
Actinomy-ces isolates, ActinomyActinomy-ces naeslundii genospecies 1 and 2, ActinomyActinomy-ces howellii, Actinomyces denticolens, and Actinomyces slackii. J Dent Res 72: 1374–1385. 8. Hallberg K, Hammarstro¨m KJ, Falsen E, Dahle´n G, Gibbons RJ, et al. (1998)
Actinomyces naeslundii genospecies 1 and 2 express different binding specificities to N-acetyl-beta-D-galactosamine, whereas Actinomyces odontolyticus expresses a different binding specificity in colonizing the human mouth. Oral Microbiol Immunol 13: 327–336.
9. Drobni M, Hallberg K, Ohman O, Birve A, Persson K, et al. (2006) Sequence analyses of fimbriae subunit FimA proteins on Actinomyces naeslundii genospecies 1 and 2 and Actinomyces odontolyticus with variant carbohydrate binding specificities. BMC Microbiol 6: 43.
10. Brailsford SR, Lynch E, Beighton D (1998) The isolation of Actinomyces naeslundii from sound root surfaces and root carious lesions. Caries Res 32: 100–106. 11. Bowden G, Johnson J, Schachtele C (1993) Characterization of Actinomyces with
genomic DNA fingerprints and rRNA gene probes. J Dent Res 72: 1171–1179. 12. Hallberg K, Holm C, Hammarstrom KJ, Kalfas S, Stromberg N (1998) Ribotype diversity of Actinomyces with similar intraoral tropism but different types of N-acetyl-beta-D-galactosamine binding specificity. Oral Microbiol Immunol 13: 188–192.
13. Hall V, O’Neill GL, Magee JT, Duerden BI (1999) Development of amplified 16S ribosomal DNA restriction analysis for identification of Actinomyces species
and comparison with pyrolysis-mass spectrometry and conventional biochemical tests. J Clin Microbiol 37: 2255–2561.
14. Ximenez-Fyvie LA, Haffajee AD, Martin L, Tanner A, Macuch P, et al. (1999) Identification of oral Actinomyces species using DNA probes. Oral Microbiol Immunol 14: 257–265.
15. Maiden MCJ, Bygraves JA, Feil E, Morelli G, Russell JE, et al. (1998) Multilocus sequence typing: A portable approach to the identification of clones within populations of pathogenic microorganisms. Proc Natl AcadSci U S A 95: 3140–3145.
16. Aas JA, Paster BJ, Stokes LN, Olsen I, Dewhirst FE (2005) Defining the normal bacterial flora of the oral cavity. J Clin Microbiol 43: 5721–5732.
17. Lane DJ (1991) 16S/23S rRNA sequencing. In: Nucleic Acid Techniques in Bacterial Systematics 115–175, Stackebrandt E, Goodfellow M, eds. Chichester: Wiley.
18. Hall T (1999) BioEdit: a user-friendly biological sequence alignment editor and analysis program for Windows 95/98/NT. Nucleic Acids Symposium Series 41: 95–98.
19. Tamura K, Dudley J, Nei M, Kumar S (2007) MEGA4: Molecular Evolutionary Genetics Analysis (MEGA) software version 4.0. Mol Biol Evol 24: 1596–1599. 20. Didelot X, Falush D (2007) Inference of bacterial microevolution using
multilocus sequence data. Genetics 175: 1251–1266.
21. Proctor GB, Pramanik R, Carpenter GH, Rees GD (2005) Salivary proteins interact with dietary constituents to modulate tooth staining. J Dent Res 84: 73–78.
22. Jensen JL, Lamkin MS, Oppenheim FG (1992) Adsorption of salivary proteins to hydroxyapatite: a comparison between whole saliva and glandular secretions. J Dent Res 71: 1569–1576.
23. Flora B, Gusman H, Helmerhorst EJ, Troxler RF, Oppenheim FG (2001) A new method for the isolation of histatins 1, 3 and 5 from parotid secretion using zinc precipitation. Protein Expr Purif 23: 198–206.
24. Wickstro¨m C, Christersson C, Davies JR, Carlstedt I (2000) Macromolecular organization of saliva: identification of ‘insoluble’ MUC5B assemblies and non-mucin proteins in the gel phase. Biochem J 351: 421–428.
25. Wickstro¨m C, Hamilton IR, Svensa¨ter G (2009) Differential metabolic activity by dental plaque bacteria in association with two preparations of MUC5B mucins in solution and in biofilms. Microbiology 155: 53–60.
26. Levine MJ, Reddy MS, Tabak LA, Loomis RE, Bergey EJ, et al. (1987) Structural aspects of salivary glycoproteins. J Dent Res 66: 436–441. 27. Jelani T, Leito D, Ligtenberg AJM, Nazmi K, Veerman ECI (2009)
Identification of salivary components that induce transition of hyphae to yeast in Candida albicans. FEMS Yeast Res 9: 1102–1110.
28. Qureshi JV, Gibbons RJ (1981) Differences in the adsorptive behavior of human strains of Actinomyces viscosus and Actinomyces naeslundii to saliva-treated hydroxyapatite surfaces. Infect Immun 31: 261–266.
29. Cisar JO, David VA, Curl SH, Vatter AE (1984) Exclusive presence of lactose-sensitive fimbriae on a typical strain (WVU45) of Actinomyces naeslundii. Infect Immun 46: 453–458.
30. Bosch JA, Veerman ECI, Turkenburg M, Hartog K, Bolscher JGM, et al. (2003) A rapid solid-phase fluorimetric assay for measuring bacterial adherence, using DNA-binding stains. J Microbiol Meth 53: 51–53.
31. Li T, Johansson I, Hay DI, Stro¨mberg N (1999) Strains of Actinomyces naeslundii and Actinomyces viscosus exhibit structurally variant fimbrial subunit proteins and bind to different peptide motifs in salivary proteins. Infect Immun 67: 2053–2059.
32. Do T, Henssge U, Gilbert SC, Clark D, Beighton D (2008) Evidence for recombination between a sialidase (nanH) of Actinomyces naeslundii and Actinomyces oris, previously named ‘Actinomyces naeslundii genospecies 1 and 2’. FEMS Microbiol Lett 288: 156–162.
33. Clark WB, Beem JE, Nesbitt WE, Cisar JO, Tseng CC, et al. (1989) Pellicle receptors for Actinomyces viscosus type 1 fimbriae in vitro. Infect Immun 57: 3003–3008.
34. Gibbons RJ, Hay DI (1988) Human salivary acidic proline-rich proteins and statherin promote the attachment of Actinomyces viscosus LY7 to apatitic surfaces. Infect Immun 56: 439–445.
35. Gibbons RJ, Hay DI, Cisar JO, Clark WB (1988) Adsorbed salivary proline-rich protein 1 and statherin: receptors for type 1 fimbriae of Actinomyces viscosus T14V-J1 on apatitic surfaces. Infect Immun 56: 2990–2993.
36. Gibbons RJ (1989) Bacterial adhesion to oral tissues: a model for infectious diseases. J Dent Res 68: 750–760.
37. Stro¨mberg N, Bore´n T, Carle´n A, Olsson J (1992) Salivary receptors for GalNAc beta-sensitive adherence of Actinomyces spp.: evidence for heterogeneous GalNAc beta and proline-rich protein receptor properties. Infect Immun 60: 3278–3286. 38. Cisar JO, Sandberg AL, Mergenhagen SE (1984) The function and distribution of different fimbriae on strains of Actinomyces viscosus and Actinomyces naeslundii. J Dent Res 63: 393–396.
39. Stro¨mberg N, Karlsson KA (1990) Characterization of the binding of Actinomyces naeslundii (ATCC 12104) and Actinomyces viscosus (ATCC 19246) to glycosphin-golipids, using a solid-phase overlay approach. J Biol Chem 265: 11251–11258. 40. Brennan MJ, Cisar JO, Vatter AE, Sandberg AL (1984) Lectin-dependent attachment of Actinomyces naeslundii to receptors on epithelial cells. Infect Immun 46: 459–464.
41. Stro¨mberg N, Bore´n T (1992) Actinomyces tissue specificity may depend on differences in receptor specificity for GalNAc beta-containing glycoconjugates. Infect Immun 60: 3268–3277.
42. Jolley KA, Maiden MC (2010) BIGSdb: Scalable analysis of bacterial genome variation at the population level. BMC Bioinformatics 11: 595.