Contents lists available atScienceDirect
Environment International
journal homepage:www.elsevier.com/locate/envintEstimated health bene
fits of exhaust free transport in the city of Malmö,
Southern Sweden
Ebba Malmqvist
a, Ebba Lisberg Jensen
b, Karin Westerberg
b, Emilie Stroh
a, Ralf Rittner
a,
Susanna Gustafsson
c, Mårten Spanne
c, Henric Nilsson
c, Anna Oudin
a,d,⁎aOccupational and Environmental Medicine, Department for Laboratory Medicine, Lund University, Sweden bDept. of urban studies, Malmö University, Sweden
cEnvironmental Department of the City of Malmö, Sweden
dOccupational and Environmental Medicine, Dept. Public Health and Clinical Medicine, Umeå University, Sweden
A R T I C L E I N F O
Handling Editor: Olga-Ioanna Kalantzi Keywords:
Health impact assessment HIA
Health effects Clean air policy Air pollution
A B S T R A C T
Air pollution is responsible for one in eight premature deaths worldwide, and thereby a major threat to human health. Health impact assessments of hypothetic changes in air pollution concentrations can be used as a mean of assessing the health impacts of policy, plans and projects, and support decision-makers in choices to prevent disease.
The aim of this study was to estimate health impacts attributable to a hypothetical decrease in air pollution concentrations in the city of Malmö in Southern Sweden corresponding to a policy on-road transportations without tail-pipe emissions in the municipality. We used air pollution data modelled for each of the 326,092 inhabitants in Malmö by a Gaussian dispersion model combined with an emission database with > 40,000 sources. The dispersion model calculates Nitrogen Oxides (NOx) (later transformed into Nitrogen Dioxide (NO2)) and particulate matter with an aerodynamic diameter < 2.5μg/m3(PM2.5) with high spatial and temporal resolution (85 m and 1 h, respectively).
The average individual reduction was 5.1 (ranging from 0.6 to 11.8)μg/m3in NO
2,which would prevent 55 (2% of all deaths) to 93 (4%) deaths annually, depending on dose-response function used. Furthermore, we estimate that the NO2reduction would result in 21 (6%) fewer cases of incident asthma in children, 95 (10%) fewer children with bronchitis every year, 30 (1%) fewer hospital admissions for respiratory disease, 87(4%) fewer dementia cases, and 11(11%) fewer cases of preeclampsia every year. The average reduction in PM2.5of 0.6 (ranging from 0.1 till 1.7)μg/m3would mean that 2729 (0.3%) work days would not be lost due to sick-days and that there would be 16,472 fewer restricted activity days (0.3%) that year had all on-road transportations been without tail-pipe emissions.
Even though the estimates are sensitive to the dose-response functions used and to exposure misclassification errors, even the most conservative estimate of the number of prevented deaths is 7 times larger than the annual traffic fatalities in Malmö, indicating a substantial possibility to reduce the health burden attributed to tail-pipe emissions in the study area.
1. Introduction
During the last decades, epidemiological and toxicological studies have provided enough evidence for the conduction of health impact assessments (HIA) of air pollution (WHO, 2013a, 2013b). Whilst epi-demiologists often study the risk of a disease in the presence of ex-posure relative to the risk of a disease in the absence of exex-posure, a risk assessor, on the other hand, often asks how many excess cases of disease
will occur in a population of a certain size due to exposure at a certain dose level (Hertz-Picciotto, 1995)? HIA generally applies a health im-pact function combining a risk estimate from the epidemiology litera-ture that relate hypothesized air quality changes to a population at risk (Fann et al., 2011). HIA are used for example in large projects such as the Global Burden of Disease by WHO where air pollution is now valued as one of the largest health threats of our time, responsible for one in eight premature deaths worldwide (Cohen et al., 2004; WHO, 2011,
https://doi.org/10.1016/j.envint.2018.05.035
Received 21 December 2017; Received in revised form 16 May 2018; Accepted 16 May 2018
⁎Corresponding author at: Occupational and Environmental Medicine, Medicon Village, Building 402 A, Scheelevägen 2, 223 63 Lund, Sweden.
E-mail address:anna.oudin@umu.se(A. Oudin).
Abbreviations: HIA, health impact assessments; PM10, particulate matter with an aerodynamic diameter < 10μg/m3; PM2.5, particulate matter with an aerodynamic
diameter < 2.5μg/m3; NO
2, nitrogen dioxide; NOx, nitrogen oxides; ERFs, exposure response functions; RAD, restricted activity days
Available online 26 May 2018
0160-4120/ © 2018 Published by Elsevier Ltd.
2014). There were roughly equal contributions from household air pollution and ambient particulate matter pollution.
HIA can also be used as a systematic process to determine the po-tential health effect of i.e. air pollution from proposed policies, plans, programs or projects and can provide recommendations on monitoring and managing those effects (Chart-asa and Gibson, 2015). Results from HIA can thereby be a useful tool for policymakers and urban planners (Harris-Roxas and Harris, 2011; Shojaei et al., 2014). For example, Castro and colleagues estimated the health impacts attributable to a decrease in particulate matter with an aerodynamic diameter < 10μg/ m3(PM10) and Nitrogen Dioxide (NO2) concentrations due to certain policy measures to be about 1% to 2% of total all-cause annual mor-tality in the population of the Agglomeration Lausanne-Morges in Switzerland (Castro et al., 2017).
In the city of Malmö, Southern Sweden, questions are raised, poli-tically and within different parts of the municipality, if it is worth the effort to work on improving air quality. The city of Malmö has had problems complying with EU Air Quality Guidelines for NO2in the past, and have had action plans since 2006 to reduce emissions, but the city now complies with EU Air Quality Guidelines for NO2. Furthermore, the city of Malmö has agreed upon a policy to be fossil-free by the year 2020. The“Fossil-free initiative” is a transportation policy indicating no fossil fuels in on-road transportations used by the municipality. Decision-makers have raised the question of whether there are any health benefits from this policy. The Environmental Department of the city of Malmö therefore needs to quantify health effects of emissions from road traffic in Malmö, corresponding to a policy on on-road transportations without tail-pipe emissions, further referred to as ex-haust-free transport, in the city of Malmö. More specifically, such a policy would imply a complete transition to electric vehicles, or re-placing car transports with somatic energy transports such as cycling or walking. In line with that, our aim was to estimate health impacts of such a policy to assess the possible decreased health effects on citizens exposed to tail-pipe exhausts.
2. Materials and methods 2.1. Study area
The area of study is Malmö municipality. Malmö is Sweden's third largest city with a population of approximately 330,000 (326092) in-habitants. On-road transports and non-road mobile machinery are the largest sources of NO2emissions in Malmö, together they stand for 69% of the 2756 tons of NO2that were emitted in 2016 (Spanne et al., 2017). Around 5000 annual deaths per year can be attributed to air pollution in Sweden. Malmö is one of the cities with the highest levels of air pollution in Sweden (Gustafsson et al., 2014). For many years, the city of Malmö has exceeded the Swedish Air Quality Standards for daily concentrations of NO2(not > 60μg/m3NO2for 7 days/year). The city has made efforts to tackle these problems with a mandatory air quality action plan adopted in 2007 and revised 2011 (Spanne et al., 2017). Compliance with the Swedish air quality standard for daily averages was achieved for thefirst time in 2014 and in 2016 NO2levels only exceeded 60μg/m3for 4 days (Spanne et al., 2017). It should be em-phasized that the air quality in Malmö is generally well within the present-day annual WHO air quality guideline value of 40μg/m3 (WHO, 2005) (Fig. 1). The annual mean NO2concentration was 14μg/ m3in urban background at the City Hall (Rådhuset) monitoring station and 30μg/m3 at the roadside location of Dalaplan in 2016 (Spanne et al., 2017). The NO2levels at the regional background site were 3μg/ m3in 2016. For particulate matter < 2.5μm in aerodynamic diameter (PM2.5) the concentration 2016 are also generally well within current air quality guidelines (annual mean 25μg/m3) with a concentration of 9μg/m3at urban background site and of 12μg/m3at a roadside site (Spanne et al., 2017).
2.2. Modelling hypothetical changes in air pollution concentrations To calculate the hypothetical changes in air pollution concentra-tions of exhaust-free transport in Malmö municipality, we used a Gaussian dispersion model (AERMOD) combined with an emission da-tabase (EDB) with > 40,000 sources. Emissions from surrounding areas such as shipping emissions in the Oresund and emissions from Sealand, Denmark, are included in the EDB. To account for background levels from sources that are more distant, we added the regional background mean levels of 3μg/m3. Dispersion models are based on detailed knowledge of dynamical processes in the atmosphere by incorporating information on emissions and source characteristics, with meteorology to predict ground level concentrations (Holmes and Morawska, 2006). Gaussian dispersion models often rely on a Gaussian plume equation and uses data on emissions, meteorology and pollution concentrations to estimate spatial distribution of pollutant concentrations (Gilliland et al., 2005;de Hoogh et al., 2014). The Gaussian dispersion model was originally designed as an air quality management tool, but has been used widely for estimating long-term exposures (de Hoogh et al., 2014). The advantage of a dispersion model in this context is that we can amend emissions from certain sources to account for policy or planning processes. Dispersion models were used to calculate concentrations of Nitrogen oxides (NOx), PM2.5with high spatial and temporal resolution (85 m and 1 h, respectively).
To convert NOxto NO2we used a formula based on empirical re-lationships between measured NOx and NO2 levels in different en-vironments and over different periods of time for South West Skåne, mainly in Malmö ((Naturvårdsverket), 2005). In this report, a basic formula was formulated. Since 2005, the formula has been refined and the parameters in Malmö have changed in order to obtain a better model. This formula was used here:
= ⎜ ⎛ ⎝ +⎛ ⎝ + ⎞⎠ NO NOx NO 2 0.72 28 142 x
The EDB used and dispersion programs are owned by the city of Malmö. We have previously used this model in many epidemiological studies (Oudin et al., 2009;Malmqvist et al., 2013;Malmqvist et al., 2017). Modelled levels have also been compared to measured levels at residential facades with good correlations for NOx(N = 241, Spearman correlation of 0.8, p < 0.001) (Stroh et al., 2012). For PM2.5, the R2for modelled vs measured level correlations was 0.86 (N = 96) in Malmö (Malmqvist et al., 2016). Individual air pollution concentrations were calculated with OPSIS EnviMan, which is a series of software modules for management of environmental information.
The dispersion model also enables modelling of specific pollutants by stratifying/excluding emissions from on-road traffic tail-pipe ex-haust, wear and tear from tire and roads, marine shipping, wood smoke from residential heating, large-scale incinerators and long-range transported pollutants. Even if tail-pipe emissions were zero, vehicles produce particles from for example brake, wear and tear of tires and road surfaces. However, particles from wear and tear mainly do not affect the NO2or the PM2.5levels, but mostly the PM10levels. Since we based our calculations on PM2.5and NO2, and not PM10, particles from brake, wear and tear of tires and road surfaces were thus not relevant for our calculations.
2.3. Health impact assessment
We linked modelled air pollution concentrations to our study po-pulations by residential geocodes of each individual. We used the whole population residing in the city of Malmö in 2016 (326,092 persons) for the analysis. Data on individual residential geocodes, age and sex were retrieved from Region Skåne (a self-governing administrative region responsible for health care). As descriptive statistics, we calculated the average individual hypothetical air quality change.
Health impacts were calculated with the following formula:
∑
ΔY =Y ·(1−e− )i 0i β x·i
where ΔYi is the change in disease rate for individual i, Yoi is the baseline disease rate for each individual, dependent on age and sex (β) is obtained from the exposure response function (ERF) from the epi-demiology literature, and (xi) is the hypothetical air quality change (on individual-level). The ΔYi:s are then summed over all individuals to obtain the estimated change in the number of health outcomes.
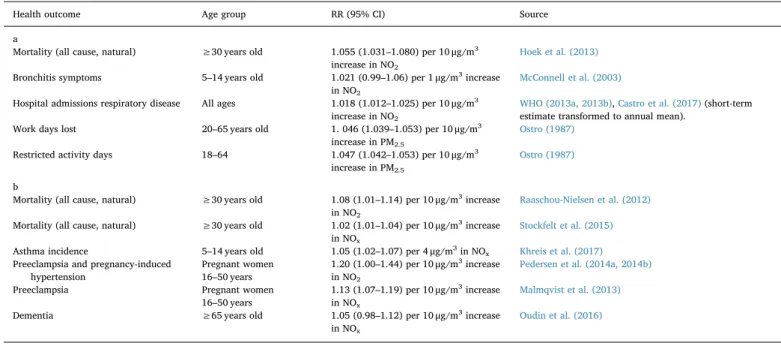
We thus calculated the hypothetical air quality change for each individual. We present outcomes and ERFs recommended by the WHO HRAPIE project (Héroux et al., 2015),Table 1a. The use of several different ERFs can also be used to illustrate uncertainty in estimates, as an alternative to using confidence intervals, as applied for example by Castro and colleagues (Castro et al., 2017). In order to illustrate un-certainty in the estimates, we instead used three different ERFs, similar to what Segersson and colleagues did (Segersson et al., 2017). Thefirst additional ERF we used was obtained from a large Danish study, which has been considered more relevant in a Swedish context than the study used in WHO HRAPIE (Héroux et al., 2015;Hurkmans et al., 2017). We also used an additional ERF from a Swedish study (Stockfelt et al., 2015) which was rather similar to the widely spread European Study of Cohorts for Air Pollution Effects (ESCAPE) estimate (Beelen et al., 2014),Table 1b. These ERFs were chosen because the studies providing them have been conducted in study areas, which in many respects are similar to our study area, Malmö.
In WHO HRAPIE, outcomes related to pregnancy hypertensive dis-orders, dementia, and children's asthma incidence were not taken into account. Since WHO HRAPIE was published, evidence have increased for air pollution effects also on cognitive function and dementia (Power
et al., 2016) on pregnancy hypertensive disorders (Pedersen et al., 2014a, 2014b) and asthma incidence (Bowatte et al., 2015). Hence, we chose to include those outcomes as well,Table 1b.
To attribute relevant health effects to relevant population we used life tables stratified on age and sex for the outcomes where baseline rates depended on age or sex. Furthermore, for each outcome we chose to focus on either NOx/NO2or PM2.5in order to avoid double-counting, although this approach may result in too conservative estimates. For outcomes where ERFs were present for both NOx/NO2and PM2.5we chose to focus on NOx/NO2, since the local contribution to the con-centrations of NOx/NO2is relatively larger than the local contribution of PM2.5.
We obtained baseline health data from different sources. For mor-tality, age-specific natural-cause mortality for the county (Skåne) was obtained from official statistics provided by Swedish Board of Health and Welfare. For bronchitis, we used statistics from Wennergren that 9% (8–10%) of Swedish children between 5 and 14 suffer from asthma (Wennergren, 2015), and international statistics from WHO HRAPIE that 30% of all children with asthma have bronchitis (WHO, 2013a, 2013b). For hospital admissions for respiratory disease we used a baseline rate of 10.1/1000 person-years in Scania from the Swedish Board of Health and Welfare. For calculations on number of sick-days, we used official statistics from the Swedish Board of Health and Welfare the employment rate of 65.9% in the population between 20 and 64 in Malmö, and that the average number of sick-leave days in Malmö is 7.5 days per year. For the calculations of restricted activity days (RAD), we used an international baseline rate from WHO HRAPIE, of 19 RAD per person years (WHO, 2013a, 2013b). For children's asthma in-cidence, we used a baseline incidence of 0.01 per person year from a Swedish study (Rönmark et al., 2002).
For pregnancy outcomes, we studied women 16–50 years (approx. 83,000), applied a county specific pregnancy rate of 3000/83,000) from the Swedish Medical Birth Registry and county specific prevalence of pregnancy hypertension was 4.7% and preeclampsia 3.4% in the Swedish Medical Birth Registry. The age-specific baseline incidence of dementia in people aged 65 or above was assumed according to an international study by Jorm and colleagues (Jorm et al., 1987). The health impact assessments were done with IBM SPSS version 24.
3. Results
The implementation of exhaust-free transport in Malmö would lead to a reduction in NO2of 5.1μg/m3(average of individual-level reduc-tion), ranging from 0.6μg/m3to 11.8μg/m3, see alsoFig. 2. This re-duction would result in 55 to 93 prevented premature deaths in Malmö depending on what ERF was used,Table 2.
According to our calculations, implementing a policy on exhaust-free transport would furthermore mean that 30 cases of incident asthma could be prevented, 95 fewer asthmatic children would get bronchitis, and 30 fewer annual hospital admissions for respiratory disease by lowering NO2levels. The NO2reduction would further mean that 87 incident cases of dementia could be prevented and that 11 women in Malmö would avoid preeclampsia annually.
Exhaust-free transport in Malmö would further result in an average of individual reduction in PM2.5of 0.6 (ranging from 0.1 to 1.7 on in-dividual level)μg/m3. This would mean that 2729 less workdays would be lost annually and that there would be 16,472 fewer restricted ac-tivity days in the city of Malmö had all vehicles been exhaust-free. According to a report by Taavo and colleagues (Taavo, 2016) 0.025 per 1000 people in Malmö died in traffic accidents in the year 2015. This corresponds to around 8 people per year, meaning that a policy on exhaust free transport would save between 7 and 11 times more lives Table 1
a. Assumptions about population, and relative risk (RR) estimates and their 95% confidence interval (95% CI) as applied in the estimation of impacts, using exposure response functions as applied in HRAPIE. b. Assumptions about population, and relative risk (RR) estimates and their 95% confidence interval (95% CI) as applied in the estimation of impacts, using alternative exposure response functions.
Health outcome Age group RR (95% CI) Source
a
Mortality (all cause, natural) ≥30 years old 1.055 (1.031–1.080) per 10 μg/m3
increase in NO2
Hoek et al. (2013)
Bronchitis symptoms 5–14 years old 1.021 (0.99–1.06) per 1 μg/m3increase
in NO2
McConnell et al. (2003)
Hospital admissions respiratory disease All ages 1.018 (1.012–1.025) per 10 μg/m3
increase in NO2
WHO (2013a, 2013b),Castro et al. (2017)(short-term estimate transformed to annual mean).
Work days lost 20–65 years old 1. 046 (1.039–1.053) per 10 μg/m3
increase in PM2.5
Ostro (1987)
Restricted activity days 18–64 1.047 (1.042–1.053) per 10 μg/m3
increase in PM2.5
Ostro (1987)
b
Mortality (all cause, natural) ≥30 years old 1.08 (1.01–1.14) per 10 μg/m3increase
in NO2
Raaschou-Nielsen et al. (2012)
Mortality (all cause, natural) ≥30 years old 1.02 (1.01–1.04) per 10 μg/m3increase
in NOx
Stockfelt et al. (2015)
Asthma incidence 5–14 years old 1.05 (1.02–1.07) per 4 μg/m3in NO
x Khreis et al. (2017)
Preeclampsia and pregnancy-induced hypertension
Pregnant women 16–50 years
1.20 (1.00–1.44) per 10 μg/m3increase
in NO2
Pedersen et al. (2014a, 2014b)
Preeclampsia Pregnant women 16–50 years
1.13 (1.07–1.19) per 10 μg/m3increase
in NOx
Malmqvist et al. (2013)
Dementia ≥65 years old 1.05 (0.98–1.12) per 10 μg/m3increase
in NOx
Oudin et al. (2016)
Fig. 2. Showing the present day NOxlevels (A) and the decline in NOx-levels inμg/m3when implementing a policy on exhaust free transport (B) in the city of Malmö, Sweden. Background levels (of approximately 3μg/m3) are not included.
than if fatal traffic accidents were completely avoided in Malmö. 4. Discussion
This study shows that 55 to 93 premature deaths could be prevented in Malmö each year attributed to a policy on exhaust-free transport in the city of Malmö. This is equivalent to about 2.2% to 3.8% of the total natural-cause annual mortality and at least 7 times larger than the annual number of traffic fatalities in Malmö. This study further esti-mates that 21 cases of incident asthma in children between five and fourteen years, 95 children with bronchitis, 30 hospital admissions for respiratory disease, 87 dementia cases, and 11 cases of preeclampsia every year would be prevented.
Our results are in line with another recent study, where the reduc-tion in premature deaths due to air quality improvements corre-sponding to a 5.6μg/m3reduction in NO
2exposure was estimated to be about 1% to 2% of the total all-cause annual mortality in the Agglomeration of Lausanne-Morges, Switzerland (Castro et al., 2017). The results of the present study were also in line with results from the London Low Emission Zone Baseline Study observing a 5–10% decline in patient consultation for respiratory illnesses or asthma prescriptions after implementing the low emission zone (Kelly et al., 2011). Also, Ballester et al. found that different reductions of PM2.5led to reduced mortality, decreasing the air concentration to 15μg/m3and to 10μg/ m3led to reduced mortality of 1.6% and 3%, respectively (Ballester et al., 2008). Recently co-benefits of climate policies on air pollution and health have been studied: Tobollik et al. studied Green House Gas Mitigation policy in Rotterdam and even though reductions in trans-portation emissions were only 10%, there were some health benefits (Tobollik et al., 2016). Perez et al. investigated different climate miti-gation policies effects on reducing health costs and found most co-benefits from zero-emission vehicles (Perez et al., 2015). Furthermore, in Stockholm a similar estimation has been undertaken resulting in comparable estimates, published as a report in Swedish (Jennie Hurkmans, 2017).
Some calculative uncertainties should be mentioned. First, the source of baseline health data, definitions and study period can highly influence results in health impact assessments (Malmqvist et al., 2018). The importance of the latter has been highlighted in several reviews (Hubbell et al., 2009;Hunter et al., 2014). Generally, this is less of a problem in Europe where consistent data is available, but ICD codes change of the years and study years can influence results. Given the high quality of national register data in Sweden, we consider the quality
of baseline health data to be a strength of the present study. However, for some outcomes, we had to use regional estimates, for the county of Skåne, which could differ somewhat from Malmö estimates, and cause some uncertainties. The largest uncertainty of the health impact as-sessment is most likely with respect to exposure misclassification and ERFs. Bias from exposure misclassification should be mentioned in all studies of health impact assessment of air pollution. We aimed to minimize exposure misclassification by using geocodes of each in-dividual's residential address, with a high spatial resolution (85 × 85 m). It should however be mentioned that people are mobile and do not stay in their homes all the time, which means that a high spatial resolution is not necessarily a better measure of actual exposure than a cruder exposure model. The spatial resolution is always a“give and take” between capturing residential exposure appropriately and taking into account the mobility of the population. The 85 m resolution is a compromise between these aspects. We modelled the air pollution concentrations outdoors, and an individual's actual exposure correlates only moderately with modelled outdoor concentrations at residential addresses (Stroh et al., 2012). That study also showed however, that modelling exposure at the participants' work places did not seem to improve the exposure assessment. Results from a study by Turner and colleagues furthermore suggest that “near-source” PM2.5may have a much stronger association with all-cause mortality than regional PM2.5 (Turner et al., 2016). This may implicate that we have underestimated health effects of reducing local sources of air pollution, since the ERFs used stem from studies where the air pollution is a mix of local and regional sources. The results of Turner and colleagues further highlight the need of studying health effects of air pollution with high spatial resolution, and the need to further study measures to reduce local air pollution. Furthermore, in risk assessments, it is important to use a si-milar exposure assessment method as in the epidemiological studies used for the ERFs. Hence, we used residential addresses, which were generally used in the epidemiological studies where we derived ERFs.
The ERFs used for mortality had a substantial impact on the results, namely that either 55 (2.2%), 64 (2.6%) or 93 (3.8%) of all natural-cause mortality could be prevented with the hypothetical air pollution reduction. We consider the Danish relative risk from Raaschou and colleagues (Raaschou-Nielsen et al., 2012), which resulted in 93 pre-vented deaths, to be relevant for our study area, given that Denmark is similar to southern Sweden in geography as well as socio-demography, composition of air pollution, and welfare systems. The large European ESCAPE project included 22 cohorts (five Swedish cohorts) with a common Land Use Regression modelling method in its study of air pollution and total mortality (Beelen et al., 2014). Land Use Regression modelling are focused on local mainly traffic sources In the ESCAPE study, PM2.5was in the meta-analysis found to be associated with an increased mortality of 14% per 10μg/m3. For NOx, the increased mortality was 2% per 10μg/m3. In an analysis with PM
2.5and NO2 simultaneously, the NO2 result was not changed. The ERF from an earlier study of Norwegian men was very similar to the Danish study, the adjusted mortality risk ratio was 1.08 (95% CI: 1.06–1.11) for a 10μg/m3 increase in average NO
x at the home address from 1974 through 1978 (Nafstad et al., 2004). In another Norwegian study, linear associations between NO2concentrations and all causes of deaths were observed in the population older than 71 years of age (Næss et al., 2006). In a Swedish study of 7494 men however, the association was weaker; the total non-accidental mortality was associated with parti-cipants' NOxexposure in the last year (the year of outcome) with an HR of 1.03 (95% CI 1.01–1.05 per 10 μg/m3) (Stockfelt et al., 2015). The effect estimate is quite similar to the estimate from ESCAPE (Beelen et al., 2014). We cannot be sure which ERF would be most appropriate to use in our study area, therefore we present estimates from both the most conservative estimate (Stockfelt et al., 2015), the“golden stan-dard” from HRAPIE (Héroux et al., 2015) and the highest estimate (Raaschou-Nielsen et al., 2012).
We also included childhood asthma, dementia and preeclampsia Table 2
Estimated impact of the policy of a policy on transportations without tail-pipe emissions in Malmö municipality on health.
Outcome Baseline N Reduced number of events n (% of baseline N)
Exposure response functions fromTable 1a (HRAPIE) Mortality1 2417 64 (2.6)
Bronchitis for asthmatic children 957 95 (10) Hospital admissions for
respiratory disease
3294 30 (0.9)
Work days lost 1,028,301 2729 (0.3) Restricted activity days 6,195,748 16,472 (0.3) Alternative exposure response functions fromTable 1b Mortality2 2417 93 (3.8) Mortality3 2417 55 (2.2) Asthma 354 21 (6) Pregnancy hypertension 141 14 (10) Preeclampsia4 102 3 (3) Preeclampsia5 102 11 (11) Dementia 2280 87 (4)
1–5Different exposure response functions results in different mortality estimates. 1(Hoek et al., 2013),2(Raaschou-Nielsen et al., 2012),3(Stockfelt et al., 2015), 4(Pedersen et al., 2014a, 2014b),5(Malmqvist et al., 2013).
into the health impact assessments. There is increasing evidence for air pollution to be associated with dementia-related outcomes (Oudin et al., 2016;Power et al., 2016;Oudin, 2017). Preeclampsia was not considered in HRAPIE although evidence have increased in recent years as seen in meta-analyses and local studies (Malmqvist et al., 2013; Pedersen et al., 2014a, 2014b;Pedersen et al., 2017). Evidence for an association between air pollution and childhood asthma have also in-creased recently (Bowatte et al., 2015;Khreis et al., 2017). Even though the links between air pollution and preeclampsia, childhood asthma or dementia are not yet fully established, we think evidence is strong enough to start including those outcomes in health impact assessments. Previous HIA have included other health outcomes; such as stroke, preterm birth and low birth weight (Mueller et al., 2017), but we chose to not include them in our study due to inconclusive evidence for these outcomes in our study area (Oudin et al., 2009;Malmqvist et al., 2011; Oudin et al., 2012).
From REVIHAAP and HRAPIE, it was been reported that the sci-entific evidence have increased that NO2in itself be based on the re-lationship between long-term exposure of NO2and mortality (WHO, 2013a, 2013b). Previously, NOxand NO2were primarily seen as in-dicators of exhaust gases, with exhaust particles being more likely to cause health effects. A literature review by Faustini et al. found that the largest effect on total mortality could be observed in Europe for both NO2and PM2.5(Faustini et al., 2014). In Europe, an increase of 7% per 10μg m3of the total mortality of both NO
2andfine particles was ob-served, and that the effects in principle appear to be independent of each other. We chose to follow recent recommendations to use one or the other so as not to risk to“count twice” (double-count) (Yin et al., 2017), although this may have led to an underestimation of the health impacts. Furthermore, we only estimated effects of long-term exposure to air pollution (by using an annual mean of NO2or PM2.5) and ignored short-term health effects. Results from a recent study suggests that the full extent of benefits from any public health or environmental policy involving chronic diseases should take into consideration both new onset and exacerbation of disease (Chanel et al., 2016). This might thus also have led to an underestimation of health effects in our study. It should also be noted that chemical and photochemical processes of secondary formation of particles and gases are usually included when simulating the fate of air pollution in the atmosphere. However, our model does not incorporate secondary formation. There is a previous study in a similar setting, where this has been investigated further. The authors found that the secondary formation was considered insignif-icant (Gidhagen et al., 2005). As our setting is very similar, concerning both emissions and temporal and spatial scale, secondary formation should therefore not influence our results.
We have not considered that policies that would lead to exhaust-free transport in Malmö would most likely also lead to other changes for the population, apart from a lowered air pollution exposure. Especially if the policies would target modes of transport such as a shift from cars to bicycles. Many policies to reduce air pollution could have other co-benefits for health not included in this study, such as reduction in noise and increased physical mobility and green spaces (Mueller et al., 2017; Quam et al., 2017). Negative effects could also be relevant to consider, for example an increased number of biking accidents. There could also be potential negative effects due to increased emissions outside for example car-free zones. Furthermore, an increased use of electric ve-hicles would still contribute to air pollution elsewhere, for example where power generation takes place, or where the batteries are man-ufactured. This HIA would have been more comprehensive if that was captured as well. In this study however, we only included the health effect benefits locally from reductions in air pollution exposure and did not consider other benefits or disadvantages such policy could lead to. Different health metrics can be used in HIA. The choice is largely depending on comprehensiveness. A less severe metric is normally ex-pressed in a larger number, such as asthma exacerbations, and mortality will cover less cases. Combinations of metrics are often suggested
(Martenies et al., 2015). We would have liked to study for example school days lost, but we found no reliable statistics. Future studies should investigate associations between long-term exposure to air pol-lution and school days lost. Furthermore, there were no reliable esti-mates on workdays lost in association with NO2, which should also be investigated in future studies.
In Malmö, there is also an environmental injustice perspective to air pollution attributed health risks, with higher levels of air pollutants in areas with higher socioeconomic challenges (Stroh et al., 2005). It has been proposed to look into health effects of air pollution in susceptible populations such as those with low socio-economic status and/or pre-existing health conditions (Fann et al., 2011). Future studies should investigate how to design such measures so that they don't become an additional way to exacerbate socioeconomic divides (Nieuwenhuijsen and Khreis, 2016).
HIA can have different purposes. The purpose here was to provide decision support (Harris-Roxas and Harris, 2011). This study was per-formed in collaboration with officials at the Environmental Department at the city of Malmö. The aim of the study was to support urban planning and future work on air quality policies. It has been suggested that HIA in this setting can provide good starting point for including health in urban planning (Wernham, 2011).
In conclusion, we estimated the health impacts attributable to a hypothesized reduction of air pollution in the city of Malmö. The health impacts may help informing decision makers to evaluate or predict the success of regional clean air policy such as fossil free Skåne 2020. Funding
Swedish Research Council Formas grant number 942 2016-46 Air Pollution Research in Local Environment Planning. The work regarding the air pollution models was funded by Swedish Environmental Protection Agency and City of Malmö.
Competing interests
The authors declare they have no competing interests. References
(Naturvårdsverket), S. E. P. A, 2005. Kvävedioxid och ozon i tätortsluft– Halternas samspel samt konsekvenser för hälsan (In English: Nitrogen Dioxide and Ozone in Urban Air - Interactions of Concentrations, and Health Consequences). Naturvårdsverket, pp. 5519.
Ballester, F., Medina, S., Boldo, E., Goodman, P., Neuberger, M., Iñiguez, C., Künzli, N., 2008. Reducing ambient levels offine particulates could substantially improve health: a mortality impact assessment for 26 European cities. J. Epidemiol. Community Health 62 (2), 98–105.
Beelen, R., Raaschou-Nielsen, O., Stafoggia, M., Andersen, Z.J., Weinmayr, G., Hoffmann, B., Wolf, K., Samoli, E., Fischer, P., Nieuwenhuijsen, M., Vineis, P., Xun, W.W., Katsouyanni, K., Dimakopoulou, K., Oudin, A., Forsberg, B., Modig, L., Havulinna, A.S., Lanki, T., Turunen, A., Oftedal, B., Nystad, W., Nafstad, P., De Faire, U., Pedersen, N.L., Östenson, C.-G., Fratiglioni, L., Penell, J., Korek, M., Pershagen, G., Eriksen, K.T., Overvad, K., Ellermann, T., Eeftens, M., Peeters, P.H., Meliefste, K., Wang, M., Bueno-de-Mesquita, B., Sugiri, D., Krämer, U., Heinrich, J., de Hoogh, K., Key, T., Peters, A., Hampel, R., Concin, H., Nagel, G., Ineichen, A., Schaffner, E., Probst-Hensch, N., Künzli, N., Schindler, C., Schikowski, T., Adam, M., Phuleria, H., Vilier, A., Clavel-Chapelon, F., Declercq, C., Grioni, S., Krogh, V., Tsai, M.-Y., Ricceri, F., Sacerdote, C., Galassi, C., Migliore, E., Ranzi, A., Cesaroni, G., Badaloni, C., Forastiere, F., Tamayo, I., Amiano, P., Dorronsoro, M., Katsoulis, M., Trichopoulou, A., Brunekreef, B., Hoek, G., 2014. Effects of long-term exposure to air pollution on natural-cause mortality: an analysis of 22 European cohorts within the multicentre ESCAPE project. Lancet 0.
Bowatte, G., Lodge, C., Lowe, A., Erbas, B., Perret, J., Abramson, M., Matheson, M., Dharmage, S., 2015. The influence of childhood traffic-related air pollution exposure on asthma, allergy and sensitization: a systematic review and a meta-analysis of birth cohort studies. Allergy 70 (3), 245–256.
Castro, A., Künzli, N., Götschi, T., 2017. Health benefits of a reduction of PM10and NO2
exposure after implementing a clean air plan in the Agglomeration Lausanne-Morges. Int. J. Hyg. Environ. Health 220 (5), 829–839.
Chanel, O., Perez, L., Kunzli, N., Medina, S., 2016. The hidden economic burden of air pollution-related morbidity: evidence from the Aphekom project. Eur. J. Health Econ. 17 (9), 1101–1115.
Chart-asa, C., Gibson, J.M., 2015. Health impact assessment of traffic-related air pollution at the urban project scale: influence of variability and uncertainty. Sci. Total Environ. 506–507 (Supplement C), 409–421.
Cohen, Andersson, Ostro, Pandey, Kryzyzanowski, Künsli, et al., 2004. In: LA, Ezzati, M., Rodgers, A., CJL, Murray (Eds.), Comparative Quantification of Health Risks-outdoor Air Pollution. Global and Regional Burden of Disease attributable to Selected Major Risk Factors. 1. WHO, pp. 1353–1433.
de Hoogh, K., Korek, M., Vienneau, D., Keuken, M., Kukkonen, J., Nieuwenhuijsen, M.J., Badaloni, C., Beelen, R., Bolignano, A., Cesaroni, G., Pradas, M.C., Cyrys, J., Douros, J., Eeftens, M., Forastiere, F., Forsberg, B., Fuks, K., Gehring, U., Gryparis, A., Gulliver, J., Hansell, A.L., Hoffmann, B., Johansson, C., Jonkers, S., Kangas, L., Katsouyanni, K., Kunzli, N., Lanki, T., Memmesheimer, M., Moussiopoulos, N., Modig, L., Pershagen, G., Probst-Hensch, N., Schindler, C., Schikowski, T., Sugiri, D., Teixido, O., Tsai, M.Y., Yli-Tuomi, T., Brunekreef, B., Hoek, G., Bellander, T., 2014. Comparing land use regression and dispersion modelling to assess residential ex-posure to ambient air pollution for epidemiological studies. Environ. Int. 73, 382–392.
Fann, N., Bell, M.L., Walker, K., Hubbell, B., 2011. Improving the linkages between air pollution epidemiology and quantitative risk assessment. Environ. Health Perspect. 119 (12), 1671–1675.
Faustini, A., Rapp, R., Forastiere, F., 2014. Nitrogen dioxide and mortality: review and meta-analysis of long-term studies. Eur. Respir. J. 44 (3), 744–753.
Gidhagen, L., Johansson, C., Langner, J., Foltescu, V., 2005. Urban scale modeling of particle number concentration in Stockholm. Atmos. Environ. 39 (9), 1711–1725.
Gilliland, F., Avol, E., Kinney, P., Jerrett, M., Dvonch, T., Lurmann, F., Buckley, T., Breysse, P., Keeler, G., de Villiers, T., McConnell, R., 2005. Air pollution exposure assessment for epidemiologic studies of pregnant women and children: lessons learned from the centers for children's environmental health and disease prevention research. Environ. Health Perspect. 113 (10), 1447–1454.
Gustafsson, M., Forsberg, B., Orru, H., Åström, S., ekie, H., Sjöberg, K., 2014. Quantification of Population Exposure to NO2, PM2.5and PM10and Estimated Health
Impacts in Sweden 2010: B 2197. IVL.
Harris-Roxas, B., Harris, E., 2011. Differing forms, differing purposes: a typology of health impact assessment. Environ. Impact Assess. Rev. 31 (4), 396–403.
Héroux, M.-E., Anderson, H.R., Atkinson, R., Brunekreef, B., Cohen, A., Forastiere, F., Hurley, F., Katsouyanni, K., Krewski, D., Krzyzanowski, M., 2015. Quantifying the health impacts of ambient air pollutants: recommendations of a WHO/Europe pro-ject. Int. J. Public Health 60 (5), 619–627.
Hertz-Picciotto, 1995. Epidemiology and quantitative risk assessment: a bridge from science to policy. Am. J. Public Health 85 (4), 484–491.
Hoek, G., Krishnan, R.M., Beelen, R., Peters, A., Ostro, B., Brunekreef, B., Kaufman, J.D., 2013. Long-term air pollution exposure and cardio-respiratory mortality: a review. Environ. Health 12 (1), 43.
Holmes, N.S., Morawska, L., 2006. A review of dispersion modelling and its application to the dispersion of particles: an overview of different dispersion models available. Atmos. Environ. 40 (30), 5902–5928.
Hubbell, B., Fann, N., Levy, J., 2009. Methodological considerations in developing local-scale health impact assessments: balancing national, regional, and local data. Air Qual. Atmos. Health 2 (2), 99–110.
Hunter, L., Robb, W., Brownie, S., 2014. The“secret” impact of population statistics on the metrics of diabetes. J. Diabetes Metab. Disord. Control 1 (4).
Hurkmans, J., Johansson, C., Forsberg, B., Burman, L., 2017. Fossilfri fordonsflotta i Stockholm– betydelse för luftkvalitet och hälsa (In English: Fossil Free Vehicle Park in Stockholm-impact on Air Quality and Health). E. D. SLB-Analys, Stockholm city.
Jennie Hurkmans, C.J., 2017. Bertil Forsberg och Lars Burman. Fossilfri fordonsflotta i Stockholm– betydelse för luftkvalitet och hälsa.
Jorm, A., Korten, A., Henderson, A., 1987. The prevalence of dementia: a quantitative integration of the literature. Acta Psychiatr. Scand. 76 (5), 465–479.
Kelly, F., Armstrong, B., Atkinson, R., Anderson, H.R., Barratt, B., Beevers, S., Cook, D., Green, D., Derwent, D., Mudway, I., Wilkinson, P., 2011. The London low emission zone baseline study. Res. Rep. Health Eff. Inst. 163, 3–79.
Khreis, H., Kelly, C., Tate, J., Parslow, R., Lucas, K., Nieuwenhuijsen, M., 2017. Exposure to traffic-related air pollution and risk of development of childhood asthma: a sys-tematic review and meta-analysis. Environ. Int. 100, 1–31.
Malmqvist, E., Rignell-Hydbom, A., Tinnerberg, H., Bjork, J., Stroh, E., Jakobsson, K., Rittner, R., Rylander, L., 2011. Maternal exposure to air pollution and birth out-comes. Environ. Health Perspect. 119 (4), 553–558.
Malmqvist, E., Jakobsson, K., Tinnerberg, H., Rignell-Hydbom, A., Rylander, L., 2013. Gestational diabetes and preeclampsia in association with air pollution at levels below current air quality guidelines. Environ. Health Perspect. 121 (4), 488–493.
Malmqvist, E., Rittner, R., Stroh, E., Spanne, M., Gustafsson, S., 2016. Dispersion Modelling for Particles in Scania. A.-O. M. Syd. 25/2016.
Malmqvist, E., Liew, Z., Kallen, K., Rignell-Hydbom, A., Rittner, R., Rylander, L., Ritz, B., 2017. Fetal growth and air pollution - a study on ultrasound and birth measures. Environ. Res. 152, 73–80.
Malmqvist, E., Oudin, A., Pascal, M., Medina, S., 2018. Choices behind numbers: a review of the major air pollution health impact assessments in Europe. Curr. Environ. Health Rep. 5 (1), 34–43.
Martenies, S.E., Wilkins, D., Batterman, S.A., 2015. Health impact metrics for air pollu-tion management strategies. Environ. Int. 85, 84–95.
McConnell, R., Berhane, K., Gilliland, F., Molitor, J., Thomas, D., Lurmann, F., Avol, E., Gauderman, W.J., Peters, J.M., 2003. Prospective study of air pollution and bronchitic symptoms in children with asthma. Am. J. Respir. Crit. Care Med. 168 (7), 790–797.
Mueller, N., Rojas-Rueda, D., Basagaña, X., Cirach, M., Cole-Hunter, T., Dadvand, P., Donaire-Gonzalez, D., Foraster, M., Gascon, M., Martinez, D., Tonne, C.,
Triguero-Mas, M., Valentín, A., Nieuwenhuijsen, M., 2017. Health impacts related to urban and transport planning: a burden of disease assessment. Environ. Int. 107 (Supplement C), 243–257.
Næss, Ø., Nafstad, P., Aamodt, G., Claussen, B., Rosland, P., 2006. Relation between concentration of air pollution and cause-specific mortality: four-year exposures to nitrogen dioxide and particulate matter pollutants in 470 neighborhoods in Oslo, Norway. Am. J. Epidemiol. 165 (4), 435–443.
Nafstad, P., Lund Håheim, L., Wisloeff, T., Gram, F., Oftedal, B., Holme, I., Hjermann, I., Leren, P., 2004. Urban air pollution and mortality in a cohort of Norwegian men. Environ. Health Perspect. 112 (5), 610–615.
Nieuwenhuijsen, M.J., Khreis, H., 2016. Car free cities: pathway to healthy urban living. Environ. Int. 94, 251–262.
Ostro, B.D., 1987. Air pollution and morbidity revisited: a specification test. J. Environ. Econ. Manag. 14 (1), 87–98.
Oudin, A., 2017. Air pollution and dementia. J. Pub. Health Emerg. 1 (5).
Oudin, A., Stroh, E., Strömberg, U., Jakobsson, K., Björk, J., 2009. Long-term exposure to air pollution and hospital admissions for ischemic stroke. A register-based case-control study using modelled NOxas exposure proxy. BMC Public Health 19 (9), 301
(Aug).
Oudin, A., Forsberg, B., Jakobsson, K., 2012. Air pollution and stroke. Epidemiology 23 (3), 505–506.
Oudin, A., Forsberg, B., Adolfsson, A.N., Lind, N., Modig, L., Nordin, M., Nordin, S., Adolfsson, R., Nilsson, L.-G., 2016. Traffic-related air pollution and dementia in-cidence in Northern Sweden: a longitudinal study. Environ. Health Perspect. 124 (3), 306.
Pedersen, M., Stayner, L., Slama, R., Sorensen, M., Figueras, F., Nieuwenhuijsen, M.J., Raaschou-Nielsen, O., Dadvand, P., 2014a. Ambient air pollution and pregnancy-induced hypertensive disorders: a systematic review and meta-analysis. Hypertension 64 (3), 494–500.
Pedersen, M., Stayner, L., Slama, R., Sørensen, M., Figueras, F., Nieuwenhuijsen, M.J., Raaschou-Nielsen, O., Dadvand, P., 2014b. Ambient air pollution and pregnancy-induced hypertensive disorders: a systematic review and meta-analysis. Hypertension 64 (3), 494–500 (Sep, HYPERTENSIONAHA. 114.03545).
Pedersen, M., Halldorsson, T.I., Olsen, S.F., Hjortebjerg, D., Ketzel, M., Grandstrom, C., Raaschou-Nielsen, O., Sorensen, M., 2017. Impact of road traffic pollution on pre-eclampsia and pregnancy-induced hypertensive disorders. Epidemiology 28 (1), 99–106.
Perez, L., Trueb, S., Cowie, H., Keuken, M.P., Mudu, P., Ragettli, M.S., Sarigiannis, D.A., Tobollik, M., Tuomisto, J., Vienneau, D., Sabel, C., Kunzli, N., 2015. Transport-re-lated measures to mitigate climate change in Basel, Switzerland: a health-effective-ness comparison study. Environ. Int. 85, 111–119.
Power, M.C., Adar, S.D., Yanosky, J.D., Weuve, J., 2016. Exposure to air pollution as a potential contributor to cognitive function, cognitive decline, brain imaging, and dementia: a systematic review of epidemiologic research. Neurotoxicology 56 (September 2016), 235–253.
Quam, V.G.M., Rocklov, J., Quam, M.B.M., Lucas, R.A.I., 2017. Assessing greenhouse gas emissions and health co-benefits: a structured review of lifestyle-related climate change mitigation strategies. Int. J. Environ. Res. Public Health 14 (5).
Raaschou-Nielsen, O., Andersen, Z.J., Jensen, S.S., Ketzel, M., Sørensen, M., Hansen, J., Loft, S., Tjønneland, A., Overvad, K., 2012. Traffic air pollution and mortality from cardiovascular disease and all causes: a Danish cohort study. Environ. Health 11 (1), 60.
Rönmark, E., Perzanowski, M., Platts-Mills, T., Lundbäck, B., 2002. Incidence rates and risk factors for asthma among school children: a 2-year follow-up report from the obstructive lung disease in Northern Sweden (OLIN) studies. Respir. Med. 96 (12), 1006–1013.
Segersson, D., Eneroth, K., Gidhagen, L., Johansson, C., Omstedt, G., Nylén, A.E., Forsberg, B., 2017. Health impact of PM10, PM2.5and black carbon exposure due to
different source sectors in Stockholm, Gothenburg and Umea, Sweden. Int. J. Environ. Res. Public Health 14 (7), 742.
Shojaei, P., Karimlou, M., Nouri, J., Mohammadi, F., Malek Afzali, H., Forouzan, A.S., 2014. Ranking the effects of urban development projects on social determinants of health: health impact assessment. Glob. J. Health Sci. 6 (5), 183–195.
Spanne, M., Gustafsson, S., Johansson, L.J., Nilsson, H., Arvin, A., HP, 2017. Luften i Malmö 2016 [Air in Malmö 2016]. Malmö Municipality Environmental Department, Malmö (1/2017).
Stockfelt, L., Andersson, E.M., Molnár, P., Rosengren, A., Wilhelmsen, L., Sallsten, G., Barregard, L., 2015. Long term effects of residential NOxexposure on total and
cause-specific mortality and incidence of myocardial infarction in a Swedish cohort. Environ. Res. 142, 197–206.
Stroh, E., Oudin, A., Gustafsson, S., Pilesjo, P., Harrie, L., Stromberg, U., Jakobsson, K., 2005. Are associations between socio-economic characteristics and exposure to air pollution a question of study area size? An example from Scania, Sweden. Int. J. Health Geogr. 4, 30.
Stroh, E., Rittner, R., Oudin, A., Ardo, J., Jakobsson, K., Bjork, J., Tinnerberg, H., 2012. Measured and modeled personal and environmental NO2exposure. Popul. Health
Metrics 10 (1), 10.
Taavo, E., 2016. Trafikolyckor 2015. En årlig redovisning av trafikolycksutvecklingen. T2016-02178 Lägesrapport (In English: Traffic Accidents 2015. A Yearly Account of Traffic Accidents Development. Status Report), Stockholm City, Traffic Office.
Tobollik, M., Keuken, M., Sabel, C., Cowie, H., Tuomisto, J., Sarigiannis, D., Kunzli, N., Perez, L., Mudu, P., 2016. Health impact assessment of transport policies in Rotterdam: decrease of total traffic and increase of electric car use. Environ. Res. 146, 350–358.
Turner, M.C., Jerrett, M., Pope III, C.A., Krewski, D., Gapstur, S.M., Diver, W.R., Beckerman, B.S., Marshall, J.D., Su, J., Crouse, D.L., 2016. Long-term ozone exposure
and mortality in a large prospective study. Am. J. Respir. Crit. Care Med. 193 (10), 1134–1142.
Wennergren, G., 2015. Astma är en av de vanligaste kroniska sjukdomarna hos barn (in English: asthma is one of the most common chonic diseases in children). Lakartidningen 46.
Wernham, A., 2011. Health impact assessments are needed in decision making about environmental and land-use policy. Health Aff. (Millwood) 30 (5), 947–956.
WHO, 2005. Who Air Quality Guidelines Global Update 2005 Meeting Report. EUR/05/ 5046029.
WHO, 2011. Burden of disease from urban outdoor air pollution for 2008 description of method. Retrieved 2014-03-20, 2014, from.http://www.who.int/phe/health_ topics/outdoorair/databases/OAP_BoD_2011_.pdf.
WHO, 2013a. Health Risks of Air Pollution in Europe– HRAPIE. Recommendations for Concentration-response Functions for Cost-benefit Analysis of Particulate Matter, Ozone and Nitrogen Dioxide. Copenhagen.
WHO, 2013b. Review of Evidence on Health Aspects of Air Pollution– REVIHAAP Project: Final Technical Report.
WHO, 2014. Burden of disease from ambient air pollution for 2012 description of method. 1.3. Retrieved 2014-03-25, 2014, from.http://www.who.int/phe/health_topics/ outdoorair/databases/AAP_BoD_methods_March2014.pdf.
Yin, H., Pizzol, M., Xu, L., 2017. External costs of PM2.5pollution in Beijing, China:
un-certainty analysis of multiple health impacts and costs. Environ. Pollut. 226, 356–369.