Institutionen för vatten och miljö
Screening of PFASs in groundwater and
surface water
Screening av PFAS i grund- och
ytvatten
Lutz Ahrens, Johanna Hedlund, Wiebke Dürig, Rikard
Trö-ger, Karin Wiberg
Institutionen för vatten och miljö, SLU tel: +46 (0)18-67 10 00 Box 7050, SE-750 07 Uppsala, Sweden www.slu.se/vatten-miljo Org.nr 202100-2817
Please refer to this report as:
Rapport 2016:2, Sveriges lantbruksuniversitet, Institutionen för vatten och miljö, ISBN 978-91-576-9386-0
Photo: Jenny Svennås-Gillner, SLU
Contact
lutz.ahrens@slu.se
NATIONAL ENVIRONMENTAL
MONITORING COMMISSIONEDBY
THESWEDISHEPA
FILENO. CONTRACTNO. PROGRAMMEAREA SUBPROGRAMME NV-02893-15 2112-15-001
MILJÖGIFTER SCREENING PFOS
MILJÖGIFTER SCREENING PFOS (RU)
Screening of PFASs in groundwater and surface water
Report authors Lutz Ahrens Johanna Hedlund Wiebke Dürig Rikard Tröger Karin Wiberg Responsible publisher
Swedish University of Agricultural Sciences
Postal address
Box 7070, SE.75007 Uppsala, Sweden
Telephone
+46 18 671000
Report title and subtitle
Screening of PFASs in groundwater and surface water
Purchaser
Swedish Environmental Protection Agency, Environ-mental Monitoring Unit
SE-106 48 Stockholm, Sweden
Funding
National environmental monitoring Contract no 2112-15-001
Keywords for location (specify in Swedish)
groundwater, surface water, sewage treatment plant (STP) effluents, landfill leachates, trend lakes
Keywords for subject (specify in Swedish)
per- and polyfluoroalkyl substances, PFASs, PFOS, national screening,
Period in which underlying data were collected
2015
Summary
Levels of 26 per- and polyfluoroalkyl substances (PFASs) were measured in 502 water samples originat-ing from Swedish groundwater, surface water, sewage treatment plant (STP) effluents and landfill leachates. In drinking water source areas, the average ∑26PFAS concentration was 8.4 ng L
-1
. The national drinking water guideline value of 90 ng L-1 for ∑7PFASs was exceeded in 2% of these samples.
In water not used for drinking water, ∑26PFASs average concentration was 142 ng L-1. PFOS
concentra-tions exceeded the Annual Average Environmental Quality Standard (AA-EQS) of the EU Water Frame-work Directive in 42% of the surface water samples. Among the different water categories, the landfill leachates had the highest average concentration of ∑26PFAS with 487 ng L-1, followed by surface water
(average 112 ng L-1), groundwater (49 ng L-1), STP effluents (35 ng L-1) and background screening lakes
(3.4 ng L-1). The composition profile of the PFASs differed between the types of waters showing an even distribution of ∑PFCAs, ∑PFSAs and ∑PFAS precursors in groundwater, whereas in all other water categories, ∑PFCAs were dominant. As FOSA, PFNA, PFDA, and 6:2 FTSA were frequently detected in drinking water source areas (constituted 20%, 7.3%, 5.9%, and 4.4% of the ∑26PFASs, respectively), it is
1
1 Preface
This work has been conducted by staff at the Swedish University of Agricultural Sciences (SLU) on commission from the Swedish Environmental Protection Agen-cy. It constitutes a basis to the Agency’s governmental commission on screening of pesticides and highly fluorinated substances (NV-00305-15). The authors (and not the Agency) are responsible for the content of this report, and no official endorse-ment should be inferred.
The work has been led by Associated Professor Lutz Ahrens, and other contribu-tors were Johanna Hedlund, Wiebke Dürig, Rikard Tröger and Karin Wiberg. Data presented in this report has been further elaborated in a student report that is pub-lished separately. Therefore, the same facts partly appear in both reports.
2 Sammanfattning
Per- och polyfluoralkylerade ämnen (PFASs) är relativt nya organiska miljöförore-ningar som kännetecknas av att många av dem är långlivade, bioackumulerar och är toxiska. I den här studien analyserades 26 olika PFASs i 502 svenska vattenpro-ver av olika ursprung: grundvatten, ytvatten, avloppsvatten från reningsvattenpro-verk (STP) och lakvatten från deponier. Syftet med studien var att fastställa bakgrundskoncent-rationer av PFASs i den svenska vattenmiljön, identifiera PFAS källor samt jäm-föra PFAS-koncentrationer med riktvärden för bedömning av risker för ekosystem och människors hälsa. I källområden för dricksvatten var den genomsnittliga kon-centrationen av Σ26PFAS 8,4 ng L
-1
, med ett medianvärde på 0,6 ng L-1 (n = 172). Livsmedelsverkets rekommenderade gränsvärde för Σ7PFASs (PFPeA, PFHxA,
PFHpA, PFOA, PFBS, PFHxS, PFOS) i dricksvatten (90 ng L-1) överskreds i 4 prover (2% av proverna för denna typ av vatten). I vatten som inte kom från käll-områden för dricksvatten var Σ26PFAS koncentrationerna högre med ett
medel-värde på 142 ng L-1 och medianvärde på 5,4 ng L-1. Den höga medelkoncentration-en kan förklaras av att vissa prover hade extremt höga PFAS halter med ett topp-värde på 12 900 ng L-1. För substansen PFOS finns en miljökvalitetsnorm i EU:s ramdirektiv för vatten (vattendirektivet) som avser årsmedelvärde (AA-MKN). Denna norm överskreds i 42% av ytvattenproverna. Bland de olika vattenkategori-erna hade lakvatten den högsta genomsnittliga Σ26PFAS-koncentrationen (487 ng
L-1, median 435 ng L-1, n = 10), följt av ytvatten (medel 112 ng L-1, median 4,1 ng L-1, n = 285), grundvatten (medel 49 ng L-1, median 0,4 ng L-1, n = 164), STP av-lopssvatten (medel 35 ng L-1, median 26 ng L-1, n = 13) och bakgrundsjöar (avläg-set belägna screening-sjöar, medel 3,4 ng L-1, median 1,4 ng L-1, n = 10). PFASs kan indelas i olika ämnesgrupper, t.ex. ΣPFCAs, ΣPFSAs och ΣPFAS-prekursorer. Sammansättningen av PFASs skilde sig mellan olika typer av vatten. Grundvattnen hade en jämn fördelning mellan dessa ämnesgrupper, medan i alla andra prover (ytvatten, bakgrundssjöar, STP avloppsvatten och lakvatten) dominerade ΣPFCAs. Eftersom FOSA, PFNA, PFDA och 6:2 FTSA ofta detekterades i vatten från käll-områden till dricksvatten (utgjorde 20%, 7,3%, 5,9% respektive 4,4% av Σ26PFASs) kan man överväga att inkludera dessa i det rekommenderade svenska
3
3 Summary
Per- and polyfluoroalkyl substances (PFASs) are emerging organic pollutants char-acterized by their persistency, and bioaccumulation and toxicity potential. In this study, 26 PFASs were screened in 502 water samples originating from Swedish groundwater, surface water, sewage treatment plant (STP) effluents and landfill leachates. The objectives were to establish baseline concentrations of PFASs in the aquatic environment, to screen for potential sources, and to compare PFAS concen-trations with guideline values for estimation of potential effects on the ecosystem and human health. In drinking water source areas, the average ∑26PFAS concentra-tion was 8.4 ng L-1 with a median value of 0.6 ng L-1 (n = 172). The drinking water guideline value of 90 ng L-1 for ∑7PFASs (PFPeA, PFHxA, PFHpA, PFOA, PFBS, PFHxS, PFOS) established by the Swedish National Food Agency was exceeded in 4 samples (2% of the total number of samples in this category). In water not used for drinking water, ∑26PFASs concentrations were on average 142 ng L
-1
(median 5.4 ng L-1). The high average PFAS concentrations can be explained by the fact that some samples showed extremely high PFAS concentrations with a maximum ∑26PFASs value of 12 900 ng L-1. In surface water, PFOS concentrations exceeded the annual average Environmental Quality Standard (AA-EQS) of the EU Water Framework Directive (WFD) in 42% of the samples. Among the different water categories, the landfill leachates had the highest average concentration of ∑26PFAS with 487 ng L-1 (median 435 ng L-1, n = 10), followed by surface water (average 112 ng L-1, median 4.1 ng L-1, n = 285), groundwater (average 49 ng L-1, median 0.4 ng L-1, n = 164), STP effluents (average 35 ng L-1, median 26 ng L-1; n = 13) and background screening lakes (remote lakes; average 3.4 ng L-1, median 1.4 ng L-1, n = 10). The composition profile of the PFASs differed between the types of waters showing an even distribution of ∑PFCAs, ∑PFSAs and ∑PFAS precursors in groundwater, whereas in all other water categories (surface water, background lakes, STP effluents and landfill leachates), ∑PFCAs were dominant. As FOSA, PFNA, PFDA, and 6:2 FTSA were frequently detected in drinking water source areas (constituted 20%, 7.3%, 5.9%, and 4.4% of the ∑26PFASs, respectively), it is reasonable to consider the inclusion of these in the Swedish drinking water guide-line.
4 Introduction
Per- and polyfluoroalkyl substances (PFASs) are synthetically made organic com-pounds containing a highly fluorinated carbon chain and a hydrophilic head group, which give them surfactant characteristics (Ahrens, 2011). Due to their unique characteristics, PFASs are used in a variety of industry and consumer products, such as in paint, leather and textile coating, clothes, shoes and carpets, as lubricants
in floor- and car waxes, and as aqueous fire-fighting foams (AFFFs) (Buck et al., 2011). The extensive use of PFASs has caused a wide spread in the environment and they have been detected ubiquitously in the environment, humans and wildlife (Giesy and Kannan, 2001). PFASs are also known to be highly persistent and are potentially bioaccumulative and toxic (Giesy et al., 2010, Ahrens and Bundschuh, 2014). One of the major PFAS, perfluorooctane sulfonic acid (PFOS), is classified as a substance of very high concern (SVHC) under REACH. Its use was prohibited in the EU in 2008, and in 2009, it was added to the Stockholm Convention on Per-sistent Organic Pollutants (Vierke et al., 2012).
The general formula of perfluoroalkyl substances is CnF2n+1R; thus, they consist of a fully fluorinated carbon chain and a functional group (R). Common functional groups include carboxylic acids (-CO2H; perfluoroalkyl carboxylic acids; PFCAs) or sulfonic acids (-SO3H; perfluoroalkyl sulfonic acids; PFSAs). Polyfluoroalkyl substances have at least one C atom in the carbon chain that is not fully fluorinated. Experiments have shown that both the number of F atoms as well as their location is important for the physiochemical properties of the individual substance (Buck et al., 2011). The fluorine atoms (F) are attached to the carbon chain by a strong cova-lent bound. As F has the highest electronegativity (EN) in the whole periodic sys-tem (3.98 on Pauling scale), PFASs are highly persistent to natural degradation. It has been shown that PFASs resist to e.g. heat and hydrolysis, although some deg-radation from longer to shorter C-chains occurs when exposed to UV light (Taniyasu et al., 2013).
PFASs can be released to the environment through the whole lifecycle, from pro-duction, through product use, to disposal of the products (Ahrens and Bundschuh, 2014). Environmental inventory studies have shown that the majority of PFASs are released to the aquatic ecosystem (Prevedouros et al., 2006, Paul et al., 2009). Im-portant point sources to the aquatic ecosystem are, for example, sewage treatment plants (STP) and landfills, while among diffuse sources, atmospheric deposition is considered to be major (Ahrens and Bundschuh, 2014). PFASs have been found in more than 90% of all European rivers and have also been detected in drinking wa-ter, which is one of the potential exposure pathways to humans (Ahrens et al., 2014). However, little is known about the effects of PFASs on the ecosystem and human health. PFOS is included in the EU Water Framework Directive (WFD) with an annual average Environmental Quality Standard (AA-EQS) of 0.65 ng L-1 (The European Parliament and of the Council, 2013/39/EU). However, no EU guideline values for the ecosystem exist for the other PFASs. The Swedish Nation-al Food Agency has issued risk management recommendations for PFASs in drink-ing water, and these include 7 PFASs (i.e. PFPeA, PFHxA, PFHpA, PFOA, PFBS, PFHxS, and PFOS) with an action limit of 90 ng L-1 and a health-based guidance value of 900 ng L-1for ∑7PFASs (Swedish National Food Agency, 2015).
The aim of this study was to screen for PFASs in Swedish groundwater and surface water. The specific objectives included i) screening of 26 PFASs in groundwater,
5
surface water, landfill leachates and STP effluents from various locations in Swe-den, ii) compare measured PFAS concentrations with guideline values to estimate potential effects on the ecosystem and human health, and iii) trace sources of PFASs using their composition profile.
5 Materials and methods
5.1 PFAS target compounds
In total, 26 PFASs were included for analysis: four PFSAs (PFBS, PFHxS, PFOS, PFDS), 13 PFCAs (PFBA, PFPeA, PFHxA, PFHpA, PFOA, PFNA, PFDA, PFUnDA, PFDoDA, PFTriDA, PFTeDA, PFHxDA, PFOcDA), three fluorooctane sulfonamides (FOSAs) (FOSA, MeFOSA EtFOSA), two fluorooctane sulfonamidoethanols (FOSEs) (MeFOSE, EtFOSE), three per-fluorooctane sulfonamidoacetic acids (FOSAAs) (FOSAA, MeFOSAA, EtFOSAA) and one fluorotelomer carboxylate (6:2 FTSA) (Table 1). In addition, 16 internal standards (IS) were used, which were spiked to the water sample before extraction (i.e. 13C8-FOSA, d3- MeFOSAA, d5-EtFOSAA, d3-MeFOSA, d5-EtFOSA, d7 -MeFOSE, d9-EtFOSE, 13 C4-PFBA, 13 C2-PFHxA, 13 C4-PFOA, 13 C5-PFNA, 13 C2 -PFDA, 13C2-PFUnDA, 13 C2-PFDoDA, 18 O2-PFHxS, 13
C4-PFOS). Additionally, one Injection standard (InjS) added prior to instrumental analysis was used (13C8 PFOA).
Table 1. PFAS target compounds
Substance Acronym Molecular formula CAS-number
PFCAs
Perfluorobutanoic acid PFBA C3F7CO2H 375-22-4 Perfluoropentanoic acid PFPeA C4F9CO2H 2706-90-3 Perfluorohexanoic acid PFHxA C5F11CO2H 307-24-4 Perfluorohepanoic acid PFHpA C6F13CO2H 375-85-9 Perfluorooctanoic acid PFOA C7F15CO2H 335-67-1 Perfluorononanoic acid PFNA C8F17CO2H 375-95-1 Perfluorodecanoic acid PFDA C9F19CO2H 335-76-2 Perfluoroundecanoic acid PFUnDA C10F21CO2H 2058-94-8 Perfluorododecanoic acid PFDoDA C11F23CO2H 307-55-1 Perfluorotridecanoic acid PFTrDA C12F25CO2H 72629-94-8 Perfluorotetradecanoic acid PFTeDA C13F27CO2H 376-06-7 Perfluorohexadecanoic acid PFHxDA C15F31CO2H 67905-19-5
Perfluorooctadecanoic acid PFOcDA C17F35CO2H 16517-11-6
PFSAs
Perfluorobutane sulfonic acid PFBS C4F9SO3H 375-73-5 or 59933-66-3 Perfluorohexane sulfonic acid PFHxS C6F13SO3H 355-46-4 Perfluorooctane sulfonic acid PFOS C8F17SO3H 1763-23-1 Perfluorodecane sulfonic acid PFDS C10F21SO3H 335-77-3
FASAAs Perfluorooctane Sulfonamidoacetic acid FOSAA C8F17SO2N(CH2CO2H)H 2806-24-8 N-methylperfluoro-1- octanesulfonamidoacetic acid MeFOSAA C8F17SO2N(CH3)CH2CO2H 2355-31-9 N-ethylperfluoro-1- octanesulfonamidoacetic acid EtFOSAA C8F17SO2N(C2H5)CH2CO2H 2991-50-6 FOSAs
Perfluorooctane sulfonamide FOSA C8F17SO2NH2 754-91-6
N-methylperfluoro-1- octansulfonamide MeFOSA C8F17SO2N(CH3)H 31506-32-8 N-ethylperfluoro-1- octanesulfonamide EtFOSA C8F17SO2N(CH2CH3)H 4151-50-2 FOSEs 2-(N-methylperfluoro-1- octanesulfonamido)-ethanol MeFOSE C8F17SO2N(CH3)CH2CH2OH 24448-09-7 2-(N-ethylperfluoro-1- octanesulfonamido)-ethanol EtFOSE C8F17SO2N(C2H5)CH2CH2OH 1691-99-2 FTSAs
6:2 fluorotelomer sulfonate 6:2 FTSA C8H4F13SO3H 27619-97-2
5.2 Sampling
In total, 502 samples (including 10 triplicates) were collected by all 21 Swedish county administrative boards (CABs, Swedish: Länsstyrelser) and by SLU (10 background lakes monitored within the national monitoring program for trend lakes) (Table A1 in the Appendix). The sampling sites were selected by the CABs together with the Swedish Environmental Protection Agency, based on knowledge about potential PFASs hotspots in the county or other criteria, such as being im-portant areas for the drinking water supply. The numbers of samples per county were decided by the CABs, which resulted in an uneven sampling frequency across the country. Västra Götaland had the highest sampling frequency with 60 samples (here triplicates are counted as one average value), and Västerbotten and Krono-berg the lowest with 3 and 4 samples, respectively. In total, 172 of the samples were taken from drinking water source areas and 310 from areas not used for
7
ing water sources. The samples were also categorized into subgroups based on the type of water: surface water (n = 285), groundwater (n = 164), leachates (n = 10), STP effluents (n = 13) and water from background lakes (n = 10). The background lakes are surface waters with low anthropogenic impact, and the PFASs concentra-tion in those samples should therefore reflect atmospheric deposiconcentra-tion. The water samples were collected in 1 L polypropylene (PP) bottles. The surface water sam-ples were collected about 10 cm below the water surface, while for groundwater sampling, the standing water was pumped off before collecting the sample. All PP-bottles were rinsed three times with the sample water before the PP-bottles was com-pletely filled. The water samples were stored a 4°C until analysis. Field blanks were collected by opening the PP bottles shortly at the sampling site and then treat-ing them like real samples.
5.3 PFAS analysis
All samples were analyzed by the POPs lab at SLU, Uppsala (Dept. of Aquatic Sciences and Assessment). The samples were analysed according to methods de-scribed previously (Ahrens et al., 2009).
All water samples were filtered through glass fibre filters (Whatman™ Glass Mi-crofiber Filters GF/C™, 47 mm diameter, 1.2 μm). The solid phase extraction (SPE) was carried out using Oasis® WAX 6 cc cartridges (6 cm3, 500 mg, 60 μm, Waters, Massachusetts, USA). Before extraction, the cartridges were precondi-tioned with 4 mL 0.1% ammonium hydroxide, 4 mL methanol and 4 mL Millipore water. The samples were spiked with 100 μL IS mixture (c = 20 pg μL-1), and each loaded into one of the reservoirs. The flow was regulated to a flow of one drop per second. After loading (~0.5 L), the cartridges were washed with 4 mL of 25 mM ammonium acetate buffer (pH 4) and dried by centrifugation for 2 minutes at 3000 rpm. The cartridges were then eluted into 15 mL PP-tubes by adding 6 mL metha-nol, followed by 6 mL 0.1% ammonium hydroxide in methanol. The samples were placed under nitrogen evaporation (N-EVAP™ 112) to concentrate the sample to 0.5 mL using a gentle stream of nitrogen gas. Finally, the samples were analysed using high performance liquid chromatography-mass spectrophotometry (HPLC-MS/MS) according to the method described by Ahrens et al. (2009).
6 Results and discussion
6.1 Detection frequency of PFASs in groundwater and
surface water
At least one PFAS was detected in 449 of the 502 analyzed samples (Table A2 and A3 in the Appendix). The average concentration of ∑26PFASs in all samples were 91 ng L-1,with a median of 2.5 ng L-1 (n = 502). The average concentration of ∑26PFASs in samples from drinking water source areas was 8.4 ng L
-1
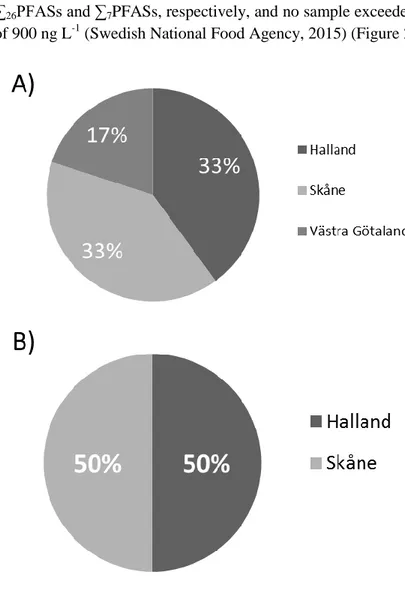
, with a me-dian value of 0.6 ng L-1 (n = 172). The detection frequency of ∑26PFASs in sam-ples from drinking water source areas was 79% (i.e., 21% of the values were below MDL), while for ∑7PFASs (PFPeA, PFHxA, PFHpA, PFOA, PFBS, PFHxS, PFOS) the detection frequency was 60% (Figure 1).
Figure 1. Detection frequency of A) ∑26PFASs and B) ∑7PFASs in samples from drinking
water sources areas (n =172). The blue and green pie chart shows the percentage of A) ∑26PFASs and B) ∑7PFASs below and above the method detection limit (MDL). The red and
9
line value of 90 ng L-1 for drinking water from the National Food Agency in Sweden (the guideline value is for the ∑7PFASs including PFPeA, PFHxA, PFHpA, PFOA, PFBS, PFHxS,
PFOS).
For drinking water source areas, 5 (from Halland, Skåne and Västra Götaland) and 4 samples (from Halland and Skåne) exceeded the guideline value of 90 ng L-1 for ∑26PFASs and ∑7PFASs, respectively, and no sample exceeded the guideline value of 900 ng L-1 (Swedish National Food Agency, 2015) (Figure 2).
Figure 2. Detection frequency of A) ∑26PFASs (n = 5) and B) ∑7PFASs (n = 4) exceeding 90
ng L-1 in samples from drinking water sources areas in individual County Administrative Boards (Länsstyrelser).
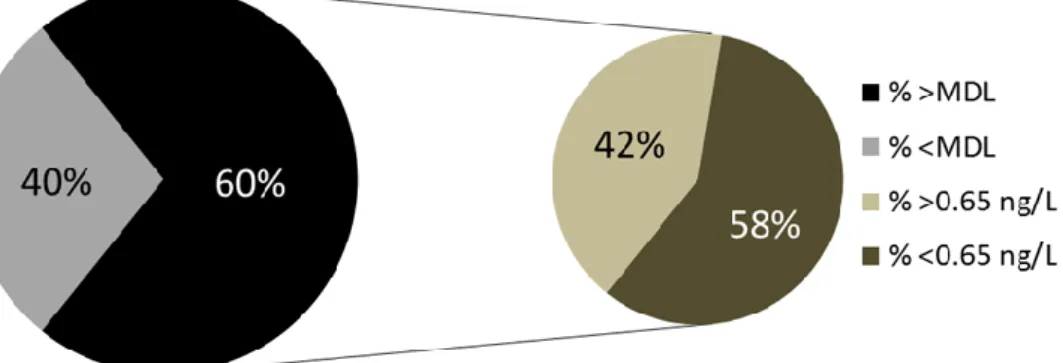
For surface waters, the detection frequency of PFOS was 60% (n = 295) (Figure 3). PFOS has an AA-EQS value of 0.65 ng L-1 for fresh water systems (The European Parliament and of the Council, 2013/39/EU). This limit value has the purpose to
protect aquatic ecosystem including human health. The AA-EQS was exceeded in 42% of the surface water samples (Figure 3).
Figure 3. Detection frequency of PFOS in surface water (n = 295). The black/grey pie chart
shows PFOS concentrations below and above the method detection limit (MDL). The brown-ish pie chart presents PFOS above and below the AA-EQS of 0.65 ng L-1 from the EU WFD.
11
6.2 PFAS concentrations in groundwater, surface
water, STP effluent and landfill leachate
In samples from drinking water source areas, the PFAS concentrations were on average 8.4 ng L-1 (median 0.6 ng L-1) and 6.1 ng L-1 (median 0.2 ng L-1) for ∑26PFASs and ∑7PFASs, respectively. The maximum PFAS concentration was 269 ng L-1 for ∑26PFASs and 197 ng L
-1
for ∑7PFASs (Figure 4). The majority of the measured concentrations were well below the guideline value of 90 ng L-1, both for ∑26PFASs and ∑7PFASs (Figure 4).
Figure 4. A) ∑26PFAS and B) ∑7PFAS concentrations in samples from drinking water source
areas (n = 172) sorted from high to low. The red line represents the guideline value of 90 ng L-1 for drinking water from the National Food Agency (the guideline value is for ∑7PFASs
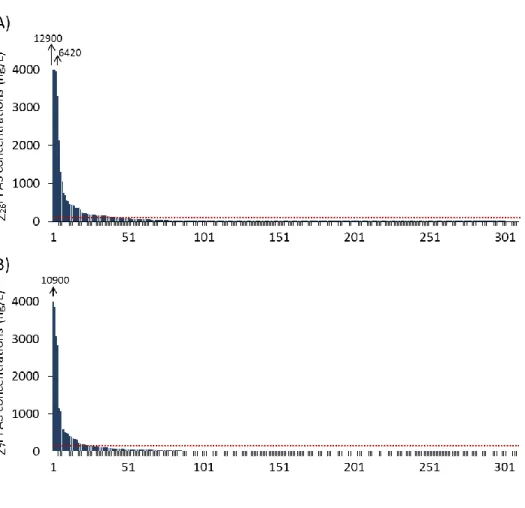
In water not used for drinking water, ∑26PFASs concentrations were on average 142 ng L-1 (median 5.4 ng L-1) and ∑7PFAS concentrations were 108 ng L
-1 (medi-an 4.0 ng L-1), respectively (Figure 5). The high average PFAS concentrations can be explained by the fact that some samples showed extremely high PFAS concen-trations with a maximum value of 12 900 ng L-1 for ∑26PFASs and 10 900 ng L
-1 for ∑7PFASs (Figure 5). Although the water from these sites are currently not used for drinking water, it is interesting to note that the guideline value of 90 ng L-1 was exceeded in 46 samples for ∑26PFASs and 38 samples for ∑7PFASs, respectively.
Figure 5. A) ∑26PFAS and B) ∑7PFAS concentrations in samples from water not used for
drinking water (n = 310) sorted from high to low. The red line represents the guideline value of 90 ng L-1 for drinking water from the National Food Agency in Sweden (the guideline value is for ∑7PFASs including PFPeA, PFHxA, PFHpA, PFOA, PFBS, PFHxS, PFOS).
13
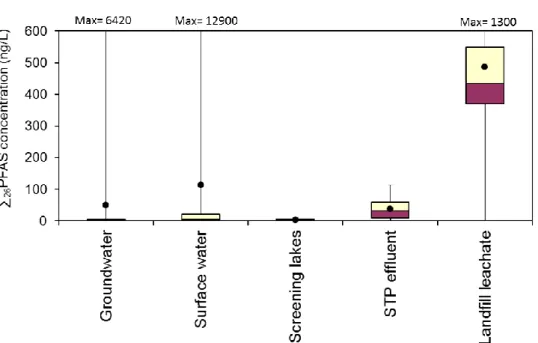
∑26PFAS concentrations were compared between different water categories includ-ing groundwater (n = 164), surface water (n = 285), screeninclud-ing lakes (n = 10), STP effluents (n = 13) and landfill leachates (n = 10) (Figure 6). The landfill leachates had the highest average ∑26PFAS concentration (487 ng L
-1
), while the groundwa-ter and surface wagroundwa-ter had the highest maximum values with 6 420 ng L-1 and 12 900 ng L-1, respectively. The high ∑26PFASs concentrations can be explained by the influence of point sources. It should be noted, that the groundwater sample with the maximum concentration was not taken from a drinking water source area. It should also be noted that due to the low sample number for screening lakes (n = 10), STP effluents (n = 13) and landfill leachates (n = 10), the values found for these categories may not be representative for Sweden as a whole.
Figure 6. Box-and-whisker plots for ∑26PFAS concentrations in groundwater (n = 164),
surface water (n = 285), screening lakes (n = 10), STP effluents (n = 13), and landfill leacha-tes (n = 10).
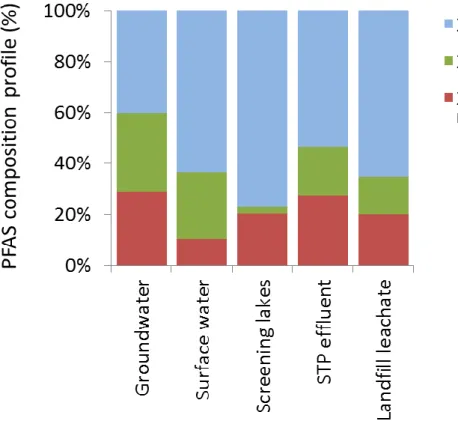
6.3 PFAS composition profile in groundwater, surface
water, STP effluent and landfill leachate
The 26 different PFASs can be subcategorized into ∑PFCAs (PFBA, PFPeA, PFHxA, PFHpA, PFOA, PFNA, PFDA, PFUnDA, PFDoDA, PFTriDA, PFTeDA, PFHxDA, PFOcDA), ∑PFSAs (PFBS, PFHxS, PFOS, PFDS) and ∑PFAS precur-sors (FOSA, MeFOSA EtFOSA, MeFOSE, EtFOSE, FOSAA, MeFOSAA, Et-FOSAA, 6:2 FTSA), based on the functional group and the degree of fluorination of the molecule.
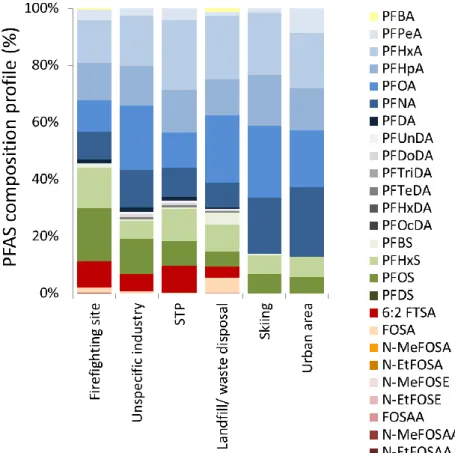
The composition profile of the PFASs differs between the types of waters (Figure 7 and Figure 8). The groundwater samples showed the most even distribution of ∑PFCAs, ∑PFSAs, and ∑PFAS precursors with FOSA and PFHxS being the dom-inant compounds. All other categories had a high fraction of ∑PFCAs (surface water 63%, screening lakes 77%, STP effluents 53%, and landfill leachates 65%). In the screening lakes, only 2.6 % of the total concentration was made up by PFSAs. The STP effluents and landfill leachates had a similar composition based on the PFAS classes ∑PFCAs, ∑PFSAs, and ∑PFAS precursors (Figure 7), but in the STP effluents, the 6:2 FTSA was the dominant PFAS precursor, whereas in landfill leachates 6:2 FTSA and FOSA were the dominant precursors (Figure 8). For ∑PFCAs in both the landfill leachates and STP effluents, the largest fraction was made up by PFOA.
15
Figure 7. Composition profiles (%) for PFCAs, PFSAs, and PFAS precursors for
groundwa-ter (n = 164), surface wagroundwa-ter (n = 285), screening lakes (n =10), sewage treatment plants (STP) effluents (n =13), and landfill leachates (n = 10).
Figure 8. Composition profile (%) for individual PFASs for groundwater (n = 164), surface
water (n = 285), screening lakes (n = 10), sewage treatment plants (STP) effluents (n = 13) and landfill leachates (n = 10).
For the groundwater and surface water sites, potential PFAS sources were identi-fied by CABs and Swedish EPA including the categories firefighting site, unspecif-ic industry, STP, landfill/waste deposal, skiing area and urban area. The composi-tion profile of the different source areas was compared to elucidate source specific composition profiles, which potentially can be used to identify sources (Figure 9 and Figure 10).
For groundwater (Figure 9), the composition profile was dominated by shorter perflurocarbon chain PFCAs (∑C5‒C8 PFCAs ranging from 20% for skiing to 43% for industrial areas), PFHxS (ranging from 18% for industrial areas to 37% for landfill/waste deposal areas, but no PFHxS was detected in skiing areas) and FOSA (ranging from 0.1% for landfill/waste deposal to 75% for skiing areas). However, the results for the landfill/waste deposal, and skiing areas have to be interpreted carefully due to the small sample size (n = 4 and 3, respectively). It is interesting to note that 6:2 FTSA was detected at areas near firefighting sites, unspecific industry and landfill/waste deposal sites but not at areas influenced by skiing and urban sources.
17
Figure 9. Groundwater composition profile (%) for individual PFASs from areas near fire-fighting sites (n = 41), unspecific industry (n = 61), landfill/waste deposal (n = 4), skiing area (n = 3) and urban area (n = 16). Note: Potential sources for the other groundwater sites are not known.
Surface water (Figure 10) showed very different composition profiles compared to the groundwater and was dominated by the shorter perflurocarbon chain PFCAs (∑C5‒C8 PFCAs ranging from 54% for firefighting sites to 85% for skiing areas and urban areas). However, the results for the skiing areas and urban sites have to be interpreted carefully due to the small sample size (n = 6, and 9, respectively). In groundwater, it is interesting to note that PFHxS levels were higher compared to PFOS with a PFHxS/PFOS ratio of 2.3‒3.9 (if both compounds were detected). In contrast, surface water showed similar levels of PFHxS and PFOS with a PFHxS/PFOS ratio of 0.5‒1.8. This could be due to the stronger sorption of PFOS to particles compared to PFHxS (Ahrens et al., 2010), which can lead to an increas-ing fraction of PFHxS in groundwater due to sorption of PFOS to soil particles during the water leaching process (Eschauzier et al., 2013). Similar to ground wa-ter, 6:2 FTSA was detected at sampling sites influenced by firefighting (9.1%), unspecific industry (6.0%), STP (9.3%) and landfill/waste deposal (3.9%), but not at skiing and urban areas (although the STP category did not exist for ground wa-ter).
Figure 10. Surface water composition profile (%) for individual PFASs from areas near fire-fighting sites (n = 142), unspecific industry (n = 46), sewage treatment plants (STP) (n = 14), landfill/waste deposal (n = 20), skiing area (n = 6) and urban area (n = 9). Note: Potential sources for the other surface water sites are not known.
19
In drinking water source areas, the shorter chain perfluorocarbon C5‒C9 PFCAs (45% of the ∑PFASs), C4, C6 and C8 PFSAs (29%), FOSA (20%) and 6:2 FTSA (4.5%) were the dominant PFASs. The detection of FOSA, PFNA, PFDA and 6:2 FTSA is in particular problematic, since they are currently not included in the Swedish drinking water guideline (Swedish National Food Agency, 2015) and therefore not regulated even if they are detected at high concentrations. FOSA is a PFAS precursor and can degrade to PFOS (Rhoads et al., 2008), which is included in the guideline (Swedish National Food Agency, 2015). 6:2 FTSA is also a PFAS precursor and can degrade to shorter chain PFCAs (Wang et al., 2011), which are included in the guideline (Swedish National Food Agency, 2015). It is therefore reasonable to consider the inclusion of these four PFASs (FOSA, PFNA, PFDA, and 6:2 FTSA) in the Swedish drinking water guideline.
References
AHRENS, L. 2011. Polyfluoroalkyl compounds in the aquatic environment: A review of their occurrence and fate. J. Environ. Monitor., 13, 20–31. AHRENS, L., BARBER, J. L., XIE, Z. & EBINGHAUS, R. 2009. Longitudinal
and latitudinal distribution of perfluoroalkyl compounds in the surface water of the Atlantic Ocean. Environ. Sci. Technol., 43, 3122–3127. AHRENS, L. & BUNDSCHUH, M. 2014. Fate and effects of poly- and
per-fluoroalkyl substances in the aquatic environment: A review. Environ.
Toxicol. Chem., 33, 1921–1929.
AHRENS, L., TANIYASU, S., YEUNG, L. W. Y., YAMASHITA, N., LAM, P. K. S. & EBINGHAUS, R. 2010. Distribution of polyfluoroalkyl com-pounds in water, suspended particulate matter and sediment from Tokyo Bay, Japan. Chemosphere, 79, 266–272.
BUCK, R. C., FRANKLIN, J., BERGER, U., CONDER, J. M., COUSINS, I. T., DE VOOGT, P., JENSEN, A. A., KANNAN, K., MABURY, S. A. & VAN LEEUWEN, S. P. J. 2011. Perfluoroalkyl and polyfluoroalkyl sub-stances in the environment: Terminology, classification, and origins.
In-tegr. Environ. Assess. Manag., 7, 513–541.
ESCHAUZIER, C., RAAT, K. J., STUYFZAND, P. J. & DE VOOGT, P. 2013. Perfluorinated alkylated acids in groundwater and drinking water: Identi-fication, origin and mobility. Sci. Total Environ., 458–460, 477–485. GIESY, J. P. & KANNAN, K. 2001. Global distribution of perfluorooctane
sul-fonate in wildlife. Environ. Sci. Technol., 35, 1339–1342.
GIESY, J. P., NAILE, J. E., KHIM, J. S., JONES, K. C. & NEWSTED, J. L. 2010. Aquatic toxicology of perfluorinated chemicals. Rev. Environ.
Con-tam. T., 202, 1–52.
PAUL, A. G., JONES, K. C. & SWEETMAN, A. J. 2009. A first global produ c-tion, emission, and environmental inventory for perfluorooctane sulfonate.
PREVEDOUROS, K., COUSINS, I. T., BUCK, R. C. & KORZENIOWSKI, S. H. 2006. Sources, fate and transport of perfluorocarboxylates. Environ.
Sci. Technol., 40, 32–44.
RHOADS, K. R., JANSSEN, E. M.-L., LUTHY, R. G. & CRIDDLE, C. S. 2008. Aerobic biotransformation and fate of n-ethyl perfluorooctane sul-fonamidoethanol (n-EtFOSE) in activated sludge. Environ. Sci. Technol., 42, 2873–2878.
Swedish National Food Agency (Livsmedelsverket) 2015. Riskhantering - PFAA I dricksvatten. http://www.livsmedelsverket.se/livsmedel-och- innehall/oonskade-amnen/miljogifter/pfas-poly-och-perfluorerade-alkylsubstanser/riskhantering-pfaa-i-dricksvatten/ (14/11/2015).
TANIYASU, S., YAMASHITA, N., YAMAZAKI, E., PETRICK, G. & KAN-NAN, K. 2013. The environmental photolysis of perfluorooctanesulfonate, perfluorooctanoate, and related fluorochemicals. Chemosphere, 90, 1686– 1692.
The European Parliament and of the Council. Off J Eur Commun EC Directive 2013/39/EU, in Amending Directives 2000/60/EC and 2008/105/EC as re-gards priority substances in the field of water policy.
WANG, N., LIU, J., BUCK, R. C., KORZENIOWSKI, S. H.,
WOL-STENHOLME, B. W., FOLSOM, P. W. & SULECKI, L. M. 2011. 6:2 Fluorotelomer sulfonate aerobic biotransformation in activated sludge of waste water treatment plants. Chemosphere, 82, 853–858.
VIERKE, L., STAUDE, C., BIEGEL-ENGLER, A., DROST, W. & SCHULTE, C. 2012. Perfluorooctanoic acid (PFOA) — main concerns and regulatory developments in Europe from an environmental point of view. Environ.
Institutionen för vatten och miljö, SLU tel: +46 (0)18-67 10 00 Box 7050, SE-750 07 Uppsala, Sweden www.slu.se/vatten-miljo Org.nr 202100-2817
7 Appendix
Table A1. Overview of sample ID, county, coordinates, type of water, water usage, and sampling depth
aID County Latitude Longitude Type of water
Drinking
water source Sampling depth (m)
1-1 Gotland NA NA groundwater yes NA
1-2 Gotland NA NA groundwater yes NA
1-3 Gotland NA NA groundwater yes NA
2 Gotland NA NA groundwater yes NA
3 Gotland NA NA surface water yes NA
4 Gotland NA NA groundwater yes NA
5 Gotland NA NA groundwater yes NA
6 Gotland NA NA groundwater yes NA
7 Gotland NA NA surface water yes NA
8 Gotland NA NA surface water yes NA
9 Gotland NA NA groundwater yes NA
10 Gotland NA NA groundwater yes NA
11 Gotland NA NA groundwater yes NA
12 Gotland NA NA groundwater yes NA
13 Gotland NA NA groundwater yes NA
14 Gotland NA NA groundwater yes NA
15 Gotland NA NA groundwater yes NA
16 Gotland NA NA groundwater yes NA
17 Gotland NA NA groundwater yes NA
18 Gotland NA NA groundwater yes NA
ID County Latitude Longitude Type of water
Drinking
water source Sampling depth (m)
21 Gotland 698598 6396727 surface water no NA
22 Gotland NA NA groundwater yes NA
23 Gotland NA NA groundwater yes NA
24 Gotland NA NA groundwater yes NA
25 Gotland NA NA groundwater yes NA
26 Gotland NA NA groundwater yes NA
27 Gotland NA NA surface water yes NA
28 Gotland NA NA groundwater yes NA
29 Gotland NA NA groundwater yes NA
30 Gotland NA NA groundwater yes NA
31-1 Dalarna 6664694 567468 surface water no 0.01
31-2 Dalarna 6664694 567468 surface water no 0.01
31-3 Dalarna 6664694 567468 surface water no 0.01
32 Dalarna 6665522 568930 surface water no 0.01
33 Dalarna 6720974 535886 surface water no 0.01
34 Dalarna 6716685 536316 surface water no 0.01
35 Dalarna 6732942 500829 surface water no 0.01
36 Dalarna 6758174 475187 surface water no 0.01
37 Dalarna 6775652 408256 surface water no 0.01
38 Dalarna 6674437 572707 surface water no 0.01
39-1 Gävleborg 6798795 571295 surface water no NA
39-2 Gävleborg 6798795 571295 surface water no NA
39-3 Gävleborg 6798795 571295 surface water no NA
40 Gävleborg 6801015 551511 surface water no NA
41 Gävleborg 6800881 576092 surface water no NA
42 Gävleborg NA NA groundwater yes NA
43 Gävleborg NA NA groundwater yes NA
44 Gävleborg 6719768 588676 groundwater no NA
23
ID County Latitude Longitude Type of water
Drinking
water source Sampling depth (m)
46 Gävleborg 6744352 620335 groundwater no NA
47 Gävleborg NA NA groundwater yes NA
48 Gävleborg NA NA groundwater yes NA
49 Gävleborg 6857155 557042 surface water no NA
50 Gävleborg NA NA groundwater yes NA
51 Gävleborg NA NA surface water yes NA
52 Gävleborg NA NA groundwater yes NA
53 Gävleborg NA NA groundwater yes NA
54 Gävleborg NA NA groundwater yes NA
55 Gävleborg 6797260 611909 surface water no NA
56 Gävleborg 6756186 610251 surface water no NA
57 Gävleborg 6727694 613504 surface water no NA
58 Gävleborg NA NA groundwater yes NA
59 Gävleborg 6739516 619413 groundwater no NA
60 Gävleborg NA NA groundwater yes NA
61 Gävleborg NA NA groundwater yes NA
62 Gävleborg 6722088 607862 surface water no NA
63 Gävleborg 6713400 614728 surface water no NA
64 Gävleborg 6708612 579890 surface water no NA
65 Gävleborg 6710745 573452 surface water no NA
66 Gävleborg 6751782 593770 surface water no NA
67 Gävleborg NA NA groundwater yes NA
68 Gävleborg NA NA groundwater yes NA
69 Gävleborg NA NA groundwater yes NA
70 Gävleborg NA NA groundwater yes NA
71 Gävleborg NA NA groundwater yes NA
72 Gävleborg 6843791 608200 surface water no NA
73 Gävleborg 6844977 607245 leachate no NA
ID County Latitude Longitude Type of water
Drinking
water source Sampling depth (m)
75 Gävleborg 6838821 607396 surface water no NA
76 Gävleborg 6835746 610083 surface water no NA
77 Gävleborg 6835675 610521 surface water no NA
78 screening lakes 6633396 530845 surface water no 0.5
79 screening lakes 6835462 584003 surface water no 0.5
80 screening lakes 6282493 381448 surface water no 0.5
81 screening lakes 6524272 6528886 surface water no 0.5
82 screening lakes 6423441 564895 surface water no 0.5
83 screening lakes 7580298 649261 surface water no 0.5
84 screening lakes 6555227 634745 surface water no 0.5
85 screening lakes 6272735 544544 surface water no 0.5
86 screening lakes 6327724 471494 surface water no 0.5
87 screening lakes 7085765 660807 surface water no 0.5
88-1 Halland NA NA groundwater yes 50
88-2 Halland NA NA groundwater yes 50
88-3 Halland NA NA groundwater yes 50
89 Halland NA NA groundwater yes 18
90 Halland NA NA surface water yes NA
91 Halland NA NA groundwater yes 33
92 Halland NA NA surface water yes NA
93 Halland NA NA groundwater yes 36
94 Halland NA NA groundwater yes 13
95 Halland NA NA groundwater yes 13
96 Halland NA NA groundwater yes 90
97 Halland NA NA groundwater yes NA
98 Halland 6315894 392368 surface water no NA
99 Halland 6286362 379913 surface water no NA
100 Halland NA NA groundwater yes NA
25
ID County Latitude Longitude Type of water
Drinking
water source Sampling depth (m)
102 Halland NA NA surface water yes NA
103 Halland NA NA groundwater yes NA
104 Halland NA NA groundwater yes NA
105 Halland NA NA groundwater yes NA
106 Halland NA NA groundwater yes NA
107 Halland 6285178 378498 surface water no NA
108 Halland 6335520 336000 surface water no NA
109 Halland NA NA groundwater yes NA
110 Halland 6278497 373246 surface water no NA
111-1 Västmanland 6608379 588370 surface water no 0.2
111-2 Västmanland 6608379 588370 surface water no 0.2
111-3 Västmanland 6608379 588370 surface water no 0.2
112 Västmanland 6599275 571857 surface water no 0.2
113 Västmanland 6607963 592286 groundwater no 0.2
114 Västmanland 6642614 590931 surface water no 0.2
115 Västmanland 6642654 591714 surface water no 0.2
116 Västmanland 6643765 596296 leachate no 0.2
117 Västmanland NA NA groundwater yes NA
118 Västmanland NA NA groundwater yes NA
119 Västmanland NA NA groundwater yes NA
120 Västmanland NA NA groundwater yes NA
121 Västmanland NA NA groundwater yes NA
122-1 Östergötland 6467216 506972 surface water no 0.4
122-2 Östergötland 6467216 506972 surface water no 0.4
122-3 Östergötland 6467216 506972 surface water no 0.4
123 Östergötland NA NA groundwater yes 0.4
124 Östergötland NA NA surface water yes 0.4
125 Östergötland NA NA groundwater yes 0.4
ID County Latitude Longitude Type of water
Drinking
water source Sampling depth (m)
127 Östergötland NA NA groundwater yes 0.4
128 Östergötland 6497956 572374 surface water no 0.4
129 Östergötland NA NA groundwater yes 0.4
130 Östergötland 6473359 528443 surface water no 0.4
131 Östergötland NA NA surface water yes 0.4
132 Östergötland 6471858 536038 surface water no 0.4
133 Östergötland 6495470 571458 surface water no 0.4
134 Östergötland 6476551 536597 surface water no 0.4
135-1 Örebro 6570646 514753 ditch, outlet STP no 0.1
135-2 Örebro 6570646 514753 ditch, outlet STP no 0.1
135-3 Örebro 6570646 514753 ditch, outlet STP no 0.1
136 Örebro 6335520 336007 surface water no 0.1
137 Örebro 6573917 466748 surface water no 0.1
138 Örebro 6579573 471913 surface water no 0.1
139 Örebro NA NA groundwater yes NA
140 Örebro 6574333 472503 STP effluent no NA
141 Örebro 6553511 508086 ditch (surface water) no NA
142 Örebro 6607027 510622 surface water no 0.1
143 Örebro 6563786 512552 surface water no 0.1
144 Örebro 6571286 513152 surface water no 0.1
145 Örebro 6570401 513803 surface water no 0.1
146 Örebro 6554427 509186 ditch, outlet STP no 0.1
147 Örebro 6555993 512152 ditch (surface water) no 0.1
148 Örebro 6569247 507678 surface water no 0.1
150 Örebro 6570522 513268 surface water no 0.1
151 Örebro 6552085 505234 ditch (surface water) no 0.1
152 Örebro 6551769 505458 ditch (surface water) no 0.1
153 Örebro 6540959 503381 surface water no 0.1
27
ID County Latitude Longitude Type of water
Drinking
water source Sampling depth (m)
155 Örebro 6563657 502446 surface water no 0.1
156 Örebro 6563022 503483 surface water no 0.1
157 Jämtland NA NA groundwater yes NA
158 Jämtland NA NA groundwater yes NA
159 Jämtland NA NA groundwater yes NA
160 Jämtland NA NA groundwater yes NA
161 Jämtland 6976369 512296 surface water no 0.1
162 Jämtland NA NA groundwater yes NA
163 Jämtland 6948444 367681 surface water no 0.1
164 Jämtland 6999935 531180 surface water no 0.1
165 Jämtland NA NA groundwater yes NA
166 Jämtland 7006884 473914 surface water no 0.1
167 Jämtland NA NA groundwater yes NA
168-1 Jönköping 6357577 424407 surface water no 0.5
168-2 Jönköping 6357577 424407 surface water no 0.5
168-3 Jönköping 6357577 424407 surface water no 0.5
169 Jönköping NA NA surface water yes NA
170 Jönköping NA NA surface water yes NA
171 Jönköping 6363838 506462 STP effluent no NA
172 Jönköping 6363561 506959 STP effluent no NA
173 Jönköping 6362796 499049 other, leachate no NA
174 Jönköping NA NA groundwater yes 11
175 Jönköping NA NA groundwater yes 25
176 Jönköping 6430571 499195 surface water no 0.5
177 Jönköping 6390159 495108 surface water no 0.5
178 Jönköping 6365998 510136 surface water no NA
179 Jönköping 6365922 506299 surface water no 0.5
180 Jönköping 6343368 508904 surface water no 0.5
ID County Latitude Longitude Type of water
Drinking
water source Sampling depth (m)
182 Jönköping 6389294 498733 surface water no 0.5
183 Jönköping 6361922 479419 surface water no 0.5
184 Jönköping 6338624 443315 surface water no 0.5
185 Jönköping 6360483 424396 surface water no 0.5
186 Jönköping 6346442 415215 surface water no 0.5
187 Jönköping 6400603 444423 surface water no 0.5
188 Jönköping 6360889 421444 other, leachate no NA
189 Jönköping 6350027 414255 other, leachate no NA
190 Jönköping 6349303 411325 surface water no 0.5
191 Jönköping 6353742 431506 surface water no 0.5
192 Jönköping 6348772 417138 surface water no 0.5
193 Jönköping 6360562 420967 surface water no 0.5
194-1 Kalmar 6334274 587662 surface water no 0.1
194-2 Kalmar 6334274 587662 surface water no 0.1
194-3 Kalmar 6334274 587662 surface water no 0.1
195 Kalmar NA NA surface water yes NA
196 Kalmar NA NA groundwater yes NA
197 Kalmar NA NA groundwater yes NA
198 Kalmar NA NA groundwater yes NA
199 Kalmar NA NA groundwater yes NA
200 Kalmar NA NA groundwater yes NA
201 Kalmar 6345205 587274 surface water no 0.1
202 Kalmar 6275331 534074 surface water no 0.1
203 Kalmar 6290494 554843 surface water no 0.1
204 Kalmar 6252242 562740 surface water no 0.1
205 Kalmar 6376141 551648 surface water no 0.1
206 Kalmar 6335764 588520 surface water no 0.1
207 Kalmar 6334976 588387 surface water no 0.1
29
ID County Latitude Longitude Type of water
Drinking
water source Sampling depth (m)
209 Kalmar NA NA groundwater yes NA
210 Blekinge 6226200 490631 surface water no 0.2
211 Blekinge NA NA groundwater yes NA
212 Blekinge NA NA groundwater yes NA
213 Blekinge NA NA groundwater yes NA
214 Blekinge NA NA groundwater yes NA
215 Blekinge NA NA groundwater yes NA
216 Blekinge NA NA surface water yes 0.2
217 Blekinge 6236953 470311 surface water no 0.2
218 Blekinge 6236649 470823 surface water no 0.2
219 Blekinge 6212155 475452 surface water no 0.2
220 Blekinge 6230484 517978 surface water no 0.2
222 Norrbotten NA NA groundwater yes NA
223 Norrbotten 7279456 698266 groundwater no NA
224 Norrbotten 7314962 806272 recipient water (surface water) no NA
225 Norrbotten 7317959 802055 surface water no NA
226 Norrbotten 7290976 836720 recipient water (surface water) no NA
227 Norrbotten 7290435 835402 recipient water (surface water) no NA
228 Norrbotten 7461772 749192 recipient water (surface water) no NA
229 Norrbotten 7459598 749460 recipient water (surface water) no NA
230 Norrbotten 7388333 883147 recipient water (surface water) no NA
234 Norrbotten NA NA surface water yes NA
236 Norrbotten NA NA groundwater yes NA
237 Norrbotten 7265408 796201 leachate no NA
238 Norrbotten 7265561 796158 recipient water (surface water) no NA
239 Norrbotten 7316985 803511 recipient water (surface water) no NA
240 Norrbotten 7543386 755076 groundwater no NA
241 Norrbotten 7536864 722426 leachate no NA
ID County Latitude Longitude Type of water
Drinking
water source Sampling depth (m)
243 Norrbotten 7459891 748294 STP effluent no NA
244 Norrbotten NA NA groundwater yes NA
245 Norrbotten NA NA groundwater yes NA
246 Norrbotten 7289444 832681 STP effluent no NA
247 Norrbotten 7395118 715112 STP effluent no NA
248 Norrbotten NA NA surface water yes NA
249 Norrbotten NA NA groundwater yes NA
250 Norrbotten NA NA surface water yes NA
251 Norrbotten NA NA groundwater yes NA
252 Norrbotten 7327150 870945 recipient water (surface water) no NA
253 Norrbotten NA NA groundwater yes NA
254 Norrbotten 7319452 807302 leachate no NA
255 Norrbotten 7255595 801144 STP effluent no NA
256 Norrbotten 7300375 819960 recipient water (surface water) no NA
257 Norrbotten 7300258 819960 leachate no NA
258 Stockholm 6541218 664404 surface water no 0.1
259 Stockholm 6565340 659946 surface water no 0.1
260 Stockholm 6567962 683162 surface water no 0.1
261 Stockholm 6578338 669663 surface water no 0.1
262 Stockholm 6582635 663350 surface water no 0.1
263 Stockholm 6583729 654919 surface water no 0.1
264 Stockholm 6597482 670739 surface water no 0.1
265 Stockholm 6599706 663465 surface water no 0.1
266 Stockholm 6606669 664071 surface water no 0.1
267 Stockholm 6569118 672765 surface water no 0.1
268 Stockholm 6563617 650966 surface water no 0.1
269 Stockholm 6544522 661329 surface water no 0.1
270 Stockholm 6552105 649461 surface water no 0.1
31
ID County Latitude Longitude Type of water
Drinking
water source Sampling depth (m)
272 Stockholm 6589575 660595 surface water no 0.1
273 Stockholm 6587119 664016 surface water no 0.1
274 Stockholm 6586214 665036 surface water no 0.1
275 Stockholm 6598174 686459 surface water no 0.1
276 Stockholm 6630225 708169 surface water no 0.1
277 Stockholm 6626759 690029 surface water no 0.1
278 Stockholm 6662428 699956 surface water no 0.1
279 Stockholm 6566360 664000 surface water no 0.1
280 Stockholm NA NA surface water yes 0.1
281 Stockholm 6546310 661795 groundwater no 0.1
283 Stockholm NA NA groundwater yes NA
284 Stockholm NA NA groundwater yes NA
285 Södermanland 6542007 567935 surface water no 0.1
286 Södermanland 6543014 568689 surface water no 0.1
287 Södermanland 6541682 568819 surface water no 0.1
288 Södermanland 6540305 570561 storm water, surface water no 0.1
289 Södermanland 6543825 542466 surface water no 0.1
290 Södermanland 6546275 551573 surface water no 0.1
291 Södermanland 6539359 566917 surface water no 0.1
292 Södermanland 6535211 574615 surface water no 0.1
293 Södermanland 6520504 588555 surface water no 0.1
294 Södermanland 6537791 570981 STP effluent no 0.1
295 Södermanland 6546776 591393 surface water no 0.1
296 Södermanland 6507923 616486 surface water no 0.05
297 Södermanland 6508158 618662 surface water, coast no 0.1
298 Södermanland 6516730 614502 surface water no 0.1
299 Södermanland 6512955 617492 surface water, coast no 0.1
300 Södermanland NA NA groundwater yes NA
ID County Latitude Longitude Type of water
Drinking
water source Sampling depth (m)
302 Södermanland 7024408 690108 STP effluent no 0.1
303 Södermanland NA NA groundwater yes NA
305 Västernorrland 7024408 690108 surface water no 0.1
306 Västernorrland 7007019 613072 surface water no 0.1
307 Västernorrland 7036616 701226 surface water no 0.1
308 Västernorrland 6975742 647476 surface water no 0.1
309 Västernorrland 7010707 610664 surface water no 0.1
310 Västernorrland 6934382 625047 surface water no 0.1
311 Västernorrland 7007499 615114 surface water no 0.1
312 Västernorrland 6614548 365111 surface water no 0.5
313 Västernorrland 6984362 638437 surface water no 0.1
314 Västernorrland 7021434 683887 surface water no 0.1
315 Västernorrland NA NA groundwater yes NA
316 Västernorrland NA NA groundwater yes NA
318 Kronoberg 6298690 435110 surface water no 0.1
319 Kronoberg NA NA groundwater yes NA
320 Kronoberg 6305894 484308 surface water no 0.1
321 Kronoberg NA NA groundwater yes NA
322 Västra Götaland NA NA groundwater yes 12
323 Västerbotten 7272092 616648 surface water no 0.05
324 Västerbotten NA NA groundwater yes 3
326 Västerbotten 7179046 792958 surface water no 0.1
327 Värmland 6619953 452620 surface water no 0.5
328 Värmland 6578299 410765 surface water no 0.5
329 Värmland 6584896 414108 surface water no 0.5
330 Värmland 6656364 426471 surface water no 0.5
331 Värmland 6640793 347692 groundwater no 0.1
332 Värmland 6979720 643156 surface water no 0.1
33
ID County Latitude Longitude Type of water
Drinking
water source Sampling depth (m)
334 Värmland 6612171 427399 surface water no 0.5
335 Värmland NA NA groundwater yes 82
336 Värmland 6551797 379567 surface water no 0.5
337 Skåne 6193250 366700 surface water no 0.1
338 Skåne 6194357 364977 surface water no 0.1
339 Skåne 6239317 367582 surface water no 0.1
340 Skåne 6239032 367287 surface water no 0.1
341 Skåne 6237749 366769 surface water no 0.1
342 Skåne NA NA groundwater yes 6
343 Skåne 6218344 386300 surface water no 0.1
344 Skåne 6216322 390389 surface water no 0.1
345 Skåne 6217501 388842 surface water no 0.1
346 Skåne 6216106 388622 surface water no 0.1
347 Skåne 6217956 386764 surface water no 0.1
348 Skåne 6215982 386883 surface water no 0.1
349 Skåne NA NA groundwater yes 120
350 Skåne NA NA groundwater yes 32
351 Skåne 6193250 366700 surface water no 0.1
352 Skåne 6194357 364977 surface water no 0.1
353 Skåne 6239317 367582 surface water no 0.1
354 Skåne 6239032 367287 surface water no 0.1
355 Skåne 6237749 366769 surface water no 0.1
356 Skåne NA NA groundwater yes 6
357 Skåne 6218344 386300 surface water no 0.1
358 Skåne 6216322 390389 surface water no 0.1
359 Skåne 6217501 388842 surface water no 0.1
360 Skåne 6216106 388622 surface water no 0.1
361 Skåne 6217956 386763 surface water no 0.1
ID County Latitude Longitude Type of water
Drinking
water source Sampling depth (m)
363 Skåne NA NA groundwater yes 120
364 Skåne NA NA groundwater yes 32
365 Skåne 6240135 366323 groundwater no NA
366 Skåne 6217440 390250 surface water no 0.1
367 Västra Götaland 6477547 437301 surface water no 0.2
368 Västra Götaland 6474660 436302 surface water no 0.2
369 Västra Götaland 6449257 417488 surface water no 0.2
370 Västra Götaland 6391846 350689 surface water no 0.2
371 Västra Götaland 6389094 337879 surface water no 0.2
372 Västra Götaland 6388683 339247 surface water no 0.2
373 Västra Götaland 6397034 375603 surface water no 0.2
374 Västra Götaland 6409829 313384 surface water no 0.2
375 Västra Götaland 6396297 375345 surface water no 0.2
376 Västra Götaland 6375037 361319 surface water no 0.2
377 Västra Götaland 6393239 374310 surface water no 0.2
378 Västra Götaland 6409619 314908 surface water no 0.2
379 Västra Götaland 6392303 374234 surface water no 0.2
380 Västra Götaland 6370742 355162 surface water no 0.2
381 Västra Götaland 6486406 470414 surface water no 0.2
382 Västra Götaland 6486595 470144 surface water no 0.2
383 Västra Götaland 6481396 440289 surface water no 0.2
384 Västra Götaland 6359755 349112 surface water no 0.2
385 Västra Götaland 6400418 308561 Fire dam, surface water no 0.2
386 Västra Götaland 6400550 308554 surface water no 0.2
387 Uppsala 6650692 650398 surface water no 0.1
388 Uppsala 6645520 604240 surface water no 0.1
389 Uppsala 6624327 630205 surface water no 0.1
390 Uppsala 6612554 616769 surface water no 0.1
35
ID County Latitude Longitude Type of water
Drinking
water source Sampling depth (m)
392 Uppsala 6601918 642110 surface water no 0.1
393 Uppsala 6607363 640470 surface water no 0.05
394 Uppsala NA NA groundwater yes NA
395 Uppsala NA NA groundwater yes NA
396 Uppsala NA NA groundwater yes NA
397 Uppsala NA NA groundwater yes NA
398 Uppsala NA NA groundwater yes NA
399 Uppsala NA NA groundwater yes NA
409 Södermanland 6587478 583382 surface water no 0.1
410 Södermanland 6589114 593043 surface water no 0.1
411 Södermanland 6581120 616466 surface water no 0.1
412 Södermanland 6584872 613442 surface water no 0.1
414 Södermanland 6547253 632040 surface water no 0.1
415 Södermanland NA NA groundwater yes NA
416 Södermanland NA NA groundwater yes NA
418 Stockholm NA NA groundwater yes NA
420 Uppsala 6692221 639756 surface water no 0.1
421 Uppsala 6692241 639806 surface water no 0.1
422 Uppsala 6685073 635229 surface water no 0.05
423 Uppsala 6690992 633724 surface water no 0.1
424 Uppsala 6670389 672806 surface water no 0.05
425 Uppsala 6676479 677454 surface water no 0.1
426 Uppsala 6685282 686299 surface water no 0.1
427 Uppsala 6685846 687126 surface water no 0.1
428 Uppsala 6624363 656572 surface water no 0.1
429 Uppsala 6624268 653392 surface water no 0.1
430 Uppsala 6622837 655470 surface water no 0.1
431 Uppsala 6623323 656975 surface water no 0.1
ID County Latitude Longitude Type of water
Drinking
water source Sampling depth (m)
433 Uppsala 6661242 643532 surface water no 0.05
434 Uppsala 6644261 641627 surface water no 0.1
435 Gävleborg 6833971 613180 surface water no NA
436 Gävleborg 6843691 610995 surface water no NA
437 Gävleborg 6842223 603772 surface water no NA
438 Halland NA NA groundwater yes NA
441 Halland NA NA groundwater yes NA
442 Halland NA NA groundwater yes NA
443 Halland 6280605 371791 surface water no NA
445 Halland 6285317 370155 groundwater no NA
446 Halland 6294966 376353 surface water no NA
447 Halland 6318444 392058 surface water no NA
448 Halland 6336328 334442 surface water no NA
449 Halland NA NA groundwater yes 5
450-1 Jämtland NA NA groundwater yes NA
450-2 Jämtland NA NA groundwater yes NA
450-3 Jämtland NA NA groundwater yes NA
451 Jämtland 7070292 382033 surface water no 0.1
452 Jämtland 6983887 554878 surface water no 0.1
453 Jämtland 7089131 424141 surface water no 0.1
454 Jämtland 7006643 472271 surface water no 0.1
456 Västra Götaland NA NA groundwater yes NA
457 Västra Götaland NA NA groundwater yes 73 m (filter 14 m)
458 Västra Götaland NA NA groundwater yes 30
459 Västra Götaland 6481074 366272 surface water no 0.2
460 Västra Götaland NA NA groundwater yes 22.5 m (filter 7 m)
461 Västra Götaland NA NA surface water yes 0.2
462 Västra Götaland 6465616 343058 surface water no 0.2
37
ID County Latitude Longitude Type of water
Drinking
water source Sampling depth (m)
464 Västra Götaland 6442010 313729 groundwater no 1.5-2
465 Västra Götaland 6465705 342720 surface water no 0.2
466 Västra Götaland 6406045 312842 surface water no 0.2
467 Västra Götaland NA NA groundwater yes 22 m (filter 5 m)
468 Västra Götaland 6471566 319871 surface water no 0.2
469 Västra Götaland 6540775 279739 surface water no 0.2
470 Västra Götaland 6467931 343889 surface water no 0.2
471 Västra Götaland NA NA groundwater yes 14 m (filter 3 m)
472 Västra Götaland 6541581 280145 surface water no 0.2
473 Västra Götaland 6442010 313729 groundwater no 1.5
474 Västra Götaland 6471527 318123 surface water no 0.2
475 Västra Götaland 6441865 313755 surface water no 0.2
476 Gotland 6391721 695317 STP effluent no NA
477 Gotland 695317 695317 surface water no NA
478 Dalarna NA NA groundwater yes NA
479 Dalarna NA NA groundwater yes NA
480 Jämtland 7007591 483856 surface water no 0.1
481 Västernorrland 7059850 646292 surface water no 0.05
482 Västernorrland 7005519 618803 surface water no 0.1
483 Västernorrland 7005831 615937 surface water no 0.1
484 Västernorrland 7008184 621549 surface water no 0.1
485 Västernorrland 6916752 620256 surface water no 0.1
486 Västernorrland 6992124 640417 surface water no 0.1
487 Västernorrland 6931726 536127 surface water no 0.1
488 Västernorrland 6927316 568581 surface water no 0.1
489 Västernorrland NA NA groundwater yes NA
490 Västra Götaland NA NA groundwater yes NA
491 Västra Götaland 6481637 368066 surface water no 0.2
ID County Latitude Longitude Type of water
Drinking
water source Sampling depth (m)
494 Västra Götaland NA NA groundwater yes NA
497 Västra Götaland 6481038 365659 surface water no 0.2
498 Västra Götaland NA NA groundwater yes 5-15.5
499 Västra Götaland NA NA groundwater yes 15
500 Västra Götaland NA NA groundwater yes 20
501 Västra Götaland NA NA groundwater yes 23
502 Västra Götaland NA NA groundwater yes 25
503 Västra Götaland NA NA groundwater yes 27
504 Västra Götaland NA NA groundwater yes 6
505 Västra Götaland NA NA groundwater yes 14-20
506 Västra Götaland NA NA groundwater yes 7-9m
507 Västra Götaland NA NA groundwater yes 10
508 Västra Götaland NA NA groundwater yes 14
509 Västra Götaland NA NA groundwater yes NA
510 Västra Götaland NA NA groundwater yes 11
511 Västra Götaland NA NA groundwater yes 8
512 Västernorrland NA NA groundwater yes 2
a
1
Table A2. Overview of PFCA and PFSA concentrations
ID PFBA PFPeA PFHxA PFHpA PFOA PFNA PFDA PFUnDA PFDoDA PFTriDA PFTeDA PFHxDA PFOcDA PFBS PFHxS PFOS PFDS 1-1 <0.25 <0.03 <0.09 <0.05 <0.40 <0.08 <0.19 <0.16 <0.19 <0.05 <0.05 <0.05 <0.25 <0.22 <0.15 <0.21 <0.25 1-2 <0.25 <0.03 <0.09 <0.05 <0.40 <0.08 <0.19 <0.16 <0.19 <0.05 <0.05 <0.05 <0.25 <0.22 <0.15 <0.21 <0.25 1-3 <0.25 <0.03 <0.09 <0.05 <0.40 <0.08 0.2 <0.16 <0.19 <0.05 <0.05 <0.05 <0.25 <0.22 <0.15 <0.21 <0.25 2 <0.25 <0.03 0.3 <0.05 <0.40 0.1 1.3 <0.16 <0.19 <0.05 <0.05 <0.05 <0.25 <0.22 <0.15 <0.21 <0.25 3 <0.25 <0.03 <0.09 0.2 0.4 0.4 0.7 <0.16 <0.19 <0.05 <0.05 <0.05 <0.25 <0.22 <0.15 <0.21 <0.25 4 <0.25 <0.03 <0.09 <0.05 <0.40 <0.08 <0.19 <0.16 <0.19 <0.05 <0.05 <0.05 <0.25 <0.22 <0.15 <0.21 <0.25 5 <0.25 <0.03 <0.09 <0.05 <0.40 <0.08 0.5 <0.16 <0.19 <0.05 <0.05 <0.05 <0.25 <0.22 <0.15 <0.21 <0.25 6 <0.25 <0.03 <0.09 <0.05 <0.40 <0.08 0.3 <0.16 <0.19 <0.05 <0.05 <0.05 <0.25 <0.22 <0.15 <0.21 <0.25 7 <0.25 <0.03 <0.09 0.4 0.5 0.4 0.8 <0.16 <0.19 <0.05 <0.05 <0.05 <0.25 <0.22 <0.15 <0.21 <0.25 8 <0.25 <0.03 <0.09 <0.05 <0.40 <0.08 0.4 <0.16 <0.19 <0.05 <0.05 <0.05 <0.25 <0.22 <0.15 <0.21 <0.25 9 <0.25 <0.03 <0.09 <0.05 <0.40 <0.08 <0.19 <0.16 <0.19 <0.05 <0.05 <0.05 <0.25 <0.22 <0.15 <0.21 <0.25 10 <0.25 <0.03 <0.09 <0.05 <0.40 <0.08 <0.19 <0.16 <0.19 <0.05 <0.05 <0.05 <0.25 <0.22 <0.15 <0.21 <0.25 11 <0.25 <0.03 <0.09 <0.05 <0.40 <0.08 <0.19 <0.16 <0.19 <0.05 <0.05 <0.05 <0.25 <0.22 <0.15 <0.21 <0.25 12 <0.25 <0.03 <0.09 <0.05 <0.40 <0.08 <0.19 <0.16 <0.19 <0.05 <0.05 <0.05 <0.25 <0.22 <0.15 <0.21 <0.25 13 <0.25 <0.03 <0.09 <0.05 <0.40 <0.08 <0.19 <0.16 <0.19 <0.05 <0.05 <0.05 <0.25 <0.22 <0.15 <0.21 <0.25 14 <0.25 <0.03 <0.09 <0.05 <0.40 <0.08 <0.19 <0.16 <0.19 <0.05 <0.05 <0.05 <0.25 <0.22 <0.15 <0.21 <0.25 15 <0.25 <0.03 <0.09 <0.05 <0.40 <0.08 <0.19 <0.16 <0.19 <0.05 <0.05 <0.05 <0.25 <0.22 <0.15 <0.21 <0.25 16 <0.25 <0.03 <0.09 <0.05 <0.40 <0.08 <0.19 <0.16 <0.19 <0.05 <0.05 <0.05 <0.25 <0.22 <0.15 <0.21 <0.25 17 <0.25 <0.03 <0.09 <0.05 <0.40 <0.08 <0.19 <0.16 <0.19 <0.05 <0.05 <0.05 <0.25 <0.22 <0.15 <0.21 <0.25 18 <0.25 <0.03 <0.09 <0.05 <0.40 <0.08 <0.19 <0.16 <0.19 <0.05 <0.05 <0.05 <0.25 <0.22 <0.15 <0.21 <0.25 20 6.2 7.5 18 6.8 7.5 0.5 0.3 <0.16 <0.19 <0.05 <0.05 <0.05 <0.25 3.5 49 66 <0.25 21 1.0 0.8 1.4 0.6 0.9 <0.08 0.2 <0.16 <0.19 <0.05 <0.05 <0.05 <0.25 1.3 9.0 11 <0.25 22 <0.25 <0.03 <0.09 <0.05 <0.40 <0.08 <0.19 <0.16 <0.19 <0.05 <0.05 <0.05 <0.25 <0.22 <0.15 <0.21 <0.25 23 <0.25 <0.03 <0.09 <0.05 <0.40 <0.08 <0.19 <0.16 <0.19 <0.05 <0.05 <0.05 <0.25 <0.22 <0.15 <0.21 <0.25 24 <0.25 <0.03 <0.09 <0.05 <0.40 <0.08 <0.19 <0.16 <0.19 <0.05 <0.05 <0.05 <0.25 <0.22 0.5 <0.21 <0.25