PAPER WITHIN Production Systems
AUTHOR: Christian Capadrutt & Marcus Ljung JÖNKÖPING June 2020
Internet of Things
and the next
generation of supply
chains
Creating visibility through connectivity in an
end-to-end automotive supply chain
This exam work has been carried out at the School of Engineering in Jönköping in the subject area Production system with a specialization in production development and management. The work is a part of the Master of Science program.
The authors take full responsibility for opinions, conclusions and findings presented.
Examiner: Per Hilletofth Supervisor: Nina Edh Mirzaei
Scope: 30 credits (second cycle)
Abstract
With the fourth industrial revolution, new technologies and business opportunities arise, enabling previously unknown performance improvement possibilities within the manufacturing industry and its supply chains. The main actor within Industry 4.0; Internet of things (IoT) promises benefits across the entire logistics value chain by increasing supply chain connectivity and visibility. However, IoT is still in its initial stages in the manufacturing industry and respective supply chain environment, leaving uncertainty about possible application areas and impacts. The purpose of this study is therefore to investigate the role IoT-technologies have in enabling supply chain visibility and connectivity, and the impact on supply chain performance. To answer the proposed research questions, the study followed an abductive, cross-sectional research design. Empirical, qualitative data was collected through a combination of document studies and interviews with an automotive Original Equipment Manufacturer (OEM) and several third-party visibility vendors. The analysis of the collected data resulted in an outline describing ten information fields representing the information demands within a connected end-to-end supply chain, how IoT-technologies can be used to satisfy these demands and the general impact of increased visibility on the supply chain performance. To further ease the implementation decisions of IoT solutions for manufacturing OEM’s, additional research regarding the implementation process of an IoT system is needed.
Keywords
Acknowledgments
We would like to show our gratitude to all those who supported and motivated us during this master thesis.
First of all, we would like to thank Nina Edh Mirzaei who supervised and reviewed our work, contributing with helpful suggestions and constructive criticism.
Further, we want to thank Alexander for supervision and provision of detailed information from the company’s side, as well as the colleagues and their support during the research. Likewise, we want to thank all participants in the interviews for their willingness to provide information and their interesting contributions, answers and insights.
Finally, we would like to thank our families, who made our studies possible and same as our friends provided strong emotional support throughout the entire studies.
Contents
1
Introduction ... 1
1.1 BACKGROUND ... 1 1.2 PROBLEM DESCRIPTION ... 2 1.3 PURPOSE ... 3 1.4 DELIMITATIONS ... 3 1.5 OUTLINE ... 32
Theoretical background ... 4
2.1 SUPPLY CHAIN NETWORK ... 4
2.2 SUPPLY CHAIN PERFORMANCE AND UNCERTAINTY FACTORS ... 6
2.3 SUPPLY CHAIN VISIBILITY AND CONNECTIVITY ... 7
2.4 LOGISTICS 4.0 ... 8
2.4.1 Cyber-Physical Systems ... 9
2.4.2 Internet of things ... 10
2.5 IOTTECHNOLOGIES ... 10
2.5.1 Global positioning system ... 10
2.5.2 Automatic identification system ... 11
2.5.3 Vehicle telematics ... 11 2.5.4 Radio-frequency identification ... 12 2.5.5 Smart sensors ... 12 2.5.6 Camera-based systems ... 12 2.5.7 Smartphone ... 13 2.6 RESEARCH QUESTIONS ... 14
3
Method ... 15
3.1 RESEARCH DESIGN ... 15 3.2 CASE SELECTION ... 163.2.1 Case company selection ... 16
3.3 DATA COLLECTION ... 17 3.3.1 Document study ... 17 3.3.2 Interviews ... 19 3.4 DATA ANALYSIS ... 20 3.5 RESEARCH QUALITY ... 22 3.5.1 Ethics ... 22
4
Findings ... 24
4.1 THE CASE COMPANY’S SUPPLY CHAIN ... 24
4.1.1 Material flows ... 24
4.1.2 Information flows ... 25
4.1.3 Stakeholders ... 27
4.2 VISIBILITY PILOT PROJECTS AT THE CASE COMPANY ... 28
4.2.1 Dealer notification accuracy through IoT-solutions ... 28
4.2.2 Real time tracking using GPS ... 28
4.2.3 Yard management using IoT-technology ... 29
4.3 SUPPLY CHAIN VISIBILITY SOLUTIONS ... 29
4.3.1 Different approaches - different definitions ... 29
4.3.2 Technologies, information outcomes and data ... 30
4.3.2.1 Benefits ... 32
4.4 THE CASE COMPANY’S VISIBILITY DEMAND ... 32
5
Analysis ... 34
5.1 WHAT IS THE INFORMATION DEMAND OF THE STAKEHOLDERS WITHIN A CONNECTED SUPPLY CHAIN NETWORK? ... 34
5.1.1 Supply chain frame and stakeholders ... 35
5.1.2 Basic information demand ... 35
5.1.3 Information from the supply chain for the supply chain ... 36
5.2 WHAT ROLE DO INTERNET OF THINGS TECHNOLOGIES HAVE IN ENABLING SUPPLY CHAIN VISIBILITY AND CONNECTIVITY? ... 38
5.2.1 IoT data collection technologies ... 39
5.3 HOW DO SUPPLY CHAIN VISIBILITY AND CONNECTIVITY IMPACT THE SUPPLY
CHAIN PERFORMANCE? ... 41
5.3.1 Planning performance ... 42
5.3.2 Sourcing and distribution performance ... 42
5.3.3 Production performance ... 43 5.3.4 Customer satisfaction ... 43
6
Discussion ... 44
7
Conclusions ... 46
References ... 47
Appendices ... 52
APPENDIX 1:INTERVIEWEES FOR CURRENT IOT APPLICATIONS PROJECTS ... 52
APPENDIX 2:INTERVIEWEES FOR INFORMATION DEMAND CONFIRMATION ... 52
List of figures
Figure 1: Elements in the supply shain network based on Chopra & Meindl (2016) .... 5
Figure 2: Key performance metrics in supply chain based on Gunasekaran et al. (2001) ... 6
Figure 3: Purpose overview and research questions ... 14
Figure 4: Research timeline based on abduction ... 16
Figure 5: Physical supply chain flow ... 24
Figure 6: Information and material flows in the supply chain ... 25
Figure 7: Analysis roadmap ... 34
Figure 8: Research outcomes in relation to the purpose and research questions ... 44
List of tables
Table 1: Supply chain uncertainty factors based on Rodrigues et al. (2008) ... 7Table 2: 5-level CPS structure adapted from Wang & Wang (2016) ... 9
Table 3: Parameters measured by on-board monitoring systems based on Baumgartner et al. (2008) ... 11
Table 4: Documents studied at the case company ... 18
Table 5: Data collection matrix layout ... 21
Table 6: Matrix connecting information outcomes, data and technologies ... 31
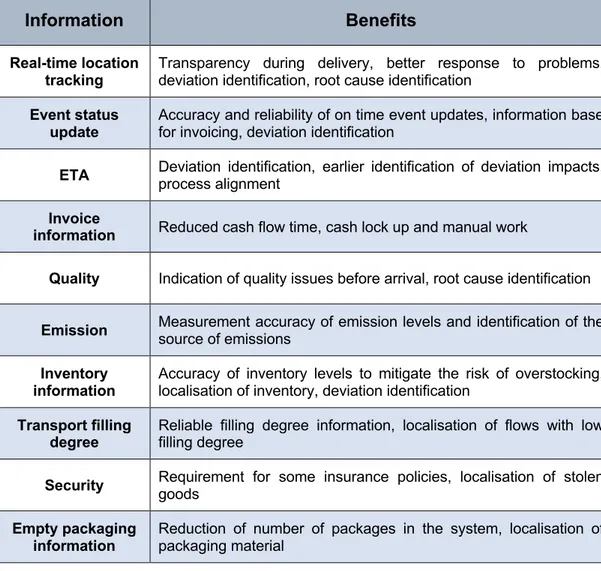
Table 7: Information outcome visibility benefits ... 32
1
1
Introduction
This master thesis is conducted in the field of supply chain in relation to Internet of things (IoT). In symbiosis with the fourth industrial revolution new technologies and business opportunities evolve, enabling previously unknown performance improvement possibilities within the manufacturing industry and its supply chain. Therefore, this thesis will investigate the various potentials of IoT and how new technologies and a next level of connectivity and visibility can benefit the supply chain. In this chapter a short introduction will be followed by the identification of the current lack of knowledge in this area. From that, the purpose of this thesis will be formulated, clearly framed by delimitations. The end of the chapter will give an outline over the content and proceedings of this thesis.
1.1 Background
In the past, some big technological changes have led to what was afterwards called industrial revolutions. Today, the next revolutionary change is already perceived during its development (Schwab, 2016). With the beginning of the 21st century we are
witnessing the fourth industrial revolution named Industry 4.0, whereby a new level of intelligent networks arises from innovative information and communication technologies (Barreto et al., 2017). The term “Industry 4.0” has its origins in Germany, where a working group of academics and industry professionals aimed to understand the future of Germany’s industry with the goal to define the investments in research and development that would occur, in order to take a dominant and leading role in the manufacturing industry (Almada-Lobo, 2015).
The main actor within Industry 4.0 is the Internet of Things (IoT) enhancing the level of connectedness and development of Cyber Physical Systems (CPS) (Kagermann et al., 2013). A close connection of the terms Industry 4.0 and Internet of Things can be found in academic as well as in practical publications (Hermann et al., 2016) while in some cases the words are even used interchangeably (Jeschke et al., 2017). IoT is already used in different areas such as manufacturing, healthcare, building automation, transportation, and environmental monitoring (Caro & Sadr, 2019).
During the last decade, the need for the manufacturing industry has grown to become more efficient in order to stay competitive due to increasing globalization, servitization, customization and environmentalism (Straube & Durach, 2017). These new demands have caused the development of new technologies whereby new business opportunities arise simultaneously. The area of logistics and supply chain is one of the essential components within this evolution with a need and possibility to develop and optimize to meet those demands (Barreto et al., 2017; Straube & Durach, 2017; Gunasekaran et al., 2001). An optimization based on a higher automation degree of inbound and outbound logistics can be achieved by providing and sharing relevant information through IoT systems, forming a new level of connected logistics network named “Logistics 4.0” (Barreto et al., 2017).
2 This move towards a connected and smart supply chain network opens up new possibilities by integrating processes and systems across various sectors and technologies enabling cross-sectional transparency and visibility for all stakeholders involved such as suppliers, transport providers, manufacturers and customers (Barreto et al., 2017; Schrauf & Berttram, 2015; DHL, 2015).
The cross-sectional transparency can then increase operational efficiency, safety and security as well as customer experience (DHL, 2015; Gilchrist, 2016) by reacting and even anticipating disruptions in the supply chain through the analysis of a fully digitally modelled network (Schrauf & Berttram, 2015). In order to display the physical system digitally, IoT technologies comprise some key technologies, e.g. sensors and networks that form a system greater than its components (Gilchrist, 2016). These then allow the usage of innovative systems such as integrated planning and execution systems, logistics visibility, autonomous logistics, and smart warehousing (Schrauf & Berttram, 2015).
1.2 Problem description
The development of industry 4.0 and IoT has created disruptions for companies and requires rethinking of the supply chain design (Alicke et al., 2016). Today’s supply chains are a series of discrete, isolated steps, and in order to become more efficient and transparent all the stakeholders need to be integrated and connected (Schrauf & Berttram, 2015). Examples of solutions that connect different parts of the supply chain can be found in literature. However, in the academic literature, research mainly focuses on identifying the impact of specific new digital technologies such as Radio-frequency identification (RFID) (Lin et al., 2015) or estimated time of arrival (ETA)-prediction (Poschmann et al., 2019) on the supply chain performance (Calatayud et al., 2019). From these studies, specific approaches were investigated but there is a lack of research that studies the possible effects of connectivity and visibility on an end-to-end supply chain network from a holistic point of view.
A number of different technologies has appeared that are changing the traditional way of working by utilizing emerging digital supply chain business models and transform into using a digital supply chain (Alicke et al., 2016). IoT promises benefits across the entire logistics value chain through connectivity (DHL, 2015). However, IoT is still in its initial stages in the manufacturing industry. Despite being available for the last 15 years, industrial leaders have hesitated to commit (Gilchrist, 2016). The hesitance is a result of uncertainty about how it would affect industries, value chains, workforces, business models, productivity and products (Gilchrist, 2016). The lack of research mentioned above makes it difficult for a manufacturing company to understand what technologies or combination of technologies is most suitable for creating visibility through IoT applications and thereby increasing supply chain performance.
A large industrial area affected by competitive challenges is the automotive industry (Haag & Vroom, 1996). The automotive industry is currently facing challenges in terms of diverging markets, shifting industry landscape, digital demands, complexity and cost pressure (Mohr et al., 2013) Due to the competitive environment and complexity within
3 the automotive industry the application of IoT has the greatest potential in that environment (Manyika et al., 2015).
1.3 Purpose
In order to address the above-mentioned challenges, the purpose of this thesis is to investigate the role Internet of Things has in enabling supply chain visibility and connectivity throughout an automotive manufacturer’s end-to-end supply chain network in order to understand the effect of supply chain digitalisation on supply chain performance in such contexts.
1.4 Delimitations
Vertically, the analysis of the end-to-end supply chain was limited to a holistic system level because a too detailed level would limit the possibility to generalise the findings. On a horizontal scale, this report covers the supply chain from first-tier supplier to customer. This delimitation is based upon the ownership and control of an automotive original equipment manufacturer (OEM). The theoretical areas include supply chain design and management at a system level and internet of things applications in a supply chain context.
1.5 Outline
In a first place, the introduced topics will be elaborated more in detail, presenting a stable baseline with theories of recent research. Based on that, at the end of this theory chapter, the defined research questions are breaking down the purpose into three sections. The following chapter describes the chosen design for the research approach in general as well as for data collection and analysis. The collected data is presented in chapter 4 and then analysed in relation to the theoretical background in chapter 5 based on the research questions. Finally, the results are discussed and concluded.
4
2
Theoretical background
The following chapter provides necessary background knowledge to understand the different areas of the purpose and presents the base for further analysis. The research aiming to understand the impact of new technologies on supply chain performance within the automotive manufacturing industry requires a clear picture and description of the supply chain setup as well as of its performance in this specific industry context. As the performance change is supposedly enabled through visibility and connectivity, comprehensive definitions of these phenomena will follow. Those phenomena emerging from the fourth industrial evolution creates a new generation of logistic systems explained in a next step. The last missing part comprises the enabling technologies under the main term of Internet of Things. At the end, the defined research questions are breaking down the purpose into three areas, setting the base for targeted data collection and a frame for a structured analysis.
2.1 Supply chain network
For the term supply chain, many definitions can be found including different views on its stakeholders. Stakeholders can be a person, group or organization that affects or is affected by an organization's actions, objectives or policies (Yee & Oh, 2013). Supply chain definitions all include the idea of various actors involved in a process of sourcing material, transforming it into finished goods and delivering it to a customer (Muckstadt et al., 2001; Zijm et al., 2019; Chopra & Meindl, 2016). More precisely a supply chain constitutes all operations required for the transformation of raw materials into finished products, including material sourcing, handling and storing, component manufacturing, product distribution as well as information interchanges. The different companies and organizations operating concatenated, form a supply chain network also named end-to-end supply chain (Zijm et al., 2019).
The supply chain typically consists of five main elements or stages that are important for transforming raw materials into finished products (Muckstadt et al., 2001; Chopra & Meindl, 2016):
• Raw Material Supply • Manufacturing • Distribution • Retail • Customer
Along these stages every one of them is connected via flows of material or products, information and funds within the supply chain network (Chopra & Meindl, 2016). The physical flows within the supply chain are directed from supplier to customer whereas information are flowing in both directions. The representation in Figure 1 clearly shows the connections between the five stages consisting of physical and information flows, forming the supply chain network.
5 Figure 1: Elements in the supply shain network based on Chopra & Meindl (2016) From a holistic, organizantional point of view, the supply chain is dependent on five interconnected business systems (Muckstadt et al., 2001).
• Engineering systems perform product design and development as well as the production design processes.
• Marketing systems study and forecast current and future market demands in order to introduce the right products at the right time and price to the market. • Manufacturing systems are responsible for production planning and execution,
including capacity, scheduling and shop floor decisions.
• Logistics systems encompas the transport of material and finished goods. • Management systems have a more holistic role involving strategic planning
and control.
These business systems are influencing or even needed for the administration of the different stages of the actual supply chain flow connecting the raw material and the end-customer mentioned above.
The move towards more complex and global supply chains requires a successful management of the different links. This management of the different relationships across the supply chain, increasingly seen as a complex network instead of single chain, can be referred to as Supply Chain Management (SCM) (Lambert et al., 1998). It is driving the integration of suppliers, manufacturers, warehouses, and stores via information and communication technologies (ICT) enhancing organizational competitiveness (Gunasekaran & Ngai, 2004). Different from the current definition, at the introduction of SCM in the early 1980’s it was seen as the logistics outside of the firm and only distinctively defined by the Council of Logistics Management in 1998 (Lambert et al., 1998). Yet, logistics remain a major part of SCM (Lambert et al., 1998; Chopra & Meindl, 2016).
It can be attributed to the increasing trend in globalization and customer orientation that demand rises for a more logistics-sensitive organization (Gunasekaran et al., 2001). Logistics or logistics management is the planning, implementation and control of all inbound and outbound processes as well as internal and external handling and transport operations of material and information flows (Zijm et al., 2019; Lambert et al., 1998). These information and material flows are shown as arrows in Figure 1.
6
2.2 Supply chain performance and uncertainty factors
As mentioned in chapter 1, the need for manufacturing industry has grown to become more efficient within the organization in order to stay competitive (Straube & Durach, 2017). The increasing rate of changing markets and technological and competitive forces requires a shift increasing the organizational effectiveness, whereas a key strategic factor is supply chain management to evaluate the performance (Gunasekaran et al., 2001).
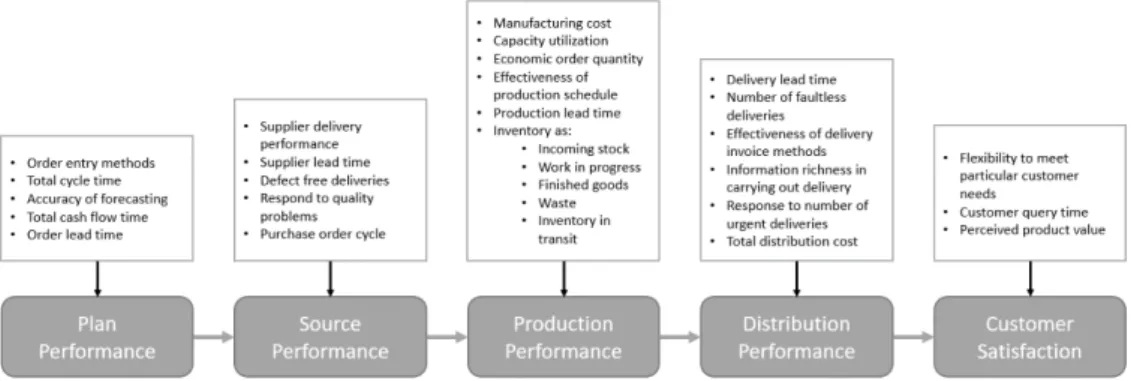
Performance measurement can be defined as the process of quantifying the efficiency and effectiveness of action and the metrics used for that process (Neely et al., 1995). Whitten et al. (2012) define supply chain performance as “the ability of the supply chain to deliver quality products and services in precise quantities and at precise times; and to minimize total cost of the products and services to the ultimate customers” (p. 32). The factors quality, quantity and time refer to the definition of effectiveness while the goal to minimize cost or resources in general is equal to becoming more efficient. Lee and Billigton (1992) explain that for effective performance measurement, supply chain metrics and customer satisfaction must be aligned. On this foundation Gunasekaran et al. (2001) present five categories of key performance metrics in a logistic and supply chain environment: plan, source, production and delivery performance, as well as customer satisfaction. These interconnected performance categories each influencing their successor, are presented in figure 3 together with their metrics.
Figure 2: Key performance metrics in supply chain based on Gunasekaran et al. (2001)
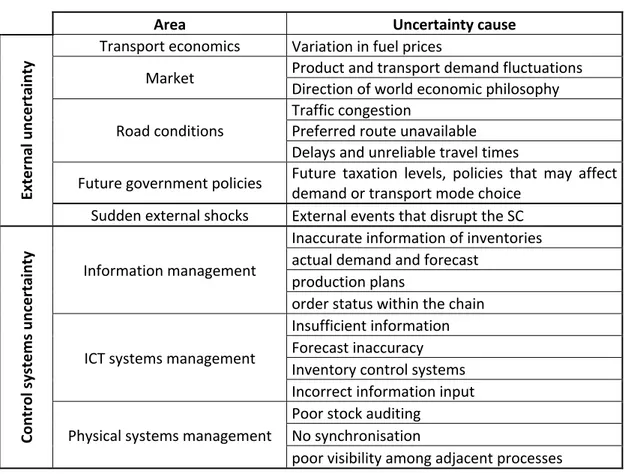
Supply chain uncertainty is a main factor preventing delivery performance. Supply chain uncertainty refers to situations where unclear objectives, lack of information about the environment or unclear impacts of possible control actions lead to uncertainty in decision making (van der Vorst & Beulens, 2002). Uncertainties can occur either from external causes such as traffic congestions leading to delivery delays or from inaccurate information in control systems e.g. regarding inventory levels (Rodrigues et al., 2008). As compensation, manufacturing companies tend to either track variations, leading to increased transport cost or increase the safety stocks in an attempt to reduce
7 the impact of deviations and thereby increasing tied-up capital and obsolete costs (Rodrigues et al., 2008). Several uncertainty factors have been identified and are presented in Table 1.
Table 1: Supply chain uncertainty factors based on Rodrigues et al. (2008)
Area Uncertainty cause
Ex te rnal unc er tai nt
y Transport economics Variation in fuel prices
Market Product and transport demand fluctuations
Direction of world economic philosophy Road conditions
Traffic congestion
Preferred route unavailable Delays and unreliable travel times
Future government policies Future taxation levels, policies that may affect demand or transport mode choice
Sudden external shocks External events that disrupt the SC
Cont rol sy stem s unc er tai nt y Information management
Inaccurate information of inventories actual demand and forecast
production plans
order status within the chain ICT systems management
Insufficient information Forecast inaccuracy Inventory control systems Incorrect information input Physical systems management
Poor stock auditing No synchronisation
poor visibility among adjacent processes
2.3 Supply chain visibility and connectivity
Supply chain visibility refers to the extent to which supply chain actors share or have access to information that is accurate, on-time, complete and useful, throughout the entire supply chain (Calatayud et al., 2019; Bratt & Oke, 2007; Williams et al., 2013; Somapa et al., 2018). The main purpose of supply chain visibility is to support the decision-making process and improve the supply chain performance (Caridi et al., 2014). Improved visibility regarding customer demand and inventory levels enhances the accuracy of demand forecasts, accelerates the change of production plans, improves delivery performance and reduces the inventory levels throughout the supply chain (Somapa et al., 2018). End-to-end supply chain visibility enables the partners within the supply chain network to increase the market responsiveness and mitigates the risk of disruptions in the supply chain flow of material and products (Somapa et al., 2018). Greater supply chain visibility leads to improved supply chain integration (Calatayud et al., 2019). Supply chain integration refers to the coordination of operational, logistical and planning data, production planning, inventory management and distribution (Calatayud et al., 2019). It is important to note that by simply collecting supply chain information that is accurate, complete and useful, it does not directly
8 increase the performance or influence an organization’s responsiveness to changes (Williams et al., 2013). However, with a higher degree of internal integration, there is a positive relationship between supply chain visibility and responsiveness (Williams et al., 2013).
Supply chain connectivity refers to collaborative connection of partners and the ability of gathering and sharing information throughout the supply chain using ICTs (Fawcett et al., 2011; Brandon-Jones et al., 2014; Calatayud et al., 2019). Supply chain connectivity allows information sharing within the supply chain and is a prerequisite for a successful development of supply chain visibility (Brandon-Jones et al., 2014). Technological development has enabled organizations to create external linkages for sharing information throughout the supply chain in order to gain increased visibility of their customers and suppliers’ activities and operations (Bratt & Oke, 2007). Developing effective external linkages is crucial for supply chain visibility, decision making and supply chain performance (Bratt & Oke, 2007). Supply chain connectivity is an enabler for supply chain visibility by removing technological barriers between the supply chain partners and allow a more effective management of supply chain operations (Calatayud et al., 2019).
Each part of the supply chain network contains a set of information which may be shared with others in the network using ICTs (Caridi et al., 2014; Somapa et al., 2018). Through a common collaborative platform this information can be shared amongst the supply chain partners in real time (Calatayud et al., 2019). By using machine-readable identification and data capturing technologies information can be captured automatically, enabling tracking of products during shipment and determine the status of inventory (Somapa et al., 2018).
Increased information sharing and connectivity enhances the supply chain visibility enabling continuous adjustments which reduce replenish lead times, batch sizes, inventory levels and improve demand forecasting (Calatayud et al., 2019). Even though technologies may provide a platform for supply chain visibility, it does not mean that the information sharing is guaranteed, as the utility of supply chain connectivity is dependent on the shared information’s nature and quality (Brandon-Jones et al., 2014; Fawcett et al., 2011).
2.4 Logistics 4.0
Logistics 4.0 is the term used for the application of Industry 4.0 in the area of logistics and supply chains (Glistau, 2018). Logistics 4.0 can be summarized as optimization of both outbound and inbound logistics using intelligent software which is embedded in software and databases where information is provided and shared through Internet of things systems in order to reach a higher degree of automation (Barreto et al., 2017). Logistics 4.0 is the use of bar codes, RFID technology, sensors, GPS systems and other advanced networking technologies through network communication technology and information processing platforms creating Cyber-physical systems (CPS) (Wang, 2016). This development in digital technologies has led to supply chains that are more
9 customer oriented, individualized, collaborative, efficient and responsive (Strandhagen et al., 2017).
Wang, (2016) describes that with Logistics 4.0 it is possible to analyse the supply chain and make predictions with real time information which makes it possible to more precisely synchronize events and interactions. With Logistics 4.0 it is possible to take immediate actions if materials have been mishandled or shipments are delayed based upon information gathered by sensors. With a greater insight and the ability to respond in real time, it is possible to optimize the logistics network, decrease cost and increase performance, reliability and customer satisfaction.
2.4.1 Cyber-Physical Systems
Cyber-Physical System (CPS) is a term that describes a broad range of complex, multi-disciplinary, physically aware system that integrates embedded computing technologies into the physical world (Gunes et al., 2014). The term cyber refers to the communication, computation and control that are discrete and logical. The term physical instead refers to natural and human-made systems controlled by the laws of physics and is operated in continuous time (Wang & Wang, 2016). A CPS generally involves two central functional components: 1. the advanced connectivity that enables both the real time data gathering from the physical world and the informational feedback from the cyber space; 2. the intelligent data management, computational and analytic capabilities that constructs the cyber space (Wang & Wang, 2016). Wireless sensor networks are an essential component of CPS as it enables the collection of data to be transferred to the cyber space (Wang & Wang, 2016).
Wang and Wang, (2016) proposes a 5-level CPS structure which defines the construction of a CPS from the initial data gathering to the final value creation. This structure is outlined in Table 2.
Table 2: 5-level CPS structure adapted from Wang & Wang (2016)
Levels Descriptions
Smart Connection Acquiring accurate and reliable data.
Conversion Meaningful information has to be gathered from the data.
Cyber This level acts as a central information hub, specific analytics has to be conducted to extract additional information in order to provide a better insight.
Cognition This level generates a thorough knowledge of the monitored system, it provides a proper presentation of the acquired knowledge to expert users in order to support decision making.
Configuration This level is the feedback from the cyber system to the physical system, it acts as a supervisory control to make it possible for the system to self-configure and self-adopt. This level acts as a resilience control system to apply corrective and preventive decisions.
10 2.4.2 Internet of things
The term Internet of Things (IoT) was first introduced by Kevin Ashton in (1999). Since it gained popularity, it was associated with different definitions. In an article from 2009 Ashton defined it as connected computers that know everything by gathering data without human interaction (Ashton, 2009). Common about definitions of IoT is the idea of connectedness (Barreto et al., 2017; Ashton, 2009; Jeschke et al., 2017; Caro & Sadr, 2019). It can be seen as a technological innovation, connecting a network of objects and devices such as sensors that can be remotely accessed, collecting and communicating data with the goal to identify, locate, sense and control via global internet connections (Caro & Sadr, 2019; Tharaka et al., 2018).
The term Cyber-Physical Systems (CPS) is often presented with a similar or sometimes even identical definition. Barreto et al. (2017) state a close connection and influence of IoT on CPS, facilitating the integration of processes and systems into a new intelligent system. Jeschke et al. (2017) even go a step furhter, saying “the terms are in fact mostly interchangeable as long as we discuss their technological basis” (p.8). In the sense of this thesis, Internet of Things is understood as the umbrella term of technologies forming the basis for the connectedness of a Cyber-Physical System.
In some cases, the more specific term “Industrial Internet of Things” (IIoT) can be found to describe the application of IoT in industry (Almada-Lobo, 2015), while in other cases and also this report IoT is used in the same context as IIoT and no differentiation is made (Jeschke et al., 2017; Barreto et al., 2017).
2.5 IoT Technologies
IoT technologies are used in various areas along the development of Industry 4.0. Following, these technologies and their abilities are presented. Later on, this knowledge is required to understand the value they provide in a supply chain visibility and connectivity context.
2.5.1 Global positioning system
Global Positioning System (GPS) is one of the technologies currently employed by organisations for tracking vehicles, trucks, trains and ships in real time (He et al., 2009). Advantages of using GPS technology for tracking are: a more transparent transport chain, increased delivery performance through faster problem identification, bottleneck identification, more reliable data for planners, faster reaction times in case of delays and increased customer satisfaction (Kadel et al., 2011). However, when the GPS receivers are indoors, they can no longer communicate well with satellites to provide accurate location information (He et al., 2009). By connecting GPS-mapping systems to enterprise resource planning systems, it could facilitate inbound and outbound logistics scheduling (He et al., 2009). Utilizing this would result in seamless visibility, increased reliability of loading decision making, increased transport capacity, optimization of transports in urban areas, automatic exception reports, dynamic goods routing and on-line shipment decision support (He et al., 2009). Besides GPS-tracking systems there are also other solutions employed by organisations in order to track
11 shipments in real time within the supply chain network yielding similar benefits, such as, Telematics (Lee et al., 2018) and Automatic Identification System (AIS) (Urciuoli, 2018).
2.5.2 Automatic identification system
The maritime sector uses Automatic Identification System (AIS) to gather information about vessels. AIS automatically provides information about a ship’s identity, type, position, course, speed and navigational status (Le Tixerant et al., 2018). This information can then be used to enable improved tracking within the supply chain and to predict ETAs of shipments (Urciuoli, 2018). The information gathered from the AIS is also increasingly used to track environmental impacts (Le Tixerant et al., 2018). Since 2002 the International Maritime Organization (IMO) has made it obligatory for ships to be equipped with AIS (Le Tixerant et al., 2018).
2.5.3 Vehicle telematics
The application of ICTs in the field of transport can also be referred to as (advanced) transport telematics including various telecommunication and information technologies in road, rail, sea and air transport solutions (Giannopoulos, 2004). Even though the term encompasses all transport solutions it is mainly used to describe technologies in the road transport area often known as vehicle telematics.
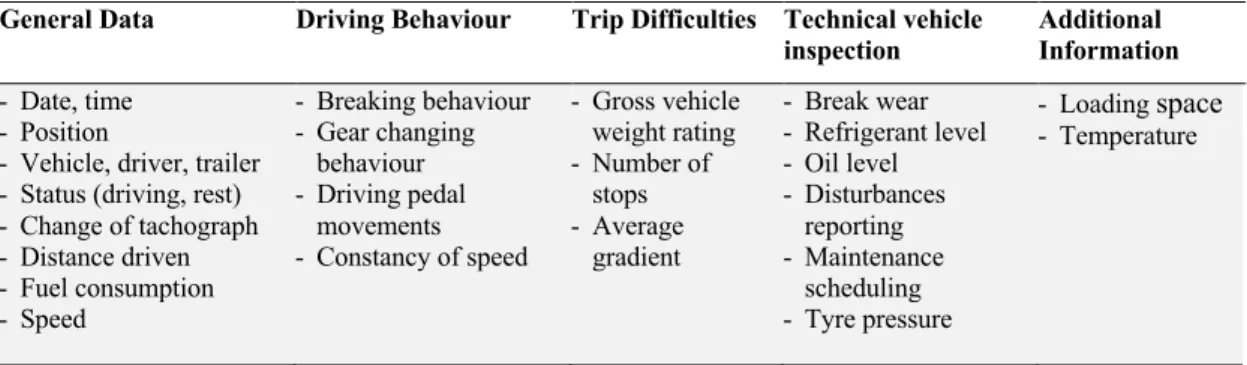
For vehicle telematic systems, the most basic function is the positioning and data communication function, enabling the tracking and tracing of routes taken by the drivers as well as transmitting information such as order information, digital delivery notes or status information (Baumgartner et al., 2008). The second main part of vehicle telematic systems is the on-board monitoring systems collecting data of the vehicle. An overview of the measured parameters is provided in Table 3.
The increased use of vehicle telematics by the logistic providers ensures a more efficient fleet management considering vehicle maintenance, vehicle diagnostics, driver management, fuel management, health and safety management and dynamic vehicle scheduling through real time shared information (Lee et al., 2018). One important effect thereby is the reduced environmental impact (Baumgartner et al., 2008). Also, the improvement of ETA prediction in road transport networks benefits from the use of this real time data (Urciuoli, 2018).
Table 3: Parameters measured by on-board monitoring systems based on Baumgartner et al. (2008)
General Data Driving Behaviour Trip Difficulties Technical vehicle inspection
Additional Information - Date, time
- Position
- Vehicle, driver, trailer - Status (driving, rest) - Change of tachograph - Distance driven - Fuel consumption - Speed - Breaking behaviour - Gear changing behaviour - Driving pedal movements - Constancy of speed - Gross vehicle weight rating - Number of stops - Average gradient - Break wear - Refrigerant level - Oil level - Disturbances reporting - Maintenance scheduling - Tyre pressure - Loading space - Temperature
12 2.5.4 Radio-frequency identification
Radio-frequency identification (RFID) is a wireless communication technology that can read and write information by using radio signals without needing mechanical or optical contact (Yan et al., 2018). RFID consists of three elements: a tag formed by a chip which is connected via an antenna; a reader that sends out radio signals and receives data and information in return from the tags, and a middleware that connects the RFID hardware to enterprise applications (Sarac et al., 2010). The RFID technology can provide a cost-efficient system for identifying goods and connect objects and equipment to databases and networks (Yan et al., 2018). The information that becomes available through the application of RFID technologies is crucial for improving supply chain operations through increased supply chain visibility and integration between participants in the supply chain (Calatayud et al., 2019). A survey by Sarac et al. (2010) showed that RFID can provide several advantages in supply chain management such as: Improvement of traceability and visibility, increased efficiency, improved information accuracy, reduced inventory losses and real-time information. Generally, RFID is utilized in supply chains to automate the tracking of products, cases, pallets and reusable assets such as racks, bins and containers (Yan et al., 2018). However, one major drawback of RFID technology is that as soon as the tracked goods leave the warehouse or plant, the tracking of the goods is interrupted until it arrives at the next stop in the supply chain and is reconnected (He et al., 2009).
2.5.5 Smart sensors
Smart sensors, such as temperature, impact and humidity sensors, are used to detect changes in the environment and the condition of goods (Wang, 2016). Together with IoT, this information can be shared among the supply chain partners to ensure that the temperature, humidity and quality condition of products and materials have been unchanged while being transported through the supply chain (Calatayud et al., 2019). 2.5.6 Camera-based systems
Data collection through camera-based systems provides useful complementary information to existing data collection methods (Lewin et al., 2017). Through image processing algorithms it is possible to realize several functions, ranging from sheer detection of goods to sophisticated control based on camera-based impulses (Alias et al., 2016). This detection and tracking of objects is carried out with the help of four characteristics; Colour, edges, motion and texture (Alias et al., 2016).
Camera-based systems have several application areas, such as monitoring storage areas, counting objects entering the field of view of the camera, locating objects, tracking the path of packages, and monitor the occupancy status of load handling units (Alias et al., 2016). The common goal to all application areas of visual components is increased transparency which often is accompanied by efficiency gains (Kalkan et al., 2013). Through the camera-based system, information can be extracted continuously to
13 provide real-time status monitoring and enable real-time inventory management (Kalkan et al., 2013).
2.5.7 Smartphone
The increasing popularity of smartphones with its built-in communication and processing features are showing increasing interest in research (Alfian et al., 2017). Researchers have shown an increasing interest in building smart IoT solutions using smartphones because of their embedded sensors, such as digital compasses, accelerometers, gyroscopes, and GPS-systems (Alfian et al., 2017). From these sensors, features such as smartphone dependent Quick Response (QR)-code reading, real-time GPS tracking, automated response alerts and multilevel data access control can be provided (Egharevba et al., 2019).
Smartphone-based sensors are enabling new applications in a variety of different areas (Alfian et al., 2017). Recently, opportunities for enhancing visibility within logistic companies, logistic providers, shippers and carriers have emerged (Cherrett et al., 2015). Fleet management systems have been using rugged hand-held terminals for several years which acts as the core communication platform in many large carrier operations (Cherrett et al., 2015). Smartphones are now mirroring the functionality of these devices and are becoming a viable alternative as data collection devices in the logistics field (Cherrett et al., 2015).
14
2.6 Research questions
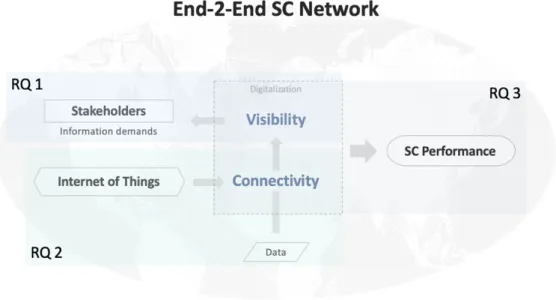
Supply chain connectivity and visibility are in the centre of this research, with potential to improve the performance as shown in the visualization of the purpose in Figure 3. First of all, it is essential to understand which parts of the supply chain need to be connected and what information needs to become visible. In a next step the enabling IoT technologies will be analysed, explaining the connection between stakeholders and visibility of required information. Finally, the resulting impact on the performance of the supply chain can be deduced. The following defined research questions help to follow this proceeding.
RQ1: What are the information demands of stakeholders within a connected supply chain network?
RQ2: How do Internet of Things technologies enable supply chain visibility and connectivity?
RQ3: How do supply chain visibility and connectivity impact the supply chain performance?
15
3
Method
This chapter describes the methodological approach of the study including the decisions taken regarding research design and motivations these decisions are based on. Further, the processes and methods for the data collection and data analysis are described along with aspects regarding quality and ethics.
3.1 Research Design
The title and purpose of the thesis are showing the virgin stage of the topic leading to a research design open to many directions. Common understandings as well as specific definitions are not yet defined. Therefore, the research was of an exploratory nature with the goal to seek new insights and view the topic in a new light (Saunders et al., 2016). The phenomenon of interest, described by Rappaport (1987) as “what we want our research to understand, predict, explain, or describe” (p.129) was the supply chain connectivity, as it is the enabler for visibility. Bryman & Bell (2011) argue that it is hardly possible to differentiate between a multiple case study and a cross-sectional research design. Yet, based on the phenomenon of interest, Saunders et al. (2016) suggest a cross-sectional research design for this kind of study being a particular time constrained phenomenon.
To clearly pinpoint the most basic element of a scientific research project, it is beneficial to define the unit of analysis (Bryman et al., 2004), in this study being supply chain performance. The research regarding supply chain connectivity and performance takes into account the needs of stakeholders. To classify the research in a vertical scale, Bryman & Bell (2011) state the importance of defining the level of analysis within the SOGI model (societies, organizations, groups, and individuals). In this case, with a look on departments and their representative stakeholders, it was conducted on a group level. In the problem description it was explained that research already brought up specific theories. The derived purpose aims for an analysis of these theories in a broader context, otherwise said drawing conclusions from existing phenomena by putting them in a different context and assessing them from a new perspective. This is enabled by the concept of abduction defined by Kovács & Spens (2005) as follows:
“Abduction also works through interpreting or re-contextualizing individual phenomena within a contextual framework, and aims to understand something in a new way, from the perspective of a new conceptual framework.”
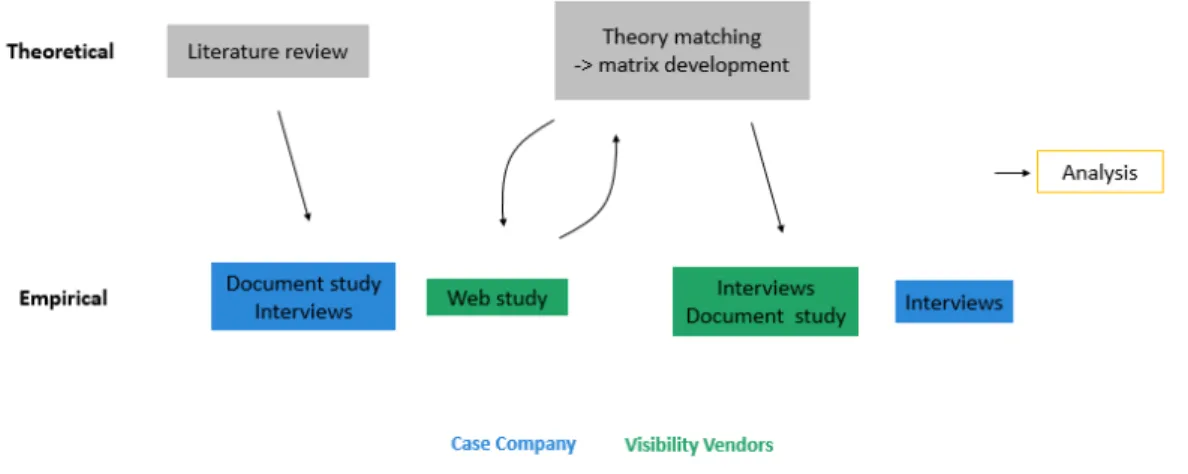
The research area suggested the choice of abductive reasoning as well. Internet of Things and Industry 4.0 are new and largely undefined areas. The move towards this shift requires an outside of the box thinking. Whereas deduction and induction are limited to relations between already known constructs, abduction allows the research to break out of these limitations with creativity and intuition (Kirkeby, 1990). The researchers thereby went back and forth between empirical observations and theory in order to expand the understanding on both sides (Dubois & Gadde, 2002). The
16 framework of the approach is depicted in Figure 4 and will be further explained in detail.
Figure 4: Research timeline based on abduction
Whereas deductive resoning is associated to a quantitative reseach approach and inductive reasoning to a qualtitative research approach (Bryman & Bell, 2011), abductive reasoning can be based on either of the two reseach approaches (Kovács & Spens, 2005). For this research a qualitative approach was chosen due to the young stage of the research area.
Based on the cross sectional research design, the chosen matching research methods, taking into consideration the qualitative research approach, are interviews and document studies (Bryman & Bell, 2011; Saunders et al., 2016). The choice of a multi-method data collection using different research multi-methods for the collection of data ensures a triangulation (Saunders et al., 2016).
3.2 Case selection
The data collection was conducted within a cross sectional research-design covering information gathered from an automotive case company as well as from external third-party visibility solution vendors.
3.2.1 Case company selection
In order to understand the information demand within a manufacturing supply chain, a case company was chosen. For the selection it was important to investigate a company that has a high degree of ownership and control of the supply chain. In the automotive industry, where the supply chain is complex and the demands of the supply chain are high, connectivity offers solutions for these challenges. Additional aspects which influenced the choice of the company were their interest of supply chain development, as companies with an interest in the topic tends to be more supportive of the research (Williamson, 2002). Therefore, a large automotive OEM with a high degree of supply chain ownership and an interest in supply chain development was chosen.
17 3.2.2 Selection of third-party visibility solution vendors
The global transportation visibility market is growing with over 100 different vendors (De Muynck, 2020). From this amount, a smaller group of third-party visibility solution vendors was chosen to be investigated in this study. This group was mainly based on two sources. Firstly, De Muynck (2020)’s Market Guide for Real-Time Transportation Visibility Platforms Report. In that report 18 vendors have been reviewed, that were the most relevant in their region, consisting of a minimum number of 20 live customers, transacting a minimum of one million shipments per year, support a sizable carrier network of minimum 1000 carriers and are actively selling their products. De Muynck (2020) states that it is not an exhaustive list or analysis of vendors and advise a further exploration of the market. Therefore, ten vendors are taken into account stated as the “Best Supply Chain Visibility Start-ups” by Transmetrics (2019), whereas three out of these ten vendors, match vendors from De Muynck’s report. The choice for the investigation of start-ups aims to find the most innovative and recent approaches (van Stel et al., 2005). In addition, three other vendors were chosen due to an existing cooperation with the case company or personal experiences. In total, 29 companies were identified. The reason for choosing multiple vendors was to get a broader picture of the available solutions and approaches.
3.3 Data collection
The purpose of this study was to investigate the role IoT has in enabling supply chain visibility and connectivity. Data was collected from both a case company and third-party solution vendors through document studies and interviews. The data from the case company was used to define the framework of the research specific supply chain, put the research in an automotive manufacturing context and get an understanding of the current level of IoT technology integration. The third-party solution vendors were chosen as they provide information about connectivity and visibility solutions for the supply chain network. Following, a general overview over the two chosen methods is given, elaborated in detail in the corresponding sub-chapters.
3.3.1 Document study
Within the multi-method data collection, the first chosen method was document study. The documents were mainly of organisational nature originating from the chosen companies. This heterogeneous group of sources is common for business and management researches due to the large number of documents available within organizations (Bryman & Bell, 2011). Organisational documents can include documents from company newsletters and brochures over external consultancy reports to company regulations (Bryman & Bell, 2011). The respective nature of each document is mentioned below.
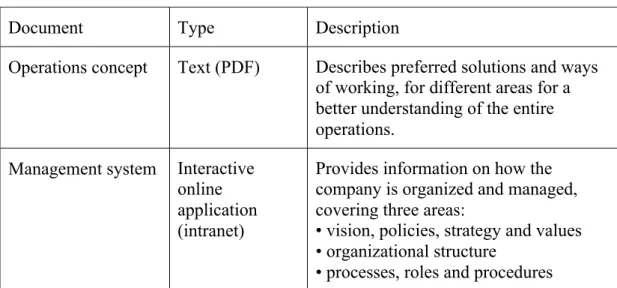
The document study at the case company encompassed two organisational documents, consisting of the company’s operations concept and management system, shown in Table 4. For these organizational documents written by employees, audience may suggest possible bias and therefore request a triangulation with other independent data
18 sources (Saunders et al., 2016). Yet, within this research the information is taken from documents that are generally agreed upon inside the company describing basic standards. Information documented by the company was used to understand the organization, standards, processes and corresponding process owners, departments and responsibilities. The company’s operation concept included vast and detailed descriptions of the end-to-end supply chain and how the company conducts its business in different areas. Each of the actions and events within the supply chain was described together with the strategies and plans. The case company’s management system added information regarding the organizational setup of information flows and processes on different hierarchy levels. This included not only the connections between processes but also a description and the corresponding process owners.
Table 4: Documents studied at the case company
A type of documents with growing importance for research due to the fast accessibility are virtual documents that appear on the internet (Bryman & Bell, 2011). For this research virtual documents were valuable while looking at new innovative companies and solution vendors. Firstly, it led to a preliminary list of companies with solutions in the area of supply chain connectivity and visibility. The information available on the individual websites was used to get a basic understanding of each solution. In the case of a large deviation to the earlier developed definition of manufacturing supply chain, the companies were no longer considered, leaving 25 vendors.
From the 25 vendors, a preliminary short website study was done, collecting information regarding data input, information outcomes and connecting technologies. This set the base for the interview questions and, together with knowledge from theory, the frame for the data collection matrix in Table 5, later explained more in detail. For some vendors that did not take part in the interviews, data was collected from extensive information available on their websites or shared information via mail. The respective methods are shown in Appendix 3: List of relevant supply chain visibility solution vendors.
Document Type Description
Operations concept Text (PDF) Describes preferred solutions and ways of working, for different areas for a better understanding of the entire operations.
Management system Interactive online application (intranet)
Provides information on how the company is organized and managed, covering three areas:
• vision, policies, strategy and values • organizational structure
19 3.3.2 Interviews
The second method for data collection in this study was interviews. For the purpose of this study, semi-structured qualitative interviews were chosen, which allowed greater flexibility whilst conducting the interviews in comparison to structured interviews (Williamson, 2002). Before conducting semi-structured interviews, a list of themes and questions to cover was formulated, varying between the different interviews (Saunders et al., 2016). For each round of interviews this list is shown below. Some questions in specific interviews can be ignored based on the organisational context encountered in the research process (Saunders et al., 2016). Other questions that is not stated beforehand can be asked if the interviewer needs further explanations (Bryman & Bell, 2011).
A first round of interviews was conducted with employees at the case company listed in Appendix 1: Interviewees for current IoT applications projects, to get an understanding regarding pilot projects aiming for implementation of IoT technologies for increased visibility. The interviewees were chosen based on recommendations from an experienced employee in the strategy development department. During the semi-structured interview, the following questions were asked:
1. What was the purpose of the pilot project?
2. What information demand was aimed to be satisfied? 3. What technologies were used to gain visibility? 4. Which type of flow of goods did it cover? 5. What was the outcome?
The second round of interviews was conducted with representatives of the visibility solution vendors. All 25 third-party solution vendors were contacted with a request for an interview. Seven participated in the interviews via video-calls. The aim was to understand the solutions and their benefits available on the market today in detail and confirm information found on their websites. After a first contact with general introduction to the topic, the list with questions developed after the document study was sent to the companies as an overview of the interview’s structure:
1. What do you understand by End-2-End Supply Chain? 2. How do you define Visibility?
3. What problems do you see in SCM? 4. What benefits does your solution provide?
5. What information outcomes does your solution provide? 6. What data do you need to gather for that?
7. What (IoT) technologies do you use? 8. What roles/stakeholders in a SC do benefit?
9. Specialties regarding automotive manufacturer SC? 10. Other questions
The first three questions were open questions triggering a discussion ensuring a common understanding of supply chain connectivity and visibility. The fourth question gave the opportunity for the company to introduce the key benefits of their product. The following three questions aimed to fill the matrix and understand the information outcomes, the associated data needed to be visualised and the relating technologies and
20 benefits. The last two questions summarize the solution, putting the answers into the manufacturing context and specific questions that occurred from the website study were included at any point.
Notes were taken during the interviews and the information was then transferred to an individual matrix. After the interviews were conducted, the individual matrices were summarized in a final matrix in chapter 4.3, providing the complete findings in a compact and structured overview. In addition to this matrix, a table was created which summarizes the main findings regarding the benefits of the different information. In the end, a last round of interviews was carried out at the case company to compare the information provided by the visibility solutions with the information demand of managing stakeholders of supply chain processes inside the case company, as a third part of the method triangulation. Therefore, the identified information were discussed step by step regarding the relevance of respective information for each process. While a binary result overview is shown in Table 8: Relevant information for supply chain processes, further insights are used for analysis and discussion. The interviewees included employees from different departments, function, geographic areas and roles and are represented in Appendix 2: Interviewees for information demand confirmation. They were chosen based on their appearance as process owners or process managers in the digital management system of the case company.
The interviews were conducted over video calls, to overcome the geographic barriers and to make sure that more participants could be included regardless their location. The interviews were not recorded, and only detailed notes were taken as the required data was simple information without considering formulations or emotions. Further it complies with the privacy ethics in the research explained in detail in 3.5.1.
3.4 Data analysis
This chapter will focus on the data analysis strategies. In accordance with the qualitative research approach and data collection methods, the analysis of the data was conducted using conceptualisation (Saunders et al., 2016). The timeline that was depicted in Figure 4, following the abductive reasoning with a back and forth between empirical observations and theory (Dubois & Gadde, 2002), will be explained now more in detail. After empirical research at the case company, setting the status quo for usage of IoT technologies in that environment, further research about companies working with these technologies to improve visibility aimed to complete the picture. As for this research, little theory about IoT technologies in the supply chain context was found, empirical data collected from supply chain visibility vendor websites was used to create a coherent understanding of the topic.
Based on grounded theory as a general strategy of qualitative data analysis, the information from supply chain visibility vendors websites was analysed following theoretical saturation and coding. With the process of theoretical saturation, it is possible to collect and code data to a point where no new value is added (Bryman & Bell, 2011). First the data was broken down into component parts following the coding process, allowing the development of categories. The ongoing data collection process
21 as a second part of theoretical saturation ensures that the preliminary defined category is well developed and saturated with data. Each of the vendors websites was different in the sense of presentation, amount of information, level of detail or wording. Yet, with the aim to find answers to the research questions, relevant information possibly identifying stakeholders, information demands, data, technologies or benefits was extracted. Successively the categories were built up, merged and rearranged in continuous discussion, leaving three types of categories covering the information demands or outcomes, the types of data in a supply chain and the technologies. These categories for information outcomes and data were then arranged in a matrix presented in Table 5 and used for the second data collection.
Table 5: Data collection matrix layout
The matrix allowed the connection of 3+1 dimensions of information. The two-dimensional layout connects the information outcomes and the corresponding data needed. In the intersection, connecting technologies represent a third dimension. In addition, notes could be added to every field, for example explaining how a certain data point would benefit to a more precise information outcome. The pre-defined rows, columns and list of technologies could be extended at any time. The individual matrices from each interview, were then summarized in one single matrix, shown in chapter 4.3.2. For a better overview, the additional table in the following chapter shows the benefits of each information outcome.
To answer the research questions, the final analysis follows the process of constant comparison. Thereby, a close connection between data and conceptualization is kept allowing the comparison of phenomena under each category and theoretical elaboration (Bryman & Bell, 2011). By combining data found in the interviews with visibility vendors and employees at the case company, the defined categories of information outcomes were put into context of the specific supply chain and compared with the actual information demand of each process. As a result, a framework concept is presented showing the application possibilities of IoT technologies in a manufacturing supply chain.
22
3.5 Research quality
Reliability, validity and replication is three of the most important criteria of research, yet there are discussions if these criteria are applicable to qualitative research (Bryman & Bell, 2011). Denzin and Lincoln (2018) proposes trustworthiness as an alternative criterion to validity and reliability for assessing qualitative research. Trustworthiness includes four criteria; credibility, transferability, dependability and conformability (Bryman & Bell, 2011; Denzin & Lincoln, 2018; Halldórsson & Aastrup, 2003). Credibility is the first criterion of trustworthiness which refers to how believable the findings are (Halldórsson & Aastrup, 2003; Bryman & Bell, 2011). Different sources of information were gathered through both interviews and document studies to create triangulation assuring the credibility of this study (Bryman & Bell, 2011). By triangulating the sources of information, it assured that the information was not gathered using a single method or source, which increases the credibility.
The second criterion of trustworthiness is transferability, which refers to the extent the study is able to make general claims about the world and describes the generalisability of research (Halldórsson & Aastrup, 2003). Generalising the findings is never truly possible because time and space will change the context and the individuals within it (Halldórsson & Aastrup, 2003). However, this does not mean that the findings acquired in one context have no relevance in another context or time frame (Bryman & Bell, 2011; Halldórsson & Aastrup, 2003). To increase the transferability of this report, the findings are explained in more general terms so that it may be applicable in other or similar contexts.
The third criterion for quality assessment of qualitative research is dependability, comparable to the conventional term reliability (Halldórsson & Aastrup, 2003; Bryman & Bell, 2011). Dependability concerns the stability of findings over time and that records are kept during all stages in the research process (Korstjens & Moser, 2018; Bryman & Bell, 2011). To ensure that the dependability criteria were met, all notes and documents from interviews and data collection were maintained throughout the research process.
The fourth and final criterion is confirmability, it concerns the objectivity of the research and that the research was conducted in good faith (Halldórsson & Aastrup, 2003). By presenting the sources which the conclusions and interpretations were based upon and demonstrating how the research has been conducted, the confirmability of the study was ensured.
3.5.1 Ethics
Research ethics refers to questions about how the research is designed and formulated, how the data is collected, stored, analysed and how it is presented in a moral and responsible way (Saunders et al., 2016). It is the researcher’s responsibility to carefully asses the ethical aspects of the research (Bryman & Bell, 2011). Diener and Grandal (1978) proposes four main areas of ethics which should be considered and assessed when conducting business research; harm to participants, lack of informed consent, invasion of privacy and involvement of deception. These ethical aspects have been
23 considered and actions have been taken in order to ensure that this study is conducted ethically.
The first area concerns the harm of the participants. Therefore, the identity of each participant was kept confidential. However, to understand the information demand of different stakeholders, the function and area of the participant was not excluded from this study. The second area of ethics concerns the lack of informed consent. To ensure the consent of the participant, each of them was informed about the purpose and nature of the study before being asked about their willingness to participate. The third area concerns the invasion of privacy, which is related to the previous area, lack of informed consent (Bryman & Bell, 2011). If the participant agrees to participate in the study and is informed and aware of the research, the participant also acknowledges that this can intrude their privacy for a limited time (Bryman & Bell, 2011). There are certain topics that can be judged sensitive to every participant which the researcher can avoid, but it is impossible for the researcher to know beforehand if there are topics that might be sensitive to a particular individual. Therefore, in this study each case is treated individually to understand what might be sensitive and invade the participants right to privacy. Besides this, the researchers chose to not record the interviews and instead took detailed notes to make sure that no sensitive information was stored. The fourth area of ethics concerns the involvement of deception. Deception refers to when researchers represented their study for something other than what it is (Bryman & Bell, 2011). To avoid deception each participant was informed about the nature and purpose of the research.
24
4
Findings
This chapter outlines the findings from the document studies and interviews. The findings are structured according to the research timeline following abductive reasoning described in 3.3 Data collection. After a presentation of the case company’s supply chain and IoT implementation projects, the capabilities of recent visibility solutions are introduced and finally matched with the case company’s information demand.
4.1 The case company’s supply chain
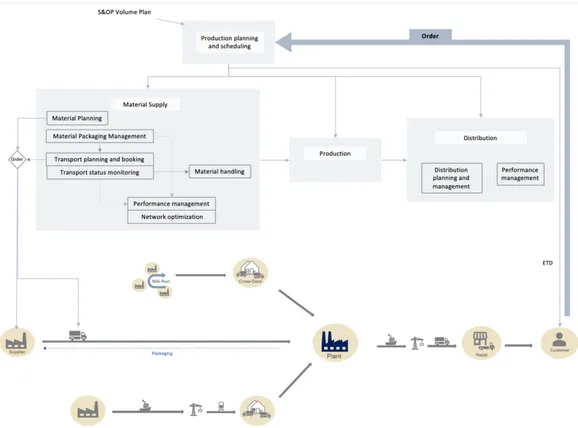
The case company’s supply chain comprises several elements in their supply chain network. These are supplier, cross dock or warehouse, plant, logistic provider, dealer and customer. They are connected via different types of material and immaterial flows. The following chapters will give an overall understanding of the supply chain network, presenting the important stakeholders and their information demands.
4.1.1 Material flows
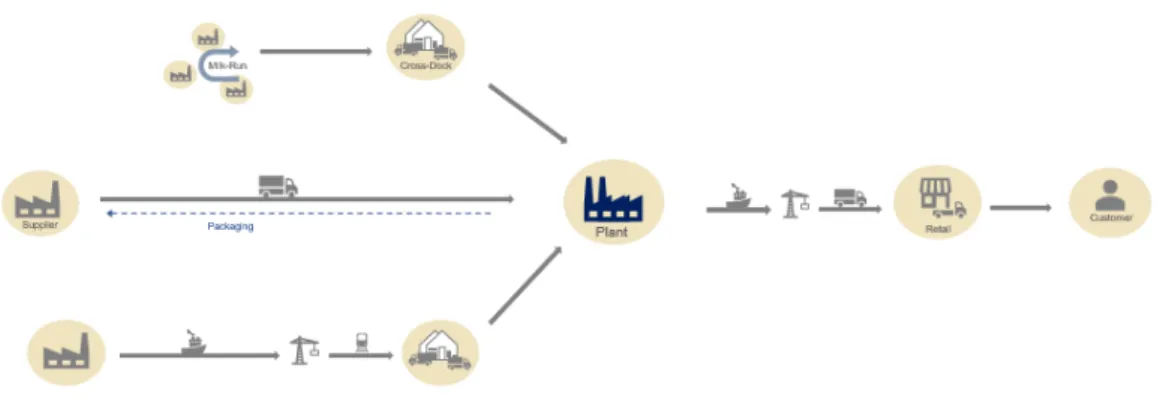
As an automotive manufacturer, the essence of the business is to produce a vehicle that is overhanded to a customer. The material and components of the finished vehicle follow several stations in the material flow, shown in Figure 5. Suppliers are the source for anything from raw material over single parts to assembled product parts. For the matter of this thesis it is only important that supplier is understood as the first-tier supplier from the ordering company’s point of view, disregarding the precise unit being sourced. This represents the inbound material flow.
Figure 5: Physical supply chain flow
The second value adding part in the supply chain is the manufacturing and assembly in the plant. Therefore, the sourced goods are either collected just from one supplier or during a milk run whereby goods are collected from several suppliers using the same truck to increase the filling rate. The following transport is done either directly to a plant or via cross-docks or warehouses. Depending on the transport distance, frequency and ways of transport, different combinations are useful. Only road transport can be executed directly from supplier to plant. Often it is beneficial to consolidate shipments in cross-docks going from several suppliers to one plant or to deconsolidate deliveries