! ! ! ! ! ! ! ! ! ! K2!WORKING!PAPERS!2017:10!
The$influence$of$demand$incentives$in$
public$transport$contracts$on$
patronage$and$costs$in$medium$sized$
Swedish$cities$
!
ROGER$PYDDOKE$ JANDERIK$SWÄRDH$ ! !$
Innehållsförteckning!
! Preface!...!4! Abstract!...!6! 1.! Introduction ... 6! 2.! Literature ... 10!2.1.! Effects of public transport fares and supply on demand and costs and car use ... 10!
2.2.! The relative efficiency of competitively tendered to negotiated performance-based contracts ... 10!
2.3.! Larger and denser cities and parking supply ... 11!
3.! Policy objectives ... 12!
4.! Data and description ... 14!
4.1.! Data ... 14!
4.2.! Description of the panel data ... 15!
4.3.! Mode shares and correlations of population size and density in 20 cities ... 16!
5.! The models ... 20! 6.! Results ... 21! 6.1.! Patronage models ... 21! 6.2.! Cost model ... 22! 7.! Conclusion ... 23! Acknowledgements ... 23! References ... 24!
Travel surveys of Swedish municipalities ... 26!
8.! Appendix ... 27!
Preface!
This study has been conducted within the framework of K2's research area Financing and Governance. Roger Pyddoke has been project manager and Jan-Erik Swärdh conducted the econometric analyses. A review seminar was carried out on the 7 June 2017 where Johanna Jussila-Hammes reviewed and commented on the report. The authors have subsequently jointly finalized the manuscript.
Of course, for all remaining deficiencies, we are responsible for ourselves.
Denna studie har genomförts inom ramen för K2:s forskningsområde Finansiering och styrning. Roger Pyddoke har varit projektledare och Jan-Erik Swärdh har genomfört de ekonometriska analyserna.
Granskningsseminarium genomfördes 6 juni 2017 där Johanna Jussila-Hammes var lektör. Författarna har därefter gemensamt genomfört slutjusteringar av manuskriptet.
För alla återstående brister ansvarar naturligtvis vi själva.
Stockholm 2017-10-04
Roger Pyddoke Projektledare
!
!
!
!
!
!
!
Abstract!
The objective to reduce carbon emissions has inspired Swedish regional public transport authorities (RPTA) to adopt a goal of doubling public transport patronage from 2006 to 2020. Several measures have been used to achieve this goal. Increasing the public transport supply and increasing the share of contract payments tied to demand incentives are among them. The purpose here is to examine the effect of demand incentives on patronage in tendered bus contracts, controlling for other factors that affect public transport patronage, with panel data for 17 medium sized Swedish cities from 1997 to 2011. In the data for a subset of 10 cities from 2000 to 2011 the number of trips increased by 36 percent, the supply of bus kilometers by 38 percent, the revenues per boarding with 49 percent and the total costs with 106 percent.
The analysis does not find any statistically significant effects of demand incentives on either patronage or costs. In the demand models, only the effect of the price variable is significant and has the expected sign. In the cost models, all control variables have the expected signs and most are significant.
Surprisingly, the estimate of the coefficient of the output variable bus kilometers is not significant. These results indicate that the combination of limited freedom for operators to influence important variables that determine demand and the demand incentives that were used during the observed period, were insufficient to give statistically significant effects.
Contrary to the assumption that appears to underlie the recommendations of a subcommittee of the Swedish Public Transport Association current demand incentives appear to be ineffective. This suggests that a revision of the recommendations for the design of public transport contracts may be called for.
Sammanfattning!
Målsättningen att minska koldioxidutsläppen har inspirerat svenska regionala kollektivtrafikmyndig-heter (RKM) att anta ett mål att fördubbla kollektivtrafikresandet från 2006 till 2020. Flera åtgärder har använts för att nå detta mål. Att öka utbudet av kollektivtrafik och att öka andelen kontraktsbetal-ningar som är knutna till efterfrågeincitament är bland dem. Syftet här är att undersöka effekten av efterfrågeincitament på antalet resande i upphandlade busskontrakt i mellanstora svenska städer, när man kontrollerar andra faktorer som påverkar resande. Analysen genomförs med paneldata från 17 svenska städer från åren 1997 till 2011. I en delmängd data för 10 av dessa städer från 2000 till 2011 ökade antalet resor med 36 procent, utbud av busskilometer med 38 procent, intäkter per
ombordstigning med 49 procent och totala kostnader med 106 procent.
Analysen finner inga statistiskt signifikanta effekter av efterfrågeincitament på vare sig resande eller kostnader. I efterfrågemodellerna är det endast effekten av pris som är statistiskt signifikant skild från noll och har det förväntade tecknet. I kostnadsmodellerna har alla kontrollvariabler de förväntade tecknen och de flesta är statistiskt signifikanta. Överraskande är att skattningen av koefficienten för busskilometervariabeln inte är statistiskt signifikant. Dessa resultat indikerar att kombinationen av begränsad frihet för operatörer att påverka viktiga variabler som påverkar efterfrågan på resor och de efterfrågeincitament som användes under den observerade perioden var otillräckliga för att ge statistiskt signifikanta effekter.
I motsats till det antagande som verkar ligga till grund för rekommendationerna från Partnersamverkan (det organ som givit rekommendationer om incitament) förefaller nuvarande efterfrågeincitament vara verkningslösa. Detta indikerar att en revision av rekommendationerna för utformningen av
1.! Introduction!
In Swedish public transport a new goal emerged in 2007 among operators and authorities. This goal was to double the number of public transport trips from 2006 to 2020 and to double market shares to 2030. In June 2015 this goal was endorsed by the Swedish parliament (2014/15:TU13).
The goal to double public transport patronage spurred efforts to find new ways to develop the contractual relationships between the regional public transport authorities (RPTA) and the operators. In dialogues on national level these parties adopted norms for contracting with the objective to drive towards increased and improved supply to attract more demand. A key to achieve these goals, it was agreed, was to introduce stronger demand incentives tied to patronage. Operators were to be paid at least 25 percent of the total remuneration per boarding passenger (Trafikanalys 2015). The remaining part is mostly in the form of a fixed payment for operating services on a timetable. In the Stockholm region contracts have been introduced in where all payments are per boarding passenger with validated ticket. This contract has been dubbed the “super-incentive contract” by Swedish observers (Danielsson et al 2016).
During the period leading up to the doubling goal different observers of public transport started to note the rapidly increasing costs in local and regional public transport. Nilsson (2011) reported that costs had increased by 50 percent in the last decade. Since 2010 costs have continued to increase by a yearly average of 5,6 percent in 2014 prices. In our dataset for 17 medium sized Swedish cities a subset of 10 cities (for which there are data from both 2000 and 2011) the costs increased by 106 percent in real terms on average from 2000 to 2011.
The objective of this paper is to estimate the effects of demand incentives, that are designed to stimulate operators to increase patronage, in contracts for public bus transport in 17 mid-sized Swedish cities, controlling for other drivers of demand. A demand incentive is here defined as a payment tied to a measurement of boarding passengers. First, an estimate of the influence of the presence of a demand incentive on the public transport patronage controlling for relevant variables is presented. Second, estimates of the effect of the demand incentive on total costs, controlling relevant variables is presented. The estimates are produced using panel data methods with data from 1997 to 2011. The yearly data includes the number of boarding passengers, the number of bus kilometers, the total cost of providing the service, of a proxy for public transport fares, population size and density, median income in the municipalities, total vehicle kilometers traveled in private cars, the total number of privately owned cars and petrol prices. As far as we know, this is one of the first papers attempting to estimate the effects of payments per boarding passenger on patronage and costs with panel data. The contracts in the studied cities are mostly gross contracts. In eight of the cities there have been demand incentives. There are frequently other incentives and fines e.g. for lack of punctuality. In most cases the terms these contracts are that the RPTA decides fares, frequencies and route network. The operator therefore, has only limited freedom to influence these variables. Some RPTAs allow for operators to suggest changes in frequencies and routes. When the possibility to change frequency and routes is limited, the demand incentive can only affect aspects such as efforts to reduce delays and cancelled departures or to stimulate the bus driver’s behavior, willingness to pick up passengers and to check the validity of tickets. With small demand incentives and small latitudes for changing supply levels or other important characteristics, effects on patronage can only be expected if there are some overlooked potential to increase patronage at low costs.
Contract theory gives some principles for optimal contracts (Nobelprize 2016). Firstly, the contract should be informed by a clear picture of both the buyer’s and the agent’s goals and preferences. Secondly, the contract should reward outcomes that can be affected by the agent. These rewards should also ideally balance the interest of giving the agent incentives with the interest of insuring the agent against unfavorable outcomes of external factors influencing the results. Thirdly, the contract should not give strong incentives for easily observable outcomes at the cost of weak or no incentives
outcomes that are harder to observe but equally important. Fourthly, the theory of incomplete contracts suggests that parties should think carefully about the rights to decide on the continued course of actions should some important preconditions for the assignment to the operator change.
In addition to these general observations some observations about public transport in Sweden can be made. The goals are reasonably clear except perhaps for the valuation of the desired outcomes. The second principle that outcomes that can be affected by the agent should be rewarded is more
questionable. It is evidently clear that many important determinants of demand cannot be influenced by the operators. Therefore, it may be questioned if this criterion is fulfilled for the demand incentives for operators. The third principle states that strong incentives should not be set for observable
outcomes if this risks a neglect of the outcomes that are hard for the buyer to observe. In the case of public transport, it is not obvious how rewarding high patronage will jeopardize other important dimensions. So long as the most common construction with gross contracts amended with demand incentives this means that buyers, in most cases, keep the option for renegotiating contracts. In the case where contracts hand over decision rights to operators such adjustments may turn out to be costly for buyers.
The stated goals for regional public transport authorities have many dimensions. Frequent components are: increased patronage and market shares, reduced CO2-emissions, continued high or increased
customer satisfaction, cost efficiency, few delays and cancelled departures, increased accessibility for disabled users, some degree of ticket revenue financing and increasing cost efficiency.
The goal to increase patronage justifies increased costs if the increased costs can be associated with net welfare gains. This paper therefore examines how increases in supply have been associated with increases in patronage and costs. The analysis recognizes that the relative attractiveness of public transport may be due to factors that lie beyond the influence of the operator. The analysis therefore controls for available variables. For other factors that are likely to influence demand and costs for public transport like the congestion in road traffic, supply of parking spaces and pricing of parking, the attractiveness of buses, the presence and magnitudes of altitude variations within the city, the
perceived risk of crime etc., data are not easily available. To the extent that these variables are have a constant component over time in individual cities this will be captured by city fixed effects.
From a theoretical point of view, it is reasonable to assume that a positive demand incentive will have a positive effect on patronage if the demand incentive is larger than the marginal costs of securing one further passenger. The hypotheses to be examined here is that the demand incentive has a positive effect on some dimension of supply and hence on demanded quantity. If the demand incentive has this effect, this is likely to come at a cost and hence have a positive effect on costs also. The critical null-hypothesis is therefore that the demand incentive has neither an effect on patronage nor on costs. The results are that the null-hypothesis cannot be rejected as no statistically significant effects on either patronage or costs are found. This result indicates that the combination of limited freedom for operators to influence important variables that determine demand and too weak demand incentives that were used during the observed period, were insufficient to give statistically observable effects. It does not however, exclude the possibility that other contract forms, perhaps with larger demand incentives, could have induced increased demanded quantity.
For this paper, empirical findings concerning the effects of different contract designs for competitively tendered bus contracts1 and demand incentives were sought. Few papers reporting on this issue were
1The literature wassearched for literature using the following strings in Google scholar •! “public transport” contract incentive
found. Hensher et al. (2016) looking for evidence on the effects of performance based contracts disappointedly report that “the transport literature is strangely silent on this issue”. Hensher et al. (2016) presents results from choice experiments for hypothetical bus contracts. There are, however, a few papers reporting statistical results on the effects of incentives using Swedish data. Jansson and Pyddoke (2010) examine the effects of quality outcomes from quality incentives in tendered public transport contracts in the Stockholm region. Trafikanalys (2015) has collected almost all public transport contracts for bus services in Sweden that were active in 2013 describing the prevalence and intensity of demand incentives. This survey finds that 52 percent of contracts did not contain any incentives at all and that only 26 percent of the contracts fulfill a recommendation that at least 25 percent of the payment should be in the form of incentive payments.
Vigren (2015) focuses on the efficiency in terms of costs per vehicle kilometer on contract level in a cross-section of 282 Swedish bus contracts from 2013. The purpose is to examine determinants of costs and efficiency. Vigren finds no significant effects of incentives on cost efficiency.
Pyddoke and Lindgren (2016) report on the bus part of one of the largest contracts in Swedish public transport. This is the E20 contract in Stockholm which is extreme as it introduced 100 percent remuneration by a payment per “boarding passenger with a valid ticket” on full scale. The study describes the outcome in terms of supply, punctuality, cancelled departures, costs and patronage comparing a period of 4 years before the previous contracts and three years with the E20 contract. In addition, two reference contracts are compared for the same period. The results are that there were some increases in supply initially in the E20 contract, but within two years the supply was almost back at pre-E20 levels. No obvious effect from the demand incentive on patronage is observed. The
variations in quality were small and costs increased less than in the comparison contracts.
In contrast to the meager literature on the effects of different incentive and contract types, there is a rich literature studying the determinants of demand for public transport. There are also many papers comparing effects of competitive tendering, performance based negotiated contracts and yardstick competition. There is finally a literature on factors influencing the use of private cars in cities, carbon emissions and energy use. The following sections will briefly treat these three literature fields. This paper is organized as follows. The second section reviews literature. The third section
summarizes the stated policy objectives of the RPTAs in some of the largest regions containing many of the cities in our sample. The fourth presents the data. The fifth presents the theory and models for the analysis. The sixth presents the results. The seventh and final concludes.
2.! Literature!
2.1.!
Effects!of!public!transport!fares!and!supply!on!demand!and!costs!and!car!use!
The large literature on factors influencing public transport demand has been surveyed in Balcombe et al. (2004), Nijkamp and Pepping (1998), Holmgren (2007) and Hensher (2008).
For local and regional public bus transport (bus transport in the following) in the UK, Balcombe et al. (2004) note that the elasticity of demand with respect to public transport fares on average is estimated to -0,4 in the short run and to -1,0 in the long run. For passenger train services the elasticity of demand with respect to public transport fares is found to be -0,6 in the short run (Balcombe et al. 2004). Norheim (2006) finds an elasticity of demand for trips per inhabitant with respect to public transport fares of -0,32 for European cities.
Studies of public transport in Norwegian cities (Ellis and Øvrum 2014) found large differences in average values of time between individuals with different income, with larger cities having larger average values of time. These differences in valuation of travel time are positively correlated to income. This is shown also for Sweden (Börjesson et al. 2012). In cities with larger shares of high income earners using public transport this appears as higher average time values for public transport users. Such differences in time value are likely to affect the individual’s sensitivity of demand to price, frequency and speed.
For the demand for bus transport with respect to supplied vehicle kilometers Balcombe et al. (2004) present the estimates of elasticities 0,4 in the short and 0,7 in the long run (p 73). Preston och James (2000) find elasticities with respect to waiting time (a proxy for frequency or bus kilometers) in 23 British cities to be -0,64. Norheim (2006) finds an elasticity of demand for public transport trips per inhabitant with respect to supply of vehicle kilometers per inhabitant of 0,6 for European cities. Deb and Filippini (2013) model demand in log-linear form in Indian states with panel data. The demand variable used is passenger kilometers as a function of bus fares, per capita income, density of coverage (vehicle kilometers/per km2), vehicles per inhabitant and population (amongst others).
Dargay and Hanly (2002) also used a log linear form modelling demand in counties in the form of boarding per capita as a function of among other variables bus fare, service level per capita, disposable income per capita and population density.
For the study of cost functions, the reference model is the trans-log form (Viton 1981). Daraio et al (2016) surveying different econometric methods for studies of public transport costs find that the log-linear form and its various generalizations (trans-log among them) are frequent.
Jussila Hammes et al. (2016) estimate the elasticity of car use of inhabitants in urban areas with respect to public transport supply in the same urban areas as are used in this paper. They found the short run elasticity of car use with respect to public transport supply to be -0,01 and the long run elasticity -0,11. The authors therefore conclude that this indicates that the supply of public transport has little influence on the stagnating car use. For the effect on vehicle kilometers traveled (VKT) from public transit supply in large cities McIntosh et al. (2014) find the elasticities -0,071 and -0,157 depending on which model they use.
2.2.!
The!relative!efficiency!of!competitively!tendered!to!negotiated!performanceN
based!contracts!
There are many further papers discussing the relative efficiency of in house, negotiated performance-based contracts and competitively tendered contracts. These papers, however, do not examine the effects of demand incentives. Hensher and Wallis (2005) gives a worldwide survey of the effects of competitive tendering. The authors point to four important weaknesses in the previous literature. First, previous papers have difficulties in controlling for all kinds of institutional idiosyncrasies of different
countries. Second, in most of the studied cases, only the effects of the first round of tendering are reported. Later evidence has shown that costs have risen in second rounds of tendering (Wallis et al. 2010, Hensher and Stanley 2010). In addition, competitive tendering creates its own administrative costs. Third, both tendering processes and most studies focus on cost saving and not on social welfare. This may lead to a neglect of important external effects. Fourth, Hensher and Wallis (2010) point to that competitive tendering may lead to regulatory capture by providers as tendering induces market concentration (Mathiesen and Solvoll 2008, Yvrande-Billion 2006).
Roy and Yvrande-Billion (2007) study the difference in outcome between ownership and contractual regime in terms of technical efficiency for a panel of urban public transport networks in France. They find that private operators in a tendering regime appear to be more efficient than public operators operating under a negotiated scheme with fixed price or cost-plus contracts. Other authors do similar comparisons finding small differences (Barros and Peypoch, 2010, for Portugal, Filippini and Prioni, 2003, for Switzerland).
Piacenza (2006) compares fixed price contracts to cost-plus contracts and finds that fixed price
contract on average are associated with lower costs to the authority tendering. This paper does not give any results of the cost-plus contracts or on the supply. Filippini et al. (2015) examines the cost
performance for competitively tendered contracts and performance-based negotiated contracts in Switzerland. They find small differences in cost efficiency. Similar results are presented for Australian cities by Hensher (2015). Hensher compares competitively tendered contracts with negotiated
performance based contracts.
2.3.!
Larger!and!denser!cities!and!parking!supply!
A principal observation in the literature on car use in cities has been that larger and denser metropolitan cities are associated with less car use, lower energy consumption and less carbon emissions per household (e.g. Brownstone and Golob 2009, Glaser and Kahn 2010). Cervero and Murakami (2010) study the effect of different dimensions of built environment (the four D’s: density, diversity, design and destination accessibility (connectivity)) on vehicle miles traveled (VMT) as a proxy for the potential of reducing greenhouse gas emissions. The basis is a data set from 370 urbanized areas in the USA. The results show that population density has a total effect (direct minus indirect effect) in elasticity terms of -0,38. In large cities worldwide McIntosh et al (2014) find the elasticity of VKT with respect to urban density to be -0,20.
Indirectly, this lesser car use also influences the demand for public transport trips. Norheim (2006) finds that the elasticity of the demand for public transport trips per capita with respect to population size is -0,21 for large European cities2. The elasticity of the demand for public transport trips per capita with respect to population density in the same cities is 0,36. !
For the demand for car trips with respect to the price of parking TRACE (1999) reports a total short run elasticity of -0,11. Hensher and King (2001) report considerably higher effects from parking prices on car use to the central business districts (CBD). In the magnitude of -0,5 to -0,9 for such trips. Norheim (2006) reports that the supply of parking places in a city center is a factor behind car use and public transport market share, and reports a 0,09 elasticity of demand for car trips per inhabitant with respect to rate of supply of parking spaces to workplaces.
2 This result suggests that population size is not associated with more public transport use. It should be
interpreted in conjunction with the estimate for density. If a city grows with increasing density then the public transport share increases.
3.! Policy!objectives!
The national transport policy objective adopted by the Swedish parliament ”is to ensure the economic efficiency and long-term sustainability of transport provision for citizens and enterprise throughout Sweden”. The policies for the regions are decided by elected regional assemblies. The main
responsibilities for these assemblies are health care and public transport of which the expenditures for public transport are small (on average circa 10 percent) compared to expenditures for health care. The organization Partnersamverkan including the association of regional public transport authorities and the operator organizations adopted the goal of doubling the number of trips and market shares and state that “attaining the goal would contribute to attaining goals for environment, employment, traffic safety and gender equality” and that “CO2 emissons from passenger transport would be reduced by 24
percent” (Partnersamverkan 2017). No claim is formulated on the of net effects on welfare.
The following presentation of goals is based on presentations of goals available in the beginning of 2016. The policy goals in Skåne and Västra Götaland (two regions containing 7 of the 17 cities in our data set) both emphasize doubling the number of trips with public transport from 2006 to 2020. Skåne also aims for doubling the market share of public transport to 2030. Further, both state that an increase in the degree of customer satisfaction is a goal. Improved accessibility for disabled persons to public transport is also a common goal. Finally, both aim at less carbon-emissions by transforming the fleet to vehicles without emissions. This set of goals is highly parallel to the goals of other authorities. Most authorities aim for increases in the number of trips, market share, customer satisfaction, improved accessibility and less carbon emissions.
Some authorities however settle for less ambitious goals for increases in public transport patronage. In Östergötland (2 cities in our data set) the doubling goal is acknowledged but the authority says that this is too difficult to attain. The authority aims at powering all buses with renewable energy by 2015. It also acknowledges that accessibility for disabled is important and that higher degree of customer satisfaction is a goal but it does not set definitive targets for these goals. The region observes that the degree of funding by ticket revenue has been declining and that the region wishes to reverse this development and attain at least 50 percent funding by ticket revenue.
The Jönköping authority aims at a 60 percent increase in patronage to 2025. It also aims at increased satisfaction, accessibility and less carbon emission3. One reason for this, modest ambition, may be the
awareness that attaining these goals will be costly and the region wants to attain at least 50 percent self-financing.
The authority in Gävleborg aims at increasing patronage by doubling the market share of public transport to 2030. Gävleborg which also aims for improving customer satisfaction, accessibility for disabled and a goal for reduction of carbon emissions, also has set up an ambition to increase efficiency.
The authority in Värmland has the goal to increase the number of trips by 4 percent a year and to increase the market share from 12 to 14 percent in 2018. Värmland also aims for improving customer satisfaction, accessibility for disabled and a goal for reduction of carbon emissions, and has set up an ambition to increase efficiency.
Interestingly several of these documents mention increasing efficiency as a goal. This aspect however receives very different discussions, mostly in production terms and not in economic welfare terms. Furthermore, some documents discuss the need to cover costs by introducing self-financing goals but few discuss the rapidly rising costs.
3 All public transport vehicles are powered by renewable energy sources and energy consumption per km is
From this it is concluded that politicians responsible for public transport consider growth in public transport trips and market shares to be an important goal. In some regions, the realities of cost increases, however, have led them to temper their ambitions by including cost coverage as a constraint.
4.! Data!and!description!
4.1.!
Data!
For the main purpose of this study the data used is from bus transport in 17 Swedish cities4 from 1997 to 2011. Our source of this data is Stadsbuss & Qompany (Göran Lundblad). The ultimate sources have been the respective RPTAs. The concept of city varies in the below presented data sets. In the data set from the 17 cities, the city is the area covered by the city bus service network provided by the city. This area is not associated with any strict limits. For the variables population size and density, the Swedish concept “tätort” (urban area) has been used. This is a geographical concept defined by a maximal distance between buildings. These urban areas rarely correspond either exactly to the borders of the municipality nor to the historical or other concept of the borders of a city. Although the match is not perfect, the city transport areas have been associated with the urban areas with the same name. The data set on bus services contains the following variables: the total number of boardings, aggregate vehicle kilometers, total costs and total ticket revenue per boarding passenger. The latter two deflated with the Statistics Sweden’s consumer price index.
The demand incentive dummy variable has been constructed by using among other sources a data set from Trafikanalys (2015) on the current construction of contracts indicating whether or not the city, in addition to a gross cost fixed payment, also applies some further payment per boarding passenger. Readily available information on the intensity of the demand incentive is lacking for most of the years. Such data is only available for the contracts active in 2013 and later which in many cases cover more than one year in our period but still far from all years. The demand incentive is therefore modeled as a dummy variable taking the value 1 if there is a payment for the number of boarding passengers and 0 otherwise.
The variables population in the city and the city’s area are retrieved from Statistics Sweden’s urban area database (Tätortsdatabas) which reports for each urban area (tätort) quinquennially. Between each of the years, values for this study have been proportionately interpolated. With the above variables the average population density has been calculated.
This panel data is unbalanced as all values or some values are sometimes missing for a year. When there are missing values for one year or two consecutive years the values have been interpolated between the preceding and following year. The total number of boardings do not necessarily represent the total number of paying passengers, as some passengers may be entitled to reduced or zero fares. Further, data are used on the vehicle kilometers traveled (VKT) by private cars aggregated to municipal level, the total number of car owners and the population for each municipality. These data are retrieved from Statistics Sweden data. These data were also used in Jussila Hammes et al. (2016) to examine the effects of public transport supply on individual car use.
In a separate data set, travel surveys from 2011 and around surveys were compiled. This constitutes a cross section of 20 municipalities where large cities5 are located. As travel surveys were only available
for 11 of the 17 municipalities in the panel data set, a further 9 municipalities, were collected to present an indication of how the mode share of public transport is correlated with the shares of other modes. (See the reference list for travel surveys). This data set is intended to indicate how mode shares
4 In order of population size from smallest to largest the cities are: Trelleborg, Landskrona, Skövde, Kristianstad,
Östersund, Luleå, Sundsvall, Halmstad, Växjö, Karlstad, Borås, Gävle, Lund, Norrköping, Jönköping, Helsingborg and Linköping.
5 The following 12 cities overlap with the panel data set. In order from smallest to largest: Trelleborg,
Landskrona, Halmstad, Luleå, Växjö, Karlstad, Gävle, Lund, Norrköping, Jönköping, Helsingborg and Linköping. The other 8 are new: Piteå, Örnsköldsvik, Nyköping, Falun, Kalmar, Karlskrona, Eskilstuna and Örebro.
and population size are correlated in cities. This is built on the assumption that most of the population in these municipalities live in the cities. The population of the 20 cities span from 26 000 inhabitants in Piteå to 116 000 in Örebro. A survey of parking charges in 2016 has been added to this data set.
!
4.2.!
Description!of!the!panel!data!
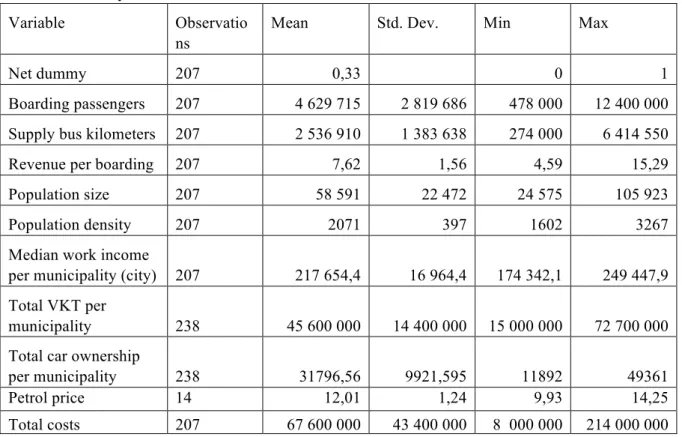
In this section the panel data from 1997 to 2011 in the 17 cities are presented and summarized. First the summary statistics are given in Table 1. Then some central observations from the data set are presented. In the appendix a correlation table (Table A2) is given for these variables.
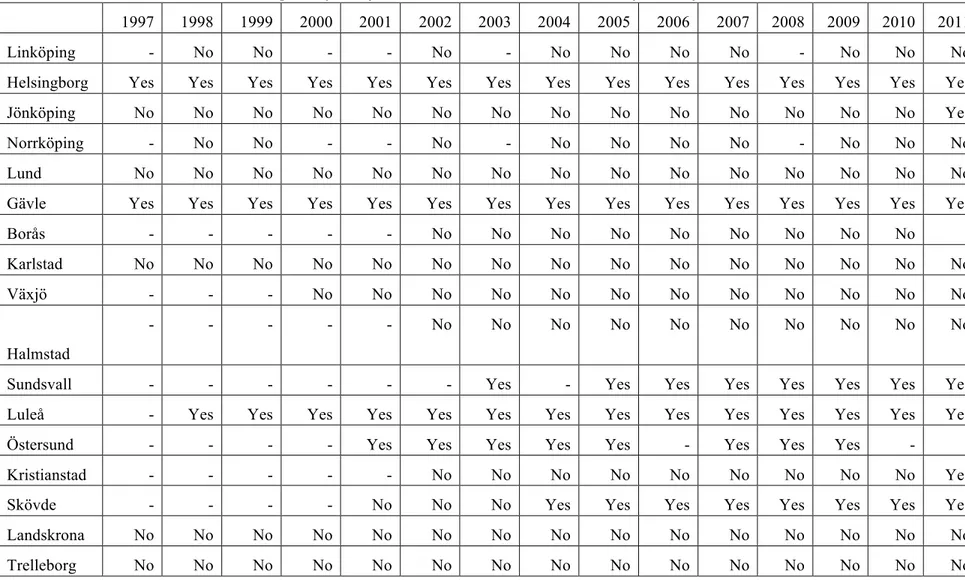
In the appendix a table of the demand incentive dummies is presented (Table A1). This shows that eight of the seventeen cities have operated with contracts involving payments per boarding passenger for at least one of the years in the data set. Only three operators (Skövde, Kristianstad and Jönköping) change regime – from having no demand incentive to having a demand incentive – during the
observed period.
As the data set on bus service production is not complete the aggregate development will be presented for the period 2000 to 2011 for which there are observations for both years from 10 cities. During this period the aggregate supply of bus kilometers increased by 38 percent. This was followed by an increase of boarding passengers of 36 percent in the same cities. At the same time the aggregate total costs over these cities increased by 106 percent. Total revenues increased by 107 percent and revenue per boarding by 49 percent. The population growth in the 17 municipalities containing the cities from 1997 to 2011 was 10 percent. And the average growth6 of the area in the same period was 4,6 percent.
Table 1 Summary statistics
Variable Observatio
ns
Mean Std. Dev. Min Max
Net dummy 207 0,33 0 1
Boarding passengers 207 4 629 715 2 819 686 478 000 12 400 000
Supply bus kilometers 207 2 536 910 1 383 638 274 000 6 414 550
Revenue per boarding 207 7,62 1,56 4,59 15,29
Population size 207 58 591 22 472 24 575 105 923
Population density 207 2071 397 1602 3267
Median work income
per municipality (city) 207 217 654,4 16 964,4 174 342,1 249 447,9
Total VKT per
municipality 238 45 600 000 14 400 000 15 000 000 72 700 000
Total car ownership
per municipality 238 31796,56 9921,595 11892 49361
Petrol price 14 12,01 1,24 9,93 14,25
Total costs 207 67 600 000 43 400 000 8 000 000 214 000 000
6 The urban area of a city grows when new buildings are built outside the periphery causing the geographically
It appears as the supply increase is not solely motivated by population growth as the supply increases much more than the population. This suggests that the supply growth may be motivated by a goal to increase supply rather than by a goal to have stable finances for the RPTAs or welfare increases. The latter are mostly not analyzed or considered in goal formulations.
The median work income, the total VKT per municipality is extracted from the odometer readings from the car inspection and the total car ownership in the municipality are collected from Statistics Sweden for the years 1997 to 2011. These are all aggregated to municipality level. The petrol price is obtained from the Swedish Petroleum and Biofuel institute (SPBI). These are yearly averages for all of Sweden, hence 14 observations. All monetary variables are deflated using Statistics Sweden’s
consumer price index.
From the unbalanced panel data set there are complete observations from 10 cities for the years 2000, 2006, 2011. From 2006 and 2011 there are complete observations from 15 cities.
Table 2 presents the changes in some key variables for different subgroups and time spans. Note that the population growth in the 10 cities picks up from an average over cities of 3,6 percent in the six years from 2000 to 2006 to an average over cities of 8 percent in the five years from 2006 to 2011. The average growth of the area covered by the cities, also picks up from 1,7 percent to 3,1 percent. The numbers are similar for the average over 15 cities in five years from 2006 to 2011.
Table 2 Total percentage growth in average over cities in different time spans
Supply Costs Ticket
revenue
Population Area Trips Trips/
Inhabitant 10 Cities 2000-2006 13 42 33 3,7 1,7 9 10 2006-2011 22 45 55 8 3,1 25 14 15 Cities 2006-2011 20 44 44 8 2,7 23 13 14 Cities 2010-2011 4,5 27 27 1,9 0 10 6,5
The supply of bus kilometers, on average, increases by much more than population growth, 13 percent in the six years from 2000 to 2006 and on average 22 percent in the five years from 2006 to 2011. The costs, on average, increase more than proportionately with 42 percent from 2000 to 2006 and 45 percent in five years from 2006 to 2011. For 2010 data is lacking for one of the 15 cities. Only in the last year from 2010 to 2011 the costs, on average, increase by 27 percent in 14 of the 15 cities and ticket revenue by the same rate. The supply only increases by 4,5 percent and trips by 10 percent.
4.3.!
Mode!shares!and!correlations!of!population!size!and!density!in!20!cities!
In this section, 20 cities for which travel survey data were found are analyzed with the available data. The relative attractiveness of public transport in cities are influenced by many factors. Among these are population size and density, income level and distribution, congestion on roads, availability and pricing of parking, the quality and quantity of public transport supply, the quality and quantity of bicycle infrastructure etc. This section aims at describing the relative attractiveness of public transport
alternative and compare among cites and compare to the car and bicycle alternatives. This is done by examining how the mode share of car and bicycle are correlated to population size and density and how the mode shares of car and bicycle are correlated to public transport use.
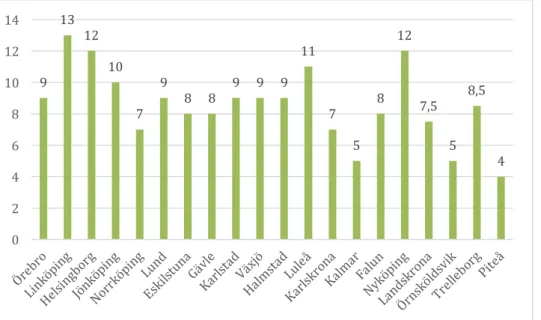
Some of these relationships may be influenced by policy while others may be harder, costlier or less politically attractive to influence. The design of the supply of public transport is the most obvious factor for local policy to influence. Among the design features are the layout of the network, the frequencies, the bus fleet and the price. All these factors are controlled by the RPTA. Local land use and parking policies are decided by the municipalities. Taxation of congestion and fuels are the responsibility of national parliament in Sweden and hence not available to municipalities. In the Diagram 1 the mode share of public transport in the municipalities containing the city are presented with cities ranked by population size from largest to the left to smallest to the right.
Diagram 1 The mode shares of public transport in 20 cities ranked by population size from largest to smallest. Percent of total number of trips.
Diagram 1 shows that there is quite a large variation in the mode share public transport in these cities with a mode share that is more than three times larger in city with the largest mode share. The mode share is moderately positively correlated (0,49) to population size (Table 3).
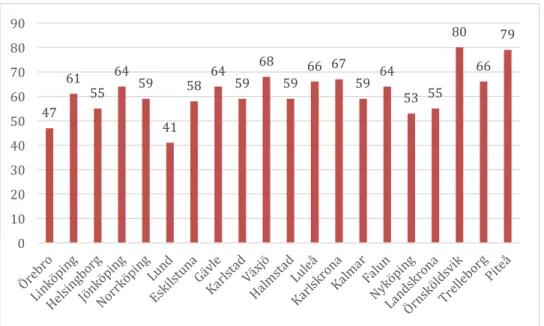
Diagram 2 shows the corresponding mode shares of car in the 20 cities. The mode share of car also varies within the sample with the highest mode share being about two times larger than the lowest. In contrast to the mode share of public transport, the mode share of car is moderately negatively
correlated (-0,54) to population size (Table 3).
9 13 12 10 7 9 8 8 9 9 9 11 7 5 8 12 7,5 5 8,5 4 0 2 4 6 8 10 12 14
Diagram 2 The mode shares of car in 20 cities ranked by population size from largest to smallest. Percent of total number of trips.
Diagram 3 presents the mode share of bicycle. The mode share of bicycle varies the most. The mode share of bicycle is moderately positively correlated (0,46) to population size (Table 3). There is also a similarly moderate positive correlation (0,46) between mode shares of public transport (Table 3).
Diagram 3 The mode shares of bicycle in 20 cities ranked by population size from largest to smallest. Percent of total number of trips.
47 61 55 64 59 41 58 64 59 68 59 66 67 59 64 53 55 80 66 79 0 10 20 30 40 50 60 70 80 90 29 26 12 10 13 26 13 14 19 15 19 10 7 20 10 26 15 2 13 9 0 5 10 15 20 25 30 35
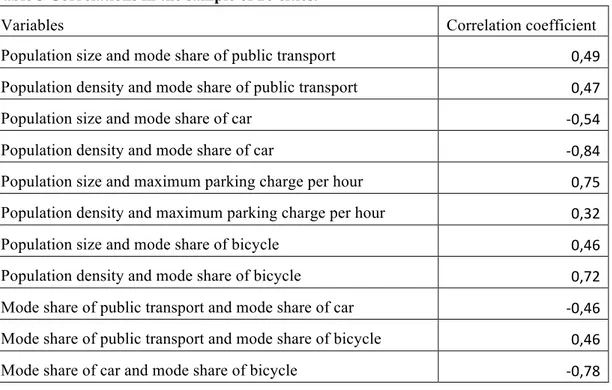
Table 3 Correlations in the sample of 20 cities.
Variables Correlation coefficient
Population size and mode share of public transport 0,49!
Population density and mode share of public transport 0,47!
Population size and mode share of car '0,54!
Population density and mode share of car '0,84!
Population size and maximum parking charge per hour 0,75!
Population density and maximum parking charge per hour 0,32!
Population size and mode share of bicycle 0,46!
Population density and mode share of bicycle 0,72!
Mode share of public transport and mode share of car '0,46!
Mode share of public transport and mode share of bicycle 0,46!
Mode share of car and mode share of bicycle '0,78!
Note that population density is strongly negatively correlated with mode share of car and strongly positively correlated with mode share of bicycle. The mode share of public transport is only
moderately correlated with either population size or population density. A moderate correlation is also present for population size and car use and population size and bicycle use. The mode share of public transport is moderately negatively correlated to the mode share of car and moderately positively correlated to the mode share of bicycle. The population size and the maximum parking charge per hour are also strongly correlated.
The strong negative correlation between population density and car use and between population size and parking charges, both indicate that the mode share of car is likely to be affected by other factors associated with larger population and larger population density. For example, in the larger cities the parking is likely to be scarcer. This is also a possible explanation for the results found in Jussila Hammes et al (2016) that car use stagnates in this period. The short-run elasticity of car use of inhabitants in urban areas with respect to public transport supply in the same 17 urban areas as in the panel data set was found to be -0,01 and the long-run elasticity -0,11. Jussila Hammes et al (2016) therefore conclude that this indicates that the supply of public transport has little influence on car use. A strong negative correlation is found between the mode share of car and the mode share of bicycle. This may be due to that those car users that cease to use the car prefer to switch to bicycle before public transport. The correlation between, on the one hand, the mode share of public transport and, on the other hand, the mode share of car or the mode share of bicycle is moderate. The correlation of car use and bicycle use respectively with public transport use are also moderate.
5.! The!models!!
In the introductory section two central hypotheses were identified. First it was noted that a positive demand incentive is likely to a positive effect on patronage at least if the demand incentive is larger than the marginal costs of securing one further passenger. With a small demand incentive and little freedom to influence fares, supply levels or other important characteristics of supply, only small effects on patronage can expected. The first hypothesis is therefore that the demand incentive has a positive effect on patronage. If the demand incentive has this effect on patronage this is likely to come at a cost and hence have a positive effect on costs also. The corresponding critical null-hypotheses is therefore that the demand incentive has no effect on patronage and no effect on costs.
The panel data variables are used to estimate two types of models. One for demand and one for total costs. Log-linear form are used for these functions. For the most comprehensive demand model it is assumed that the demanded quantity is dependent on if the contract contains a demand incentive, year dummies, the supply of bus kilometers (route length and frequency), population size, population density, median income per municipality, total vehicle kilometers traveled with private car per municipality and the total number of privately owned cars per municipality. In the case of the total cost model it is assumed that the total cost is dependent on if the contract contains a demand incentive, the supply of bus kilometers (route length and frequency), population size, population density and petrol price.
!
ln #$,& = ($+ (*+$,&, + -. (&
&/- 0&+ (1234$,&+ , (5672389:$,&+ (1;234<$,&+ (1=2340$,&+
($,&23:+$,&+ ($,&23>9#$,&+ ($,&234?$,&+ @$,&
Where T denotes demand for trips, indexing city with j and year with t, ($ is the city fixed effect, I the
demand incentive dummy, Dt year dummies, P ticket revenue per trip, BKM bus kilometers, PS
population size, PD population density, MI median income per municipality, VKT vehicle kilometers traveled per municipality, PC total number of privately owned cars per municipality and ε the error term.
Analogously, total costs are modelled as
ln ?$,&= ($+ (*+$,&, + -. (&
&/- 0&+ , (5672389:$,&+ (1;234<$,&+ (1=2340$,&+ ($,&23A4$,&+ @$,&
Where C denotes total costs to the public transport authority, indexing city with j and year with t, ($ is the city fixed effect, I the demand incentive dummy, Dt year dummies, BKM bus kilometers, PS
population size, PD population density and FP petrol price.
All models are estimated with fixed effects methods, using routines to calculate clustered standard errors. By using a log-linear formulation the coefficient estimates can be interpreted as elasticities.
6.! Results!
This section presents estimations of the patronage and cost models for total and costs per boarding passenger respectively. In these estimations the first model uses only the demand incentive dummy variable and then further control variables are successively introduced.
6.1.!
Patronage!models!
For the patronage model a function is estimated by fixed effects for the log of the total number of boarding passengers depending on coefficient of demand incentive dummy and the logged variables for bus kilometers, revenue per passenger, population size population density, income, total VKT, total car ownership and year dummies. The total VKT variable is preferred to the petrol price as this
variable is available for each municipality.
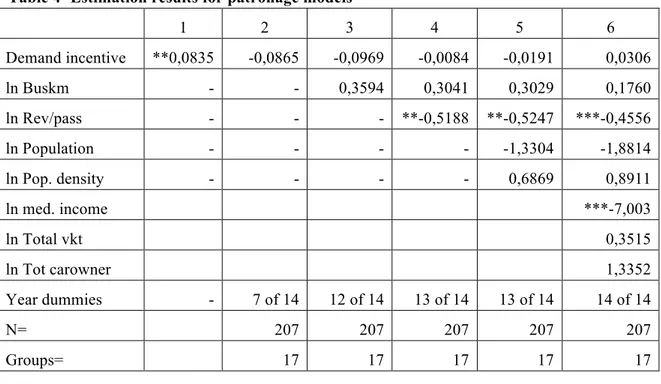
Table 47 Estimation results for patronage models
1 2 3 4 5 6 Demand incentive **0,0835 -0,0865 -0,0969 -0,0084 -0,0191 0,0306 ln Buskm - - 0,3594 0,3041 0,3029 0,1760 ln Rev/pass - - - **-0,5188 **-0,5247 ***-0,4556 ln Population - - - - -1,3304 -1,8814 ln Pop. density - - - - 0,6869 0,8911 ln med. income ***-7,003 ln Total vkt 0,3515 ln Tot carowner 1,3352 Year dummies - 7 of 14 12 of 14 13 of 14 13 of 14 14 of 14 N= 207 207 207 207 207 Groups= 17 17 17 17 17 *** p < 0,01 ** p < 0,05 * p < 0,1
The demand incentives do not have a statistically significant effect on patronage when introducing control variables. Furthermore, the only statistically significant estimations of a coefficient in the demand function are the coefficient for the proxy for price (total ticket revenue per trip) and median income.
The preferred model is model 6. In this model the estimate of revenue per passenger suggests an elasticity of demand with respect to price of -0,45 which is slightly higher than the number found in previous meta studies Holmgren (2007) and Balcombe et al (2004). Balcombe et al (2004) reports an elasticity of bus transport demand with respect to supply in the order of magnitude 0,4. These estimates are not considered as estimates as elasticity estimates of the respective variables.
These results are by no means ideal, in the sense that they show a high degree of significance. As there are so few, such results, in the literature, it may still be worthwhile to present the results for further discussion about what kinds of data are available and how these could be used to study the intended effects of contracts.
A number of variants to these models have been tried. The most important variant was to examine the idea that there may be endogeneity issues with using the supply variable bus kilometers as an
explanatory variable for bus transport demand. An instrumental variable approach was therefore tried using population size as an instrument for supplied bus kilometers. This approach does not change the fact that the estimate of the coefficient of the demand incentive dummy is not statistically significant. A variable normalizing the bus supply by dividing each supply number by the city area was tested. This did not improve the model as this new variable definition is not statistically significant.
Consequently, these demand estimations suggest that the demand incentive does not have the intended effect of generating an additional effect of more demand for public transport.
6.2.!
Cost!model!
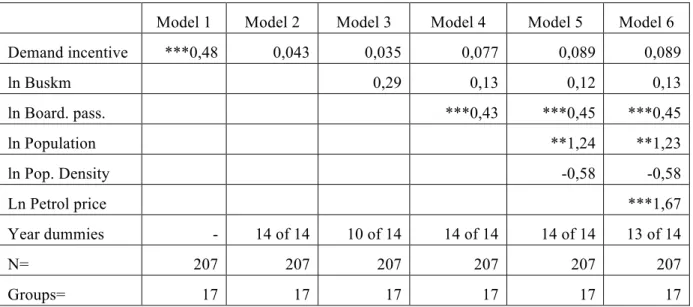
Analogously with the demand function the logged total costs are estimated with fixed effects panel data methods with the dummy for demand incentives and dependent logged variables ln bus kilometers, ln boarding passengers, ln population and ln population density and petrol price. In this sequence of model estimations, the effect of the coefficient of the demand incentive dummy ceases to be statistically insignificant when the year dummies are introduced (Model 2). A significant influence is found from the number of boarding passengers and petrol price on total cost. The logged bus kilometer variable has no significant influence on total costs. This is a bit surprising as this variable is strongly significant in other studies e.g. Vigren (2015).
Table 5 Estimation results for total cost models
Model 1 Model 2 Model 3 Model 4 Model 5 Model 6
Demand incentive ***0,48 0,043 0,035 0,077 0,089 0,089 ln Buskm 0,29 0,13 0,12 0,13 ln Board. pass. ***0,43 ***0,45 ***0,45 ln Population **1,24 **1,23 ln Pop. Density -0,58 -0,58 Ln Petrol price ***1,67 Year dummies - 14 of 14 10 of 14 14 of 14 14 of 14 13 of 14 N= 207 207 207 207 207 207 Groups= 17 17 17 17 17 17
The demand incentives do not have a statistically significant effect on total costs when introducing control variables. The coefficients for control variables that yield statistically significant estimations are the number of trips, population and petrol price. All these variables are plausible contributors to costs. Surprisingly, supply of bus kilometers is not. This may be due to identification issues as population, bus kilometers and boarding passengers are highly correlated (cf. Table A2 in the appendix).
7.! Conclusion!
The goal of this paper is to analyze the effect of demand incentives in bus transport in 17 medium sized Swedish cities on demand and costs, controlling for important variables potentially affecting the outcomes. This study uses panel data from 1997 to 2011 including the following variables: boarding passengers, total costs, revenues per passenger, bus kilometers, population size, population density, median income in the municipalities, total vehicle kilometers traveled in private cars, the total number of privately owned cars and petrol price.
The demand incentives have been introduced as a strategy to increase patronage for public transport. The goal to grow patronage have been justified by the effects on goals for employment, accessibility for disabled, traffic safety and environment, in particular, CO2-emissions.
As a background the mode shares of partly overlapping set of 20 medium sized Swedish cities were examined. The most important observations are that the mode share of public transport is moderately negatively correlated to the mode share of car and moderately positively correlated to the mode share of bicycle. The mode share of public transport is only moderately correlated with either population size or population density. The mode share of car is strongly negatively correlated with population density. Population density is also strongly positively correlated with mode share of bicycle. A moderate correlation is also present for population size and car use and population size and bicycle use. This suggests that car and bicycle use may be easier to influence by policy instruments for car use, city planning and land use policy than by public transport supply.
For the demand model, the parameter estimate of the demand incentive variable was not found to be statistically significant. The only control variable that was found to be significant was the proxy variable for price (total revenue per boarding passenger).
For the total cost function, the demand incentive variable was not found to be statistically significant. The three control variables that were found to have a statistically significant effect on costs were the number of boarding passengers, population size and petrol price.
The conclusion from these estimates suggest that the recommendations to use incentives issued by the Partnersamverkan organization in combination with the limited freedom for operators to influence important variables that determine demand neither generates sufficient additional drive to increase patronage or to reduce costs. The effects of several control variables are neither the expected nor significant. The results, however, indicate that the demand incentives alone were too weak to give statistically observable effects. It does not however, exclude the possibility that other contract forms, perhaps with larger freedom to design supply and larger demand incentives, could have induced increased demand.
Acknowledgements!
We thank Johanna Jussila-Hammes for reading and commenting for the VTI review seminar. Andreas Vigren for many helpful reflections on econometric method. Bård Norheim and Torbjörn Eriksson for many discussions on the factors that influence public transport use in cities.
References!
Balcombe, R. (editor), R. Mackett, N. Paulley, J. Preston, J. Shires, H. Titheridge, M. (2004). “Demand for public transport”, TRL Report 593.
Barros, C.P. and Peypoch, N. (2010) Productivity changes in Portuguese bus companies, Transport Policy 17 (2010) 295–302.
Brownstone D. and Golob T., (2009), The impact of residential density on vehicle usage and energy consumption Journal of Urban Economics 65, 91–98.
Börjesson, M., Fosgerau, M. and Algers, S. (2012) On the income elasticity of the value of travel time, Transportation Research Part A, 46, 368–377.
Cullmann, A., Farsi, M. Filippini, M., (2012) Unobserved Heterogeneity and Efficiency Measurement in Public Transport, Journal of Transport Economics and Policy, 46, pp. 51-66.
Cervero R. and Murakami, J., (2010) Effects of built environments on vehicle miles traveled: evidence from 370 US urbanized areas, Environment and Planning A, 42, 400-418.
Dargay J.M. and Hanly M. (2002) The Demand for Local Bus Services in England, Journal of Transport Economics and Policy, Volume 36, 73-91.
Danielson, H., Andersson, H. and Wretstrand, A. (2016) Superincentive contracts : A study of the VBP contract models in Stockholm, K2 Working Paper 2016:5.
Daraio, C., Diana, M. Di Costa, Leporelli, C. Matteucci G. Nastasi, A. (2016) Efficiency and
effectiveness in the urban public transport sector: a critical review with directions for future research, European Journal of Operational Research, Vol 248. 1-20.
Deb, K., Filippini M., (2013) Public bus transport demand elasticities in India, Journal of Transport Economics and Policy, 47, 419-436.
Ellis, I. and Øvrum, A., (2014), Klimaeffektiv kollektivsatsning: Trafikantenes verdsetting av tid i fem byområder, UA-rapport 46/2014.
Filippini, M., Koller, M., Masiero, G. (2015) Competitive tendering versus performance-based negotiation in Swiss public transport, Transportation Research Part A 82, 158–168
Glaser and Kahn, (2010), The greenness of cities: Carbon dioxide emissions and urban development, Journal of Urban Economics, 67, 404–418.
Hensher, D. (2008) Assessing systematic sources of variation in public transport elasticities: Some comparative warnings Transportation Research Part A 42 (2008) 1031–1042.
Hensher, D. (2015) Cost Efficiency under Negotiated Performance-based Contracts and
Benchmarking, Journal of Transport Economics and Policy, Volume 49, Part 1, January 2015, pp. 133–148.
Hensher D., Ho, C., Knowles, L. (2016) Efficient contracting and incentive agreements between regulators and bus operators: The influence of risk preferences of contracting agents on contract choice
,!
Transportation Research Part A, Vol. 87, 22–40.Hensher D. and King J., (2001), Parking demand and responsiveness to supply, pricing and location in the Sydney central business district. Transportation Research Part A, 35, (2001) 177-196.
Hensher, D. and Stanley, J. (2003) Performance-based quality contracts in bus service provision, Transportation Research Part A, 37, 519–538.
Hensher, D. A. and I. Wallis (2005): ‘Competitive tendering as a contracting mechanism for
subsidizing transportation: The Bus Experience’, Journal of Transport Economics and Policy, 39(3), 295–321.
Holmgren, J. (2007) Meta-analysis of public transport demand, Transportation Research Part A, 41, 1021–1035.
Jansson K., and Pyddoke R., (2010) Quality incentives and quality outcomes in procured public transport - Case study Stockholm, Research in Transportation Economics 29 (2010) 11-18.
Jussila Hammes, J., Pyddoke, R. and Swärdh, J.-E., (2016), The influence of public transport supply on private car use in 17 midsized Swedish cities from 1997 to 2011, CTS Working paper 2016:25. Mathiesen, T.A., Solvoll, G. (2008) Competitive tendering and structural changes: An example from the bus industry, Transport Policy 15 (2008) 1–11.
McIntosch J., Trubka R., Kenworthy, J. and Newman, P., (2014) The role of urban form and transit in city car dependence: Analysis of 26 global cities from 1960 to 2000, Transportation Research Part D 33, 95–110.
Nijkamp P., and Pepping, G., (1998), Meta-Analysis for Explaining the Variance in Public Transport Demand Elasticities in Europe, Journal of Transportation and Statistics 1, 1-14. Nilsson, J.-E. (2011) Kollektivtrafik utan styrning, Rapport till Expertgruppen för Studier i Offentlig Ekonomi, 2011:6.
Nobelprize (2016) "The Prize in Economic Sciences 2016 - Advanced Information: Oliver Hart and Bengt Holmström: Contract Theory". Nobelprize.org. Nobel Media AB 2014. Web. 26 Sep 2017. Norheim, B., (2006) Kollektivtransport i nordiske byer – Markedspotential og utfordringer framover, Urbanet 2/2006.
Partnersamverkan, 2017, http://www.svenskkollektivtrafik.se/partnersamverkan/om-oss/mal-och-vision/.
Piacenza, M. (2006) Regulatory contracts and cost efficiency: Stochastic frontier evidence from the Italian local public transport, Journal of Production Analysis, 25, 257-277.
Preston, J. and James, T. (2000) Analysis of demand for bus services, Final report, Transport studies unit, University of Oxford.
Pyddoke, R. (2016), Modelling effects of policy instruments for sustainable urban transport in Scandinavia.
Pyddoke, R. and Lindgren, H. (2016) Uppföljning av E20 avtalen, K2.
Roy, W., Yvrande-Billon, A. (2007) Ownership, Contractual Practices and Technical Efficiency: The Case of Urban Public Transport in France, Journal of Transport Economics and Policy, Volume 41, Part 2, May 2007, pp. 257–282.
TRACE (1999), Elasticity Handbook: Elasticities for Prototypical Contexts, Prepared for the European Commission, Directorate-General for Transport, Contract No: RO-97-SC.2035. Trafikanalys, 2015, Avtalen för den upphandlade kollektivtrafiken 2013, Rapport 2015:13.
Vigren, A., (2015), Cost in Swedish Public Transport, An analysis of cost drivers and cost efficiency in public transport contracts. Stockholm, Sweden: Licentiate thesis in transport science, KTH. Viton, P.A. (1981) A Translog Cost Function for Urban Bus Transit, The Journal of Industrial Economics, 29, No. 3), pp. 287-304.
Wallis, I., Bray, D. and Webster H. (2010) To competitively tender or to negotiate e Weighing up the choices in a mature market, Research in Transportation Economics, 29, 89-98.
Yvrande-Billon, A. (2006) The attribution process of delegation contracts in the French urban public transport sector: Why competitive tendering is a myth, Annals of Public and Cooperative Economics 77:4, pp. 453–478.
Travel!surveys!of!Swedish!municipalities!
Eskilstuna Trafiken i Eskilstuna 2012, Stadsbyggnadsförvaltningen 2012 Gävle Resvanor i Gävle 2012 Trivector, Rapport 2012:107
Halmstad Så reser hallänningarna – Resvaneundersökning Halland 2014 Helsingborg Resvaneundersökning för Skåne 2013
Jönköping Resvanor i Jönköpings kommun 2014
Kalmar Resvaneundersökning i sydöstra Sverige 2012, Trafikverket Karlskrona Resvaneundersökning i sydöstra Sverige 2012, Trafikverket Karlstad Attityd- och resvaneundersökning 2014
Landskrona Resvaneundersökning för Skåne 2013
Linköping RVU-2014 Resvaneundersökning i Linköpings kommun 2014 Luleå Kort om resvanor i Luleå 2010, Luleå kommun
Lund Resvaneundersökning för Skåne 2013
Norrköping Resvaneundersökning (RVU) i Norrköpings kommun 2014 Nyköping Resvaneundersökning med åtgärdsförslag i Nyköping 2012 Piteå Attityd- och resvaneundersökning i Piteå 2011, Piteå Kommun Trelleborg Resvaneundersökning för Skåne 2013
Växjö Resvaneundersökning i sydöstra Sverige 2012, Trafikverket
Örebro RVU 2011 Örebro och Kumla, 2011
8.# Appendix#
Table A1 Presence of demand incentive per city and year, - indicates no data used for analysis this year
1997 1998 1999 2000 2001 2002 2003 2004 2005 2006 2007 2008 2009 2010 2011
Linköping - No No - - No - No No No No - No No No
Helsingborg Yes Yes Yes Yes Yes Yes Yes Yes Yes Yes Yes Yes Yes Yes Yes
Jönköping No No No No No No No No No No No No No No Yes
Norrköping - No No - - No - No No No No - No No No
Lund No No No No No No No No No No No No No No No
Gävle Yes Yes Yes Yes Yes Yes Yes Yes Yes Yes Yes Yes Yes Yes Yes
Borås - - - No No No No No No No No No -
Karlstad No No No No No No No No No No No No No No No
Växjö - - - No No No No No No No No No No No No
Halmstad
- - - No No No No No No No No No No
Sundsvall - - - Yes - Yes Yes Yes Yes Yes Yes Yes
Luleå - Yes Yes Yes Yes Yes Yes Yes Yes Yes Yes Yes Yes Yes Yes
Östersund - - - - Yes Yes Yes Yes Yes - Yes Yes Yes - -
Kristianstad - - - No No No No No No No No No Yes
Skövde - - - - No No No Yes Yes Yes Yes Yes Yes Yes Yes
Landskrona No No No No No No No No No No No No No No No
Table A2 Correlation matrix for variables ln Trips Demand incentive ln Buskm ln Rev/pass ln Population ln Pop. density ln med. income ln Total vkt ln Tot carowner ln Petrol price ln Tot Cost ln city area ln Trips 1,000 Demand incentive 0,132 1,000 ln Buskm 0,947 0,242 1,000 ln Rev/pass 0,178 0,444 0,321 1,000 ln Population 0,920 0,064 0,875 0,154 1,000 ln Pop. density 0,104 -0,420 -0,052 -0,469 0,233 1,000 ln med. income 0,214 0,290 0,319 0,616 0,136 -0,343 1,000 ln Total vkt 0,886 0,066 0,870 0,253 0,868 -0,005 0,358 1,000 ln Tot carowner 0,903 0,113 0,886 0,240 0,892 -0,015 0,298 0,993 1,000 ln Petrol price 0,097 0,073 0,144 - 0,038 -0,000 - - - 1,000 ln Tot Cost 0,954 0,181 0,946 - 0,882 0,048 - - - 0,274 1,000 ln city area 0,883 0,246 0,905 0,358 0,907 -0,199 0,286 0,877 0,905 0,039 0,869 1,000
K2#är#Sveriges#nationella#centrum#för#forskning#och#utbildning#om#kollektivtrafik.#Här#möts#akademi,#offentliga#aktörer#och# näringsliv#för#att#tillsammans#diskutera#och#utveckla#kollektivtrafikens#roll#i#Sverige.## Vi#forskar#om#hur#kollektivtrafiken#kan#bidra#till#framtidens#attraktiva#och#hållbara#storstadsregioner.#Vi#utbildar# kollektivtrafikens#aktörer#och#sprider#kunskap#till#beslutsfattare#så#att#debatten#om#kollektivtrafik#förs#på#vetenskaplig#grund.## K2#drivs#och#finansieras#av#Lunds#universitet,#Malmö#högskola#och#VTI#i#samarbete#med#Stockholms#läns#landsting,#Västra# Götalandsregionen#och#Region#Skåne.#Vi#får#stöd#av#Vinnova,#Formas#och#Trafikverket.#