DISSERTATION
ALTERNATIVE HEART ASSISTANCE PUMP
Submitted by Alireza Sharifi
Department of Mechanical Engineering
In partial fulfillment of the requirements For the Degree of Doctor of Philosophy
Colorado State University Fort Collins, Colorado
Spring 2021
Doctoral committee:
Advisor: David Bark Co-Advisor: Susan James Xinfeng Gao
Ketul Popat Brian Scansen
Copyright by Alireza Sharifi 2021 All Rights Reserved
ABSTRACT
ALTERNATIVE HEART ASSISTANCE PUMP
On average, the human heart beats around 115,000, and pumps around 2,000 gallons of blood daily. This essential organ may undergo systolic or diastolic dysfunction in which the heart cannot properly contract or relax, respectively. To help hearts pump effectively should these types of failures occur, ventricular assist devices (VAD) are implemented as a temporary or permanent solution. The most common VAD is the left ventricular assist device (LVAD) which supports the left ventricle in pumping the oxygen-rich blood from the heart to the aorta, and ultimately to the rest of the body. Although current VADs are an important treatment for advanced heart failure, generally VADS come with many complications and issues after implantation. These complications include incidents of hemolysis (tearing of the blood cells), thrombosis (clotting of the blood), bleeding (especially in the gastrointestinal tract), and infection at the driveline site. Specifically, the current continuous flow pumps are associated with a much higher incidence of gastrointestinal bleeding, myocardial perfusion, kidney problems, among others, compared with the earlier generation pulsatile pumps. However, the presence of several moving mechanical components made the pulsatile pumps less durable, bulky, and prone to malfunction, ultimately leading to favor toward continuous flow designs.
The goal of the present study is to develop a novel heart assist pump, overcoming drawbacks to current commercially available pumps, by improving hemodynamic (blood flow) performance, pulsatility, and eliminating bleeding disorders. Our design will overcome the current pumps which suffer from non-physiological flow, and blood damage. The impact of this work goes beyond heart assist devices and would be applicable to other blood pumps.
The fundamental biological and physical principles of designing a blood pump will be reviewed in chapter one. In addition, recent studies on current LVADs and the motivation behind these studies will also be discussed. Then, the idea of using a contractive tubular heart as an alternative pump will be presented in chapter two. To understand the pumping mechanism of the tubular heart, a detailed study on the embryonic heart is presented in this chapter.
Subsequently, the effect of flow forces on blood cells will be studied in chapter 3. Moreover, the relation between flow regime and bleeding disorders have been studied in the same chapter. A discussion of our design, including the pump design, testing set up,
experimental results will be presented in chapter 4. Finally, the limitations of the present study and future work will be presented in chapter 5.
ACKNOWLEDGEMENTS
I would like to acknowledge my indebtedness and render my warmest thanks to my advisor Dr. David Bark. He is always happy and willing to help me solve the confusions and direct me approach to the final result of the thesis. Without his encouragement and support, I would not finish my PhD study.
Furthermore, I would like to appreciate my co-advisor, Dr. James who have helped me undertake this research. Many thanks to my PhD committee members, Dr. Gao, Dr. Popat and Dr. Scansen for extended discussions and valuable suggestions which have contributed greatly to the
improvement of the thesis. I must express my gratitude to Dr. Bortot and Dr. Di Paola who helped we to have a better understanding of the biology side of my PhD work.
I would also like to say a heartfelt thank you to my family for always believing in me and
encouraging me to follow my dreams. They have sacrificed for bringing me up and providing me in every possible way.
Finally, I would like to thank the Mechanical engineering department, and specially Dr. Petro for the GTA opportunity which introduced me to several interesting senior design projects.
TABLE OF CONTENTS
ABSTRACT ... ii
ACKNOWLEGMENTS ... iv
LIST OF TABLES ...vii
LIST OF FIGURES ... viii
CHAPTER 1: HEART ASSISTANT PUMP BACKGROUND ... 1
1.1 INTRODUCTION ... 1
1.2 LVAD HISTORY ... 2
1.2.1 IMPLANTED LVAD CHARACTERISTIC ... 4
1.2.2 IMPLANTED CURRENT PROBLEMS ... 5
1.2.3 LVAD STATE OF ART ... 6
1.3 CONCLUSION ... 8
1.4 REFERENCES ... 10
CHAPTER 2: EMBRYONIC HEART PUMPING MECHANISM ... 14
2.1 INTRODUCTION... 14
2.2 METHOD ... 16
2.3 RESULTS ... 21
2.4 REFERENCES ... 36
CHAPTER 3: EFFECT OF FLOW MECHANICAL FORCES ON BLOOD CELLS... 39
3.1 INTRODUCTION... 39
3.2 METHOD ... 40
3.2.2 VANE RHEOMETER SIMULATION METHOD ... 42
3.2.3 SIMULATION METHOD FOR VORTEX MIXER ... 43
3.2.4 SCALING THEORY FOR CHAIN SCISSION ... 44
3.3 RESULTS ... 46
3.4 REFERENCES ... 70
CHAPTER 4: TUBULAR HEART ASSISTANT PUMP ... 73
4.1 INTRODUCTION... 73 4.2 METHOD ... 73 4.2.1 EXPERIMENTAL METHOD ... 75 4.2.2 SIMULATION METHOD ... 76 4.3 RESULTS ... 76 4.4 REFERENCES ... 87
LIST OF TABLES
Table 2.1. Parameters for numerical simulations ... 18
Table 2.2. The radial expansion during a cardiac cycle for different pumping functions ... 25
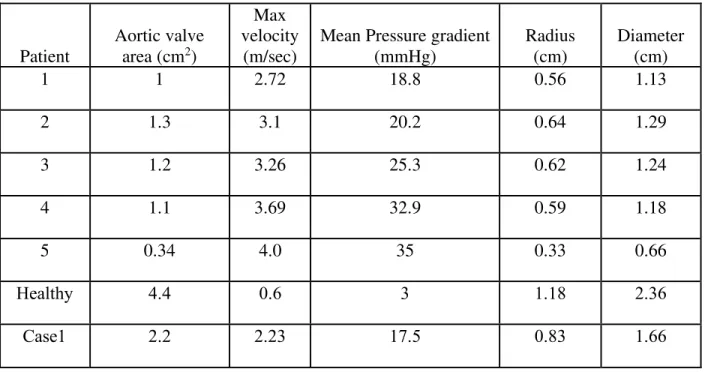
Table 3.1: Aortic valve patient data and CFD model data ... 41
Table 3.2: the geometrical specification of the rheometer ... 43
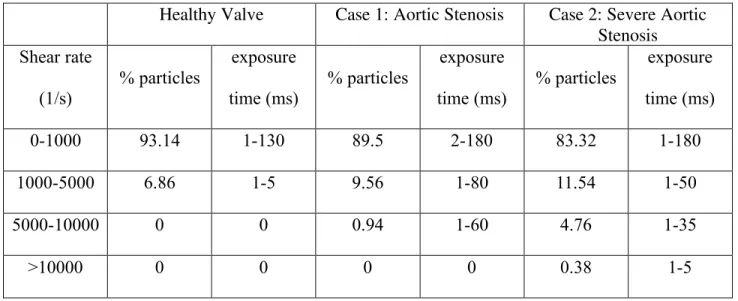
Table 3.3. Particle Exposure Time: In the three aortic valve models ... 47
Table 3.4. Particle Exposure Time: Microfluidic models ... 47
Table 3.5. Particle Exposure Time to Elongational Flow: In the three aortic valve models ... 49
Table 3.6. Particle Exposure Time to Elongational Flow: Microfluidic models ... 49
Table 3.7. Parameters found in experimental studies ... 60
LIST OF FIGURES
Figure 1.1. The LVAD parts, 1: pump, 2: outflow cannula, 3: driveline, 4: controller, 5: batteries ... 2 Figure 2.1. (a) Image of a 30 hpf embryonic zebrafish head and heart (enlarged inset on right). The myocardium is indicated by the dashed line. The endocardium represents the flow boundary and is indicated by the solid line. The cardiac jelly exists between these two layers. The blue arrow indicates flow direction. (b) Axisymmetric model representation of the heart tube. R is vascular resistance and C is the compliance (c) Layers of the heart tube model in a cross-sectional view, where the endocardium is assumed to be of the same mechanical
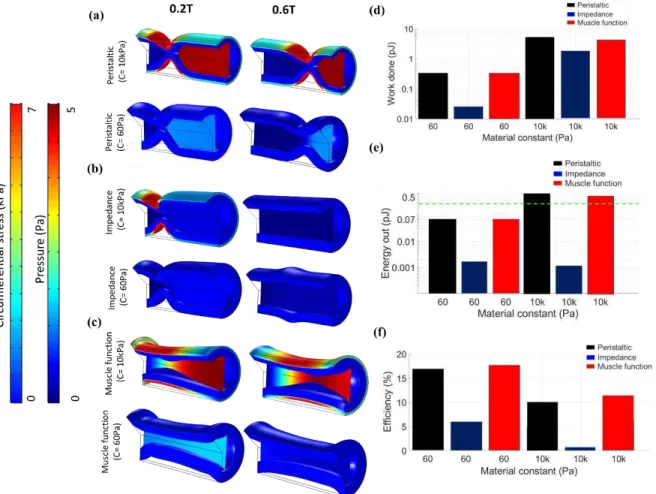
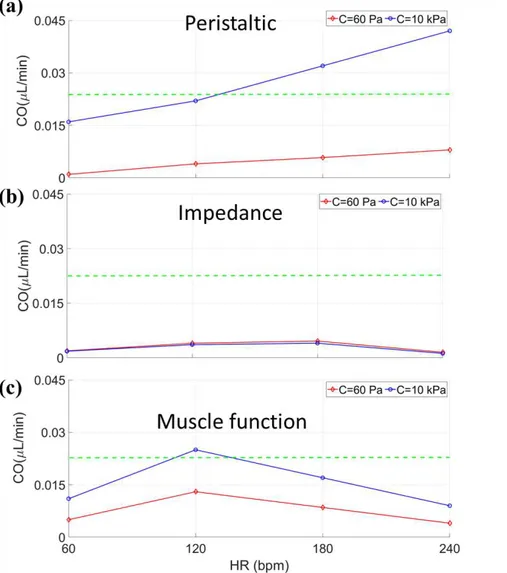
properties as the cardiac jelly. Arrows show the contraction of the myocardium ... 20 Figure 2.2. Contraction motion for each pumping function (a) peristaltic, (b) impedance, and (c) muscle function. Numbers 1-3 shows the contraction motion in time along the heart with 1 being the start of contraction and 3 being the end of contraction. The active region in each pumping function is shown with yellow color on the wall. ... 20 Figure 2.3. Heart wall motion (myocardium and cardiac jelly) during one cardiac cycle for an (a) experiment, as well as for the stiff model (E=10 kPa) using (b) peristaltic, (c) impedance, and (d) muscle functions with a comparison to a model of lower material constant (60 Pa) using (e) peristaltic, (f) impedance, and (g) muscle functions. Flow direction is shown by an arrow and the dashed red line depicts the inlet to the heart, where contractions begin. The active region in each pumping function is shown with yellow highlight for each pumping function. Axial velocity is also compared between the experimental results at the inlet (dashed red line) relative to simulation results for (h) peristaltic, (i) impedance, and (j) muscle functions ... 23 Figure 2. 4. Systolic pressure comparison between the material constant of 60 Pa (red line) and 10 kPa (blue line) in (a) peristaltic, (b) impedance, and (c) muscle function pumping functions with respect to time normalized by the period of a complete cardiac cycle. The green dashed line shows the reported systolic pressure from the literature (4 Pa) ... 27 Figure 2.5. Solid circumferential stress and fluid pressure contours plotted on an axial slice at two time points during the cardiac cycle for 60 Pa and 10 kPa pertaining to (a) peristaltic, (b) impedance, and (c) muscle functions. (d) Work done (log scale) by each cardiomyocyte for each pumping function for the material constant of 60 Pa and 10 kPa. (e) Energy out (log scale) from the heart for each pumping function for material constant of 60 Pa and 10 kPa. The experimental value of the energy out from the zebrafish heart at this stage is shown by the green dashed line comes from the literature. (f) efficiency of each pumping function for material constants of 60 Pa and 10 kPa. ... 29 Figure 2.6. Cardiac output relative to heart rate (HR) for myocardial mechanical properties of 60 Pa (red line) and 10kPa (blue line) in (a) peristaltic, (b) impedance, and (c) muscle function
pumping functions. The green line shows the cardiac output coming from the experiment (experimental value for CO is 0.02 µL/min). ... 31 Figure 3.1. Computational Fluid Dynamics of three aortic valve models. Pathlines axial velocity (m/s), (a) Healthy Aortic Model (b) Case 1: Stenosis model (valve is 55% open) (c) Case 2: Severe aortic stenosis mode: (valve is 37% open). Elongational rate (ε̇) (d) Healthy Aortic Model (e) Case 1 (f) Case 2. Shear Rate (γ̇) (g) Healthy Aortic Model, (h) Case 1, (i) Case 2. Shear Rate (γ̇) comparison (j) between case2, case1 and healthy on the leaflet and from leaflet to the outlet. Elongational rate (ε̇) comparison (k) between case2, case1 and healthy on the centerline. ... 48 Figure 3.2. Microfluidic device designs and computational fluidic dynamics of the flow through the microfluidic channels. (a) Graphical representation of the 90 degree constriction (b) Graphical representation of the curved geometry described by hyperbolic function (c) Particle velocity through the 90 degree channel (stenosis) (d) Particle Velocity though the hyperbolic channel (e) Shear Rate (𝛾̇) comparison in hyperbolic channel for different flowrates along the wall (f) Shear Rate (𝛾̇) comparison in 90 degree channel for different flowrates along the wall (g) Elongational rate (𝜀̇) comparison in hyperbolic channel for different flowrates on the centerline (h) Elongational rate (𝜀̇) comparison in 90 degree channel for different flowrates on the centerline ... 50 Figure 3.3. Comparison between Aortic valve models and Microfluidic Devices. (a) % Particle exposed to each Elongational rate (𝜀̇) in the severe AS (Case 2) compared to the 90-degree channel (inlet flow rate: 250 µl/min) and Hyperbolic Channel (inlet flow rate: 250 µl/min). (b) % Particle exposed to each Shear Rate (𝛾̇) in the severe AS (Case 2) compared to the 90-degree channel (inlet flow rate: 250 µl/min) and Hyperbolic Channel (inlet flow rate: 250 µl/min. ... 52 Figure 3.4: Normalized (velocity difference in the gap/gap width) strain rate (𝛾) for (a) 10 rad/s, (b) 100 rad/s, and (c) 450 rad/s. (d) Max shear stress at the tip of the blade and the gap between the blade and the cup for different rotating speeds, (e) Kolmogorov length scale for rotating speed 450 rad/s. ... 53 Figure 3.5: Effect of Elongational flow on VWF cleavage by ADAMTS13, (a) vane rheometer multimer analysis of samples exposed to CTRL: Unsheared sample, Laminar sample, Transitional sample, and Turbulent conditions for 30 minutes (b) vane rheometer multimer analysis of blood samples tested. 1: Laminar flow, 2: Transitional flow, 3: Turbulent conditions, (c) microchannels representative Images of Multimer Analysis ... 54 Figure 3.6. Vortex Flow CFD Model (a) Validation of CFD with images collected with a high-speed camera (b) Shear rate for each setting and location within the well (c) Wall shear stress for each setting and location within the well ... 57 Figure 3.7: Kolmogorov length scale for (a) settings 7 (148 rad/s), and (b) settings 4.5 (112 rad/s) ... 58
Figure 3.8. Force applied to VWF in laminar flow for a Deborah number much smaller than one ... 62 Figure 3.9. Force applied to VWF in laminar flow when the Deborah Number is much larger than one. ... 63 Figure 3.10. Force applied to VWF in the turbulent flow for different VWF contour length and spatial scale of (a) largest length scale r ~O(𝑑), (b) the inertial range (𝜂< r< d), the critical force for unfolding is in the range of 10-22 pN (c) the smallest length scale r ~O(𝜂).
... 65 Fig. 3.11: Hypothetical drawing of the VWF stretch and cleavage in (a) laminar flow (b) turbulent flow. ... 66 Figure 4.1: Experimental setup and the heart assist tube (HAT) drawing. (a) HAT working principle in diastole (b) HAT working principle in systole (c) Flow loop parts, Bulb pump is the left heart simulator (LHS). DAQ is data Acquisition, control box is for controlling the timing of the negative and positive pressure, resistance valve is for applying resistance to the flow, flow probe is providing the flowrate data and pressure tap is for measuring the flow pressure. Several valves, named A-D are used to simulate different attachment configurations. ... 74 Figure 4.2: The flow rate, aortic pressure, and ventricular pressure from the LHS for (a) healthy and (b) failing heart. T is one period of a cardiac cycle. Results are averaged over 6 cardiac cycle and shown for two periods. Curves are representative. ... 76 Figure 4.3. Pressure and flow rate of the failing heart assisted with the heart assist tube (a) when the HAT is connected ventricle (b) when the HAT is connected to the atrium. There is no phase difference between the failing heart and the HAT. The systolic time is 0.3s and the heart rate is 60 beat per minute heart rate. ... 77 Figure 4.4. The effect of phase shift when the HAT is connected to the ventricle and atrium for (a) failing heart mean flowrate to the base flow rate, (b) HAT mean flowrate to the base flow (c) total flowrate to the base flow, (d) HAT mean pressure to the base pressure. π is completely out of phase and 0 is in phase. The FH pressure and flowrate with no assistance is called the base pressure and the base flow rate. The physiological value for a healthy adult heart is shown in green. ... 79 Figure 4.5. The effect of systolic time of the HAT on the flow rate and pressure when HAT is connected to atrium and ventricle (a) FH mean flow rate to the base flowrate (b) HAT mean flow rate to the base flowrate (c) Total mean flowrate to the base pressure (d) HAT mean pressure to the base pressure . The FH pressure and flowrate with no assistance are called the base pressure and the base flow rate respectively. ... 80 Figure 4.6. The effect of the (a) phase shift and (b) systolic time on the work done by the FH to the base work. The base work is the work done by the FH with no assistant. ... 81
Figure 4.7. Simulation results in the pump during the systole. The dimensions are based on the HAT used in the experiment. ... 82
CHAPTER 1: HEART ASSISTANT PUMPS BACKGROUND 1.1. INTRODUCTION
Cardiovascular disease has remained the leading cause of death for over a century in the United States [1,2]. One result has been an increasing number of ventricular assist devices (VAD)s being utilized to treat patients with various forms of heart failure, affecting 23 million people worldwide [3,4]. There are 4 classes of the heart failure which are mostly defined by patient ability to do physical activities. Ejection fraction refers to the amount of blood being pumped out of the left ventricle each time it contracts, can be used to quantify severity of heart failure. In the first class of heart failure there is no limitation of physical activity. In the second class of heart failure there is slight limitation of physical activity and the patient has significant limitation in physical activities in the third class. The patient in the fourth stage of heart failure is unable to carry on any physical activity without discomfort and the ejection [5]. The ejection fraction varies for the patients with heart failure. Patient with ejection fraction smaller than 20% and systolic blood pressure <80 mmHg needs a heart transplant, which is the primary solution for many of these patients [6]. However, fewer than 3820 heart transplants are performed in the world each year due to an insufficient number of available viable hearts, despite a much larger need [7,8]. Due to the need for an alternative, VADs were developed as mechanical pumps that enhance or replace the function of the ventricle. Continuous-flow VADs are the most commonly used and consist of a driveline connected through the skin of a patient to control a mechanical impeller rotating inside a housing to pump blood (Fig.1.1). Despite substantial improvements in VADs (especially durability), a larger application of the technology has been limited due to clinically significant adverse events that include bleeding and thrombosis issues [6,9–13].
Figure 1.1. The LVAD parts, 1: pump, 2: outflow cannula, 3: driveline, 4: controller, 5: batteries
1.2. LEFT VENTRICULAR ASSIST DEVICE HISTORY
To begin, there are three generations of the left ventricular assist devices. The first generation was the initial development of ventricular assist devices. This primary development was initiated after the concepts of the total artificial heart were not successful [12]. For example, the JARVIK-7 TAH, the world’s first permanent artificial heart, was implanted into the body of Dr. Barney Clark on December 2, 1982. Although this was a revolutionary device made of aluminum and polyurethane, the device supported the patient for only 112 days [14]. Furthermore, the amount of total artificial hearts in mechanical assist devices is under 1% [10]. The VADs were electrically or pneumatically driven membrane pumps. They created pulsatile flow while incorporating artificial heart valves for the inlet and outlet. The pumps were connected to the cannulas of the heart serving as a left, right, or biventricular device. It is important to note that the first-generation systems were designed solely for bridge to transplant therapy. Because these were the first-generation systems, there were some disadvantageous aspects of these devices that
included more noise produced, high infection rate of the cannulas, malfunctions created by tears in the membrane, large sizes of the devices, and deterioration of the heart valves. The most significant systems conceived in the first generation were the Berlin Heart EXCOR, Thoratec PVAD, and Thoratec XVE [12]. There were some disadvantageous aspects of these devices such as infections around the areas of cannula implantation [13]; poor eating habits due to stomach compression that resulted from having the LVAD [15]; thrombosis and bleeding was also reported among patients [16]. Thirdly, they are also prone to mechanical malfunctioning due to deterioration of the parts of LVAD such as the membrane or the valves; these could sometimes lead to fatal complications [12].
The second generation of devices progressed in the 1990’s. Improvements to the size, susceptibility to infection, and reduction in noise improved the patients’ quality of life. These devices were purely used as LVADs rather than BIVADs and LVADs. The most significant device created during this generation was the HeartMate II.
Unlike the first generation VADs, the HeartMate II LVAD is an axial-flow rotary VAD with a blood pump, percutaneous lead, external power source, and system driver. This pump, specifically a univentricular device, is implanted between the left ventricle and the ascending aorta and is designed for long term use [17]. The system can create flow rates up to 10 L per minute. The device works in a fixed speed mode, so it does not automatically vary depending on the blood flow of the individual. Material wise, the internal surfaces including the rotor, inlet stator, outlet stator, and thin-walled duct are smooth polished titanium. A textured titanium microsphere surface covers the sealed inflow conduit and outflow elbow [18]. When the system was introduced to the public and used in heart failure patients, studies showed that there was a significantly lower postoperative mortality rate and lower incidence of adverse events. At the time, the device as a
whole was smaller than previous VADs and reduced postoperative bleeding and infection rate. There were issues and negatives to the device. Patients using the device required anticoagulation therapy; there were concerns about loading and unloading of the left ventricle; and, most significantly, there were increased incidents with gastrointestinal (GI) bleeding in patients [19].
The third generation of LVADs were even smaller in size. During this generation, several devices rose to prominence including the HeartWare LVAD and HeartMate 3. These systems utilized the centrifugal continuous flow design. They have been engineered for even longer durability (5 to 10 years), a more compact shape, easier surgical placement, and lower rates of hemolysis and thrombosis [12].
A study performed in 2017, two years after the HeartMate 3 received its CE mark, showed the effectiveness of the device six months after implantation. According to the study, the 6-month survival after the implantation was about 85.2% while showing 0% stroke, and 0% pump thrombosis rates after six months [20]. According to a separate study that followed 44 patients with the HeartMate 3 for two years, 80% of the patients were readmitted at least one time over the two-year study. Over the two-year time period, there were a total of 104 readmissions from the 80% of patients. About 79% of the 104 readmission events were for adverse events. Bleeding and infection were the two major adverse events [21].
HeartWare, DuraHeart and HeartMate III are emerging devices based on these principles. Although clinical experience with these pumps are just getting under way, early results show improvement in patients’ health [13,17,18,21]. The most recent studies show that Heartmate 3 is still suffering from pump thrombosis, GI bleeding and driveline infection [22].
The pump inlet is inserted into the apex of the left ventricle, and the outflow cannula, connected to the pump, is anastomosed to the ascending aorta. Oxygen enriched blood returns from the lungs to the left side of the heart and exits through the left ventricular apex to the pump. Blood is then actively pumped into the ascending aorta. The pumping chamber is placed within the abdominal wall or peritoneal cavity. A percutaneous drive line carries the electrical cable to the battery packs and electronic controls, which are worn on a shoulder holster and belt,
respectively.
1.2.2 LVAD CURRENT PROBLEMS
Clinical observations showed that the continuous flow pumps (second and third generations) are associated with a much higher incidence of gastrointestinal bleeding (the incidence is around 40%) compared with the earlier pulsatile LVADs where the incidence was ≈10%), and patients are 4.5 to 10 times more likely to experience gastrointestinal bleeding depending on the series. Moreover, continuous, non-pulsatile flow of blood through the vasculature differs from the normal physiologic state, with significant pathophysiologic implications. Moreover, the reduced pulsatility produced by a continuous flow LVAD implantation induced severe periarteritis in the kidneys and remodeling of vasculature [23]. Therefore, it is important to look into the pulsatility timing that could be used in any pulsatile device such as LVADs.
Nonsurgical bleeding, especially in the gastrointestinal tract, is one of the most common complications with patients receiving VAD. Clinicians balance the anticoagulant therapy to prevent thromboembolic events without promoting bleeding [24–26]. High non-physiological shear stress and reduced pulse pressure may be involved in increased bleeding risk [27]. Fast
Pa and can even exceed 150 Pa [28,29]. Comparatively, the highest physiological shear stress is 12 Pa. High shear stress can lead to acquired von Willebrand Syndrome (aVWS) – a loss of high molecular weight von Willebrand Factor (VWF) multimers, which occurred in all patients receiving left VADs in at least one study [19,30]. Reduction in platelet aggregation for patients with a continuous flow VAD is another adverse effect of high shear stress [19,31]. As opposed to directly effecting the cells and proteins involved in hemostasis, lack of pulse pressure in these VADs, specifically, can lead to arterial remodeling in response to altered mechanical stress [26,32]. Overall, the mechanism for bleeding can be multifactorial and remains unclear, yet what is clear is that non-physiological shear stress in VADs, potentially combined with continuous flow leads to bleeding complications [19,26,29–31]. Approximately 40% to 50% of VADs patients have some form of infection, and the associated mortality is approximately 50%. Infection is the leading cause of death for VADs patients with end-stage heart failure. Although in commercially available VADs the pumping chambers are implanted in subcutaneous, pre-peritoneal, or intra-peritoneal positions, they are connected via cables to electrical power and control packs. The exit sites through the skin for these connections have been a known source of infection. By following percutaneous tubes into the subcutaneous tissues, infections can appear and may then continue to the pump site, resulting to chronic infection. This may lead to infection of the implanted parts and possibly sepsis. This problem will be solved if all the parts of the VADs machine are implanted inside the body which is not possible with the current VADs. This problem will be solved with our fully implantable heart assistant sleeve.
In addition to infection, thromboembolic complications are another major concern for VADs. Thrombus formation is highly related to the blood-material surface interactions and hemodynamics [33]. It occurs as an undesired hemostatic response. High shear stress and shear
gradients are reported to promote rapid thrombus growth, along with hemolysis and VWF self-association [33–39]. VWF is a key protein for platelet capture at high shear stress. Although recent advances in continuous flow pumps have increased the probability of survival, the number of patients experiencing device thrombosis or ischemic stroke remain high for continuous flow VADs [40,41].
1.2.3 LVAD STATE OF ART
Although the current VADs are helping patients, developing new VADs is a hot trend in the medical device field. Soft robotics can be used to create implantable sleeves that are able to provide circulatory support for patients with heart failure. By using soft robotics as circulatory support, cardiac function can be closely replicated rather than disrupted from something such as a continuous flow pump [42]. These sleeves are also non-blood contacting which gives it an advantage over traditional VADs as there is no longer the risk of hemolysis from the pump itself. The heart achieves its complex motion through the muscle layers being arranged both helically and circumferentially. There is a transcutaneous drive line for power which increased the risk of infection. The biggest complication with these sleeves is injuring and deforming the heart tissues and increase the risk of infection. This design is not commercially available.
The other invention is the C-Pulse system, a treatment option under study, designed for patients with moderate to severe heart failure in order to assist the heart to pump blood rather than replace the heart function like VADs do, and it is also designed to be disconnected for short periods of time for any number of possible reasons [43]. The C-Pulse is a system that consists of a polyurethane balloon and polyester wrap that is fitted around the aorta. The balloon is a counterpulsation device as it deflates prior to systole, thus reducing afterload, and it reinflates
been successful to help patients with severe heart failure. The effect of the contracting the aorta on its structure is still unknown. The device is also pneumatic and there is drive line infection risk like any other heart assistant device.
Corwave LVAD is another new developed LVAD. It is designed to deliver gentle oscillation of a membrane to propel blood based on the wave motion of a swimming fish [44], and this device still utilizes a transcutaneous drive line for power. This LVAD has been tested in both blood analogues and actual blood in flow loops, as well as being implanted in a total of 25 sheep. The results of the tests showed the pump can reliably produce over 6 L/min of blood flow (average of 5-6 L/min [45]) with maximum shear rates that are lower than those found in LVADs that use rotary pumps. As this system is not fully implantable, the infection risk is still high. As the first human implant is going to be in 2020, there is not enough data related to the device complications.
1.3 CONCLUSION
Although mechanical circulatory support saved many lives during the last decade, clinical observations have shown that the continuous flow pumps are associated with a much higher incidence of gastrointestinal bleeding, myocardial perfusion, kidney problems, among others, compared with the earlier generation pulsatile pumps. Therefore, designing a pump which can produce the sufficient pulsatile flow and pressure can be a significant step toward heart assist devices development. The zebrafish embryonic tubular heart provides enough flow and pressure without causing any complications. Therefore, we have studied the pumping mechanism in tubular stages in chapter 2. To have a better understanding of the bleeding complications, we have studied the effects of the flow mechanical forces on bleeding disorders in chapter 3. Our findings provide a new insight in VWF cleavage and consequently bleeding disorders.
In an attempt to take the best features of continuous and pulsatile pumps, we created a pump that can fully supplement a failing heart. The pump has been tested in a left heart simulator system and the results are presented in chapter 4. Finally, in chapter 5 we discuss the overall conclusion/summary for all chapters and discusses future directions.
1.4 REFERNCES:
1. Englert, J.A.; Davis, J.A.; Krim, S.R. Mechanical Circulatory Support for the Failing Heart: Continuous-Flow Left Ventricular Assist Devices. Ochsner Journal 2016, 16, 263–269. 2. Reddy, K.S. Global Perspective on Cardiovascular Disease. Evidence-Based Cardiology
2003, 91102.
3. Shaffer, F.; McCraty, R.; Zerr, C.L. A Healthy Heart Is Not a Metronome: An Integrative Review of the Heart’s Anatomy and Heart Rate Variability. Frontiers in psychology 2014, 5, 1040.
4. Clawson, B.J. Incidence of Types of Heart Disease among 30,265 Autopsies, with Special Reference to Age and Sex. American Heart Journal 1941, 22, 607–624.
5. Caraballo, C.; Desai, N.R.; Mulder, H.; Alhanti, B.; Wilson, F.P.; Fiuzat, M.; Felker, G.M.; Piña, I.L.; O’Connor, C.M.; Lindenfeld, J. Clinical Implications of the New York Heart Association Classification. Journal of the American Heart Association 2019, 8, e014240. 6. Lund, L.H.; Matthews, J.; Aaronson, K. Patient Selection for Left Ventricular Assist
Devices. European journal of heart failure 2010, 12, 434–443.
7. Flaherty, M.P.; Moses, J.W.; Westenfeld, R.; Palacios, I.; O’Neill, W.W.; Schreiber, T.L.; Lim, M.J.; Kaki, A.; Ghiu, I.; Mehran, R. Impella Support and Acute Kidney Injury during High-Risk Percutaneous Coronary Intervention: The Global CVAD Renal Protection Study. Catheterization and Cardiovascular Interventions 2020, 95, 1111–1121.
8. Kannel, W.B. Hazards, Risks, and Threats of Heart Disease from the Early Stages to Symptomatic Coronary Heart Disease and Cardiac Failure. Cardiovascular drugs and therapy 1997, 11, 199–212.
9. Azevedo, A.; Bettencourt, P.; Alvelos, M.; Martins, E.; Abreu-Lima, C.; Hense, H.-W.; Barros, H. Health-Related Quality of Life and Stages of Heart Failure. International journal of cardiology 2008, 129, 238–244.
10. Lund, L.H.; Khush, K.K.; Cherikh, W.S.; Goldfarb, S.; Kucheryavaya, A.Y.; Levvey, B.J.; Meiser, B.; Rossano, J.W.; Chambers, D.C.; Yusen, R.D. The Registry of the International Society for Heart and Lung Transplantation: Thirty-Fourth Adult Heart Transplantation Report—2017; Focus Theme: Allograft Ischemic Time. The Journal of Heart and Lung Transplantation 2017, 36, 1037–1046.
11. Jhun, C.-S.; Reibson, J.D.; Cysyk, J.P. Effective Ventricular Unloading by Left Ventricular Assist Device Varies with Stage of Heart Failure: Cardiac Simulator Study. Asaio Journal 2011, 57, 407–413.
12. Prinzing, A.; Herold, U.; Berkefeld, A.; Krane, M.; Lange, R.; Voss, B. Left Ventricular Assist Devices—Current State and Perspectives. Journal of thoracic disease 2016, 8, E660. 13. Sousa Casasnovas, I.; Díez Villanueva, P.; Díez del Hoyo, F.; Ruiz Fernández, M.;
González Pinto, Á.; Fernández-Avilés, F. Two Different Sites of Membrane Rupture in the Berlin-Heart EXCOR Ventricular Assist Device. Revista Española de Cardiología 2016, 69, 525–527.
14. DeVries, W.C.; Anderson, J.L.; Joyce, L.D.; Anderson, F.L.; Hammond, E.H.; Jarvik, R.K.; Kolff, W.J. Clinical Use of the Total Artificial Heart. New England Journal of Medicine 1984, 310, 273–278.
15. Association, A.H. The Past, Present and Future of the Device Keeping Alive Carew Thousands of HF Patients. American heart association news 2016.
16. Rodriguez, L.E.; Suarez, E.E.; Loebe, M.; Bruckner, B.A. Ventricular Assist Devices (VAD) Therapy: New Technology, New Hope? Methodist DeBakey cardiovascular journal 2013, 9, 32.
17. Griffith, B.P.; Kormos, R.L.; Borovetz, H.S.; Litwak, K.; Antaki, J.F.; Poirier, V.L.; Butler, K.C. HeartMate II Left Ventricular Assist System: From Concept to First Clinical Use. The Annals of thoracic surgery 2001, 71, S116–S120.
18. Maltais, S.; Kilic, A.; Nathan, S.; Keebler, M.; Emani, S.; Ransom, J.; Katz, J.N.; Sheridan, B.; Brieke, A.; Egnaczyk, G. PREVENtion of HeartMate II Pump Thrombosis through Clinical Management: The PREVENT Multi-Center Study. The Journal of Heart and Lung Transplantation 2017, 36, 1–12.
19. Muthiah, K.; Connor, D.; Ly, K.; Gardiner, E.E.; Andrews, R.K.; Qiao, J.; Rutgers, D.; Robson, D.; Low, J.; Jarvis, S. Longitudinal Changes in Hemostatic Parameters and Reduced Pulsatility Contribute to Non-Surgical Bleeding in Patients with Centrifugal Continuous-Flow Left Ventricular Assist Devices. The Journal of Heart and Lung Transplantation 2016, 35, 743–751.
20. Hanke, J.S.; Dogan, G.; Rojas, S.V.; Zoch, A.; Feldmann, C.; Deniz, E.; Avsar, M.;
Warnecke, G.; Haverich, A.; Schmitto, J.D. First Experiences with HeartMate 3 Follow-up and Adverse Events. The Journal of thoracic and cardiovascular surgery 2017, 154, 173– 178.
21. Schmitto, J.D.; Pya, Y.; Zimpfer, D.; Krabatsch, T.; Garbade, J.; Rao, V.; Morshuis, M.; Beyersdorf, F.; Marasco, S.; Sood, P. Long-Term Evaluation of a Fully Magnetically
Levitated Circulatory Support Device for Advanced Heart Failure—Two-Year Results from the HeartMate 3 CE Mark Study. European journal of heart failure 2019, 21, 90–97.
22. Banfi, C.; Rigamonti, F.; Ahmadov, K.; Meyer, P.; Hachulla, A.-L.; Craviari, C.; Fontana, P.; Bendjelid, K.; Giraud, R. An Unusual Thrombus Location in a Heartmate 3TM Device with Fatal Outcome. Perfusion 2019, 0267659119890218.
23. Ootaki, Y.; Kamohara, K.; Akiyama, M.; Zahr, F.; Kopcak Jr, M.W.; Dessoffy, R.; Fukamachi, K. Phasic Coronary Blood Flow Pattern during a Continuous Flow Left Ventricular Assist Support. European journal of cardio-thoracic surgery 2005, 28, 711– 716.
24. Islam, S.; Cevik, C.; Madonna, R.; Frandah, W.; Islam, E.; Islam, S.; Nugent, K. Left Ventricular Assist Devices and Gastrointestinal Bleeding: A Narrative Review of Case Reports and Case Series. Clinical cardiology 2013, 36, 190–200.
25. Stern, D.R.; Kazam, J.; Edwards, P.; Maybaum, S.; Bello, R.A.; D’Alessandro, D.A.; Goldstein, D.J. Increased Incidence of Gastrointestinal Bleeding Following Implantation of the HeartMate II LVAD. Journal of cardiac surgery 2010, 25, 352–356.
26. Crow, S.; John, R.; Boyle, A.; Shumway, S.; Liao, K.; Colvin-Adams, M.; Toninato, C.; Missov, E.; Pritzker, M.; Martin, C. Gastrointestinal Bleeding Rates in Recipients of Nonpulsatile and Pulsatile Left Ventricular Assist Devices. The Journal of thoracic and cardiovascular surgery 2009, 137, 208–215.
27. Schlöglhofer, T.; Robson, D.; Bancroft, J.; Sørensen, G.; Kaufmann, F.; Sweet, L.;
Wrightson, N. International Coordinator Survey Results on the Outpatient Management of Patients with the HeartWare® Ventricular Assist System. The International journal of artificial organs 2016, 39, 553–557.
28. Fraser, K.H.; Zhang, T.; Taskin, M.E.; Griffith, B.P.; Wu, Z.J. A Quantitative Comparison of Mechanical Blood Damage Parameters in Rotary Ventricular Assist Devices: Shear
Stress, Exposure Time and Hemolysis Index. Journal of biomechanical engineering 2012, 134.
29. Thamsen, B.; Blümel, B.; Schaller, J.; Paschereit, C.O.; Affeld, K.; Goubergrits, L.; Kertzscher, U. Numerical Analysis of Blood Damage Potential of the HeartMate II and HeartWare HVAD Rotary Blood Pumps. Artificial organs 2015, 39, 651–659.
30. Tsai, H.-M.; Sussman, I.I.; Nagel, R.L. Shear Stress Enhances the Proteolysis of von Willebrand Factor in Normal Plasma. 1994.
31. Klovaite, J.; Gustafsson, F.; Mortensen, S.A.; Sander, K.; Nielsen, L.B. Severely Impaired von Willebrand Factor-Dependent Platelet Aggregation in Patients with a Continuous-Flow Left Ventricular Assist Device (HeartMate II). Journal of the American College of
Cardiology 2009, 53, 2162–2167.
32. Letsou, G.V.; Shah, N.; Gregoric, I.D.; Myers, T.J.; Delgado, R.; Frazier, O.H.
Gastrointestinal Bleeding from Arteriovenous Malformations in Patients Supported by the Jarvik 2000 Axial-Flow Left Ventricular Assist Device. The Journal of heart and lung transplantation 2005, 24, 105–109.
33. Casa, L.D.; Deaton, D.H.; Ku, D.N. Role of High Shear Rate in Thrombosis. Journal of vascular surgery 2015, 61, 1068–1080.
34. Bark, D.L.; Vahabi, H.; Bui, H.; Movafaghi, S.; Moore, B.; Kota, A.K.; Popat, K.; Dasi, L.P. Hemodynamic Performance and Thrombogenic Properties of a Superhydrophobic Bileaflet Mechanical Heart Valve. Annals of biomedical engineering 2017, 45, 452–463. 35. Colace, T.V.; Diamond, S.L. Direct Observation of von Willebrand Factor Elongation and
Fiber Formation on Collagen during Acute Whole Blood Exposure to Pathological Flow. Arteriosclerosis, thrombosis, and vascular biology 2013, 33, 105–113.
36. Nesbitt, W.S.; Westein, E.; Tovar-Lopez, F.J.; Tolouei, E.; Mitchell, A.; Fu, J.; Carberry, J.; Fouras, A.; Jackson, S.P. A Shear Gradient–Dependent Platelet Aggregation Mechanism Drives Thrombus Formation. Nature medicine 2009, 15, 665–673.
37. Zheng, X.L. ADAMTS13 and von Willebrand Factor in Thrombotic Thrombocytopenic Purpura. Annual review of medicine 2015, 66, 211–225.
38. Cowger, J.A.; Romano, M.A.; Shah, P.; Shah, N.; Mehta, V.; Haft, J.W.; Aaronson, K.D.; Pagani, F.D. Hemolysis: A Harbinger of Adverse Outcome after Left Ventricular Assist Device Implant. The Journal of heart and lung transplantation 2014, 33, 35–43.
39. Morshed, K.N.; Jr, D.B.; Forleo, M.; Dasi, L.P. Theory to Predict Shear Stress on Cells in Turbulent Blood Flow. PLOS ONE 2014, 9, e105357, doi:10.1371/journal.pone.0105357. 40. Loor, G.; Gonzalez-Stawinski, G. Pulsatile vs. Continuous Flow in Ventricular Assist
Device Therapy. Best Practice & Research Clinical Anaesthesiology 2012, 26, 105–115. 41. Starling, R.C.; Moazami, N.; Silvestry, S.C.; Ewald, G.; Rogers, J.G.; Milano, C.A.; Rame,
J.E.; Acker, M.A.; Blackstone, E.H.; Ehrlinger, J. Unexpected Abrupt Increase in Left Ventricular Assist Device Thrombosis. New England Journal of Medicine 2014, 370, 33– 40.
42. Roche, E.T.; Horvath, M.A.; Wamala, I.; Alazmani, A.; Song, S.-E.; Whyte, W.;
Machaidze, Z.; Payne, C.J.; Weaver, J.C.; Fishbein, G. Soft Robotic Sleeve Supports Heart Function. Science translational medicine 2017, 9.
43. Schulz, A.; Krabatsch, T.; Schmitto, J.D.; Hetzer, R.; Seidel, M.; Dohmen, P.M.; Hotz, H. Preliminary Results from the C-Pulse® OPTIONS HF European Multicenter Post-Market Study. Medical science monitor basic research 2016, 22, 14.
44. Chair, S.Y.; Yu, D.S.; Ng, M.T.; Wang, Q.; Cheng, H.Y.; Wong, E.M.; Sit, J.W. Evolvement of Left Ventricular Assist Device: The Implications on Heart Failure Management. Journal of geriatric cardiology: JGC 2016, 13, 425.
45. Snyder, T.; Bourquin, A.; Cornat, F.; Biasetti, J.; Botterbusch, C. Corwave LVAD Development Update. The Journal of Heart and Lung Transplantation 2019, 38, S341– S342.
CHAPTER 2: EMBRYONIC HEART PUMPING MECHANISM
2.1 INTRODUCTION
The heart is the first developing organ and functions before its own morphology is completely developed [1]. Structurally, it is tubular in shape when it begins pumping blood through the body without the benefit of valves. The heart tube consists of an inner endocardium, a middle layer of extracellular matrix (cardiac jelly) and an outer cardiomyocyte monolayer (myocardium). Different sections of the heart are activating during the cardiac cycle, unidirectional from the inlet to the outlet. Active contractile patterns of the myocardium, combined with mechanical properties, dictate the pumping behavior that drives blood flow.
Peristalsis and impedance pumping have both been introduced as potential pumping behaviors at the early stages of embryonic heart development, and neither mechanism necessitates a valve [2–9]. Peristalsis involves an actuating region that travels as a wave, thereby displacing a volume of fluid. Impedance pumping relies on pressure waves generated by periodic compression of an elastic tube at a single location in space. Pressure waves propagate along the tube’s walls, reflecting at the tube’s extremities with superposition that overall drives the flow in one major direction. An advantage of the latter is that contraction is only required a single location along the tube. However, impedance pumping is highly reliant on surrounding mechanical properties [2,5,6]. Numerical methods have been useful for investigating pumping behavior, since they enable the interrogation of parameters, like mechanical properties. Methods to study pumping come in two forms: one-way and two-way structural coupling. In one-way coupling, wall motion is fully controlled, impacting upon the surrounding fluid [9–13]. Studies that use this approach find that peristaltic pumping is capable of delivering a physiological cardiac output (CO) [9–13].
Two-way coupled Fluid-Structure Interactions (FSI), enable fluid forces to affect the surrounding solid domain [2,14,15] - such an approach is required to study impendence pumps, while remaining amenable to peristaltic pumping. Studies using two-way FSI method with a 1 Pa cardiac wall suggest that peristaltic pumping provides an insufficient CO and pressure (Kozlovsky et al. 2016). More recently, studies indicate that the heart tube may exhibit both peristaltic and impedance pumping behavior, with volume displacement-like pumping that is enhanced by pressure wave superposition, termed “biological pumping” [7]. The precise influence of mechanical properties on these models remains unclear.
Several computational studies [2,7,16–18] assume that the stiffness of the myocardium is on the order of 1 Pa. We recently discovered that mechanical behavior is better described by a Neo-Hookean model with a material constant on the order of 10 kPa, for zebrafish [19]. Furthermore, cultured cardiomyocytes function optimally, that is to say, by maximum force production, in an environment with the material constant of of 10 kPa [20–24]. Therefore, either cardiomyocytes work in a range that does not optimize their force production [22–25] or, the embryonic myocardium may be stiffer than previously considered in computational work, spurring the question of what influence the mechanical properties could have on pumping.
To determine the impact of stiffness on pumping function, we developed a FSI computational model of the embryonic zebrafish heart. An FSI technique enables two-way coupling between mechanical properties and pumping behavior. Behavior is compared with experimental measurements of blood flow through a zebrafish at 30 hours post-fertilization (hpf). We chose these two values for the material constants based on the reported values in the prior studies and the most recent findings. Moreover, we have not seen a two-way FSI study which considers the material constant in the range of 10 kPa.
2.2 METHOD
All experiments on embryonic zebrafish were approved by the IACUC at Colorado State University. Embryos were collected immediately after fertilization and incubated for 30 hours at 28˚C. Embryos were confirmed to be in the mid- to late-heart tube stage, which takes place between 24 and 30 hpf [26]. Selected embryos were dechorionated and placed in a solution of E3 embryo medium for holding. Individual embryos were moved to a coverslip and embedded in 1.5% low-melt agarose to arrest movement for imaging, performed on an inverted microscope (Olympus IX73 with 20X objective and the optical resolution of 0.37- 0.45 microns) using a high-speed camera (Photron Fastcam Mini UX100) at 1600 frames per second. 3-4 cardiac cycles were recorded, and heart function was analyzed using a spatiotemporal plot analysis, similar to what we have done previously [27]. Briefly, a reference line was created at the atrial inlet in the direction of flow (Fig. 2.1a) to calculate the speed of passing red blood cells (RBC)s. An ensemble average of velocity was taken over all cardiac cycles (3-4) for a given fish. In addition to calculating blood velocity, we quantified the relative coordinates of the endocardium by manually tracing the cells using ImageJ, where a representative zebrafish was used for comparison with simulation results [15].
A computational simulation was developed to model the zebrafish heart at 26-30 hpf based on idealized cylindrical geometry (Fig. 2.1b). A cylindrical tube provides us with the ability to use an axisymmetric simulation, which greatly reduces the otherwise expensive computational cost of an FSI simulation. This enables us to efficiently and systematically assess the variables studied in the current work. Our model consists of a two-layer wall, with 1 layer to simulate the myocardium and 1 to simulate the cardiac jelly and endocardium based on morphological data (shown in Fig 2.1b, c) [3,28][29,30]. The heart tube is assumed axisymmetric [9,17]. We used 3
core processor and the computational time for each processor is 15 to 30 minutes based on the pumping mechanism. The lumen diameter is defined as 50 m, extending to a length of 180 m, with a 12 µm thick cardiac jelly and a 3.5 µm thick myocardium, thereby matching experimental dimensions. Mechanical properties are assumed homogeneous along the entire length of the tube.
Arbitrary Lagrange Eulerian formulation in COMSOL Multiphysics (COMSOL Inc., Burlington, MA) is used to simulate fluid flow and boundary deformation. The solid extremes are fixed to have an impedance mismatch [2], an important feature for impedance pumping. A viscosity model has not been experimentally verified during early zebrafish development, but since blood at the heart tube stage involves only a dilute suspension of nucleated erythrocytes, we assumed it be Newtonian. A Lagrangian–Eulerian method with Winslow smoothing is used to solve the moving boundary in the fluid domain. We assume that solid domains can be described by a Neo-Hookean constitutive equation. Grid-independence was confirmed, with an optimum number of grid points of 15,000 for the solid domain and 55,000 for the liquid domain. No-slip boundary conditions are applied at the fluid–structure interface. Pressure at the fluid domain inlet is set to zero, simulating the venous return. The pressure at the outlet is defined from a 0D model of embryonic circulation [31] shown in Fig. 2.1c,
CdPout
dt = Qout(t) − Pout
R (1)
𝑄(𝑡) is the flowrate at the outlet of the heart tube, which depends on the specific simulation. C is compliance and R is the vascular resistance. The same values of the vascular resistance and compliance are used for all pumping functions since the vasculature should be independent of the function.
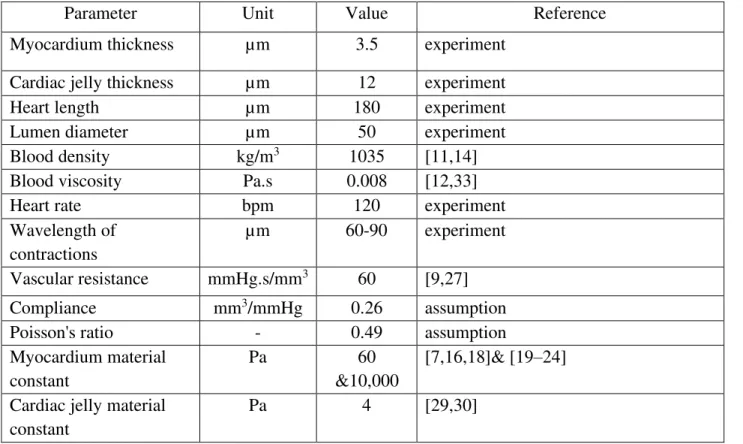
Two material constants are used to model the myocardial behavior in the study: 60 Pa based previous studies [7,16,18] and 10 kPa, where cultured cardiomyocytes produce a maximum force [20–24]. It is assumed that the material constant of cardiac jelly is 10% of the myocardium [7,17,18]. The parameter values for each case and the range of the variables are shown in Table 2.1. We chose extremely low stiffness values because the majority of prior literature [7,16,18] uses this value to investigate pumping mechanics of the embryonic heart tube. We want to compare what impact our new-found ‘stiffness’ would have on the fluid mechanics. The tubular heart pumping mechanism is possibly misjudged in several studies which considered the heart as a very elastic material. However, combined with the modulus typical of cells and what we’ve recently found; the material constant needs to be in the range of 10 kPa. To have a comparative study between the reported value and our founding, we used the mentioned two values.
Table 2.1. Parameters for numerical simulations
Parameter Unit Value Reference
Myocardium thickness µm 3.5 experiment
Cardiac jelly thickness µm 12 experiment
Heart length µm 180 experiment
Lumen diameter µm 50 experiment
Blood density kg/m3 1035 [11,14]
Blood viscosity Pa.s 0.008 [12,33]
Heart rate bpm 120 experiment
Wavelength of contractions
µm 60-90 experiment
Vascular resistance mmHg.s/mm3 60 [9,27]
Compliance mm3/mmHg 0.26 assumption
Poisson's ratio - 0.49 assumption
Myocardium material constant
Pa 60
&10,000
[7,16,18]& [19–24] Cardiac jelly material
constant
When cardiomyocytes contract, they effectively generate an axial and circumferential force along the heart tube, while passive restorative forces exist from surrounding mechanical properties. The applied force to compress the heart tube is defined as either a: peristaltic, impedance, or muscle function based on the following load distributions [7,9]. For peristaltic pumping, we use:
F𝑝(z, t) = sin2(π z
λ − π HR t), (2) where 𝜆 is the wavelength of contraction and HR is the heart rate [7], Fig. 2. 2a. z is the axis along the heart tube and t is time. The impedance pumping function used in this study is:
F𝑖(t) = sin2(π HR t𝜏 ) t1 < t < t2 Δt = (t2 − t1) 𝜏 = Δt/(T − Δt), (3)
where 𝑡1is the time that contraction engages (time 0) and 𝑡2is the time that contraction disengages (time 0.2T) based on experiments, Fig. 2.2b. T is the duration of the cardiac cycle (1/HR). This function applies along the active length of the tube near the inlet (0.2L), Fig.2.2b. The muscle function for this study is defined as:
F𝑚𝑓(z, t) = (H(t − t1) − H(t − t2)) × exp [−0.5 × ( zL − HR t)2] t1< t < t2, (4)
where H(t) is the Heaviside function, Fig. 2.2c. L is the length of the heart tube. The zebrafish cardiac muscle function is based on the calcium flux in the mice embryonic heart at the same stage [25,32–34], that was previously developed for skeletal muscle [33].
Figure 2.1. (a) Image of a 30 hpf embryonic zebrafish head and heart (enlarged inset on right). The myocardium is indicated by the dashed line. The endocardium represents the flow boundary and is indicated by the solid line. The cardiac jelly exists between these two layers. The blue arrow indicates flow direction. (b) Axisymmetric model representation of the heart tube. R is vascular resistance and C is the compliance (c) Layers of the heart tube model in a
cross-sectional view, where the endocardium is assumed to be of the same mechanical properties as the cardiac jelly. Arrows show the contraction of the myocardium.
Figure 2.2. Contraction motion for each pumping function (a) peristaltic, (b) impedance, and (c) muscle function. Numbers 1-3 shows the contraction motion in time along the heart with 1 being the start of contraction and 3 being the end of contraction. The active region in each pumping function is shown with yellow color on the wall.
We calculate the energy out of the heart by using the following equation:
Eout = ∫ P0𝑇 𝑜𝑢𝑡 (t)𝑄𝑜𝑢𝑡(𝑡)𝑑𝑡 (5)
Where P is the blood pressure and 𝑄𝑜𝑢𝑡(𝑡) is the cardiac output.
We approximate the work done in the following calculations with assuming an incompressible thin-walled cylinder:
𝑙𝑡𝑟 = 𝐿𝑇𝑅 → 𝑙𝑡 =𝐿𝑇𝜆
𝑊𝑑= 2𝜋(𝑙𝑡𝜎𝑐)(𝑅 − 𝑟) = 2𝜋𝜎𝑐(𝐿𝑇𝑅𝜆 − 𝑙𝑡𝑟) = 2𝜋𝜎𝑐𝐿𝑇𝑅 (1𝜆− 1) = 2𝜋𝜎𝑐𝑉 (1𝜆− 1) (6)
Where T, L and R are the initial thickness, length and radius which updates in each timestep, and 𝜎𝑐 is the circumferential stress in the active area. The cardiomyocyte length is assumed 20 µm[22,35].
Note that the total work done is the summation of work done from all cardiomyocytes, as opposed to the work done by a single cardiomyocyte, Eq. 6. We calculated the efficiency by dividing the values of energy out to total work done for different pumping functions and material constants.
Efficiency = Eout
Wd × 100 (7)
Based on the experimental results for the zebrafish embryonic heart at 30 hpf, the heart rate (HR) and cardiac output (CO) are 120 beats per minute (bpm) and 0.02 µL/min respectively, with deformation shown in Fig 2. 3a. Experimental Reynolds and Womersley numbers are respectively 0.11 and 0.02, demonstrating that viscous forces dominate over inertia and transient forces. Fig. 2. 3b-d shows the simulated peristaltic, impedance, and muscle functions’ wall deformation throughout one cardiac cycle (Eqn. 2-4) for the material constant of 60 Pa and 10 kPa. Peristaltic pumping (Eqn. 2) leads to a traveling wave that starts at the inlet and continues to the outlet, where it dissipates as the next wave of contraction initiates at the inlet, regardless of the stiffness (Fig.2. 3b, 4e). In impedance pumping (Eqn. 3), there is an active zone near the inlet, while the rest of the heart is passive, leading to local compression of the lumen due to contraction in the active zone (Fig. 2.3c and f). This causes downstream passive inflation due to pressure waves that generate circumferential stress (theoretically proportional to the local axially varying pressure). The pressure wave travels through the tube for 0.8T. For the 10 kPa heart, the pressure wave lasts for less than 0.4T. For the muscle function (Eqn. 4), contraction starts near the inlet, travels to the middle of the heart, and continues occluding near the outlet as a wave of relaxation begins at the inlet (Fig. 2. 3d and g), overall leading to a longer region of constriction that can create more resistance to backflow. In summary, the material constants, and pumping functions (Eq. 2-4) strongly influence the wall deformation patterns.
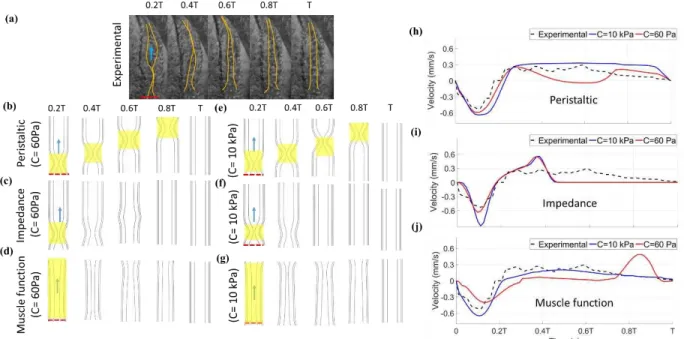
Figure 2.3. Heart wall motion (myocardium and cardiac jelly) during one cardiac cycle for an (a) experiment, as well as for the stiff model (E=10 kPa) using (b) peristaltic, (c) impedance, and (d) muscle functions with a comparison to a model of lower material constant (60 Pa) using (e) peristaltic, (f) impedance, and (g) muscle functions. Flow direction is shown by an arrow and the dashed red line depicts the inlet to the heart, where contractions begin. The active region in each pumping function is shown with yellow highlight for each pumping function. Axial velocity is also compared between the experimental results at the inlet (dashed red line) relative to simulation results for (h) peristaltic, (i) impedance, and (j) muscle functions.
To quantitatively relate wall deformation patterns to hemodynamics, representative experivamental velocity measurements at the atrial inlet are compared with the numerical results for a myocardial material constant of 60 Pa and 10 kPa (Fig. 2.3h-j). The inlet is chosen because the outlet is obscured in experiments involving zebrafish. Experimentally, there is retrograde flow at the inlet as contraction initiates in experiments since blood is initially pushed bidirectionally as the lumen begins to constrict, in a region slightly shifted from the inlet (~3µm). The retrograde flow at the inlet is seen in every simulated pumping mechanism as well. After initial reverse flow, a compressive wave travels along the channel, as fluid is forced to the outlet. Blood at the inlet begins to move forward once the myocardium begins to relax near the inlet. The relaxation wave
occurs at a rate of approximately 0.25 mm/s, roughly matching the velocity of blood cells at the center of the heart. Blood cells move in the forward direction throughout relaxation until contraction begins again at the inlet. Overall, despite initial reverse flow that dissipates quickly in the relatively large sinus venosus, the heart tube is capable of driving blood forward.
Hemodynamics from simulated pumping can provide insight into mechanical properties and active pumping functions. Peristaltic pumping for the 60 Pa wall exhibits reverse flow with a similar magnitude as the experiment, whereas the much stiffer 10 kPa heart produces a 1.5 times larger reverse velocity (Fig. 2.3h). The difference is characteristic of a “Windkessel” model as discussed by [36] Q(L, t) = Q(0, t) − CdPdt, where Q is the flow rate, l is the distance from the point of contraction to the inlet, C is compliance, t is time, and P is pressure [36]. Therefore, for an inlet with a relatively constant area, the velocity will increase as compliance decreases (elastance increases), for a given flow rate in the contractile region, Q(0,t). Essentially, a compliant vessel will absorb some fluid volume during contraction. Correspondingly, the wall expands out further due to the compliance, as seen in Table 2.2. As time continues, forward flow occurs, reaching a peak velocity of 0.3 mm/s. The heart with the material constant of 60 Pa shows a sudden drop in axial velocity, while the 10 kPa heart continues to drive flow forward with a similar peak velocity as the experiment. The velocity difference can again be attributed to a compliance difference characterized through a “Windkessel” model, where the radius of the tube expands 3 m for the more compliant heart in Table 2.2. Note that the velocity is relatively constant in the 10 kPa simulation since peristalsis in a stiff heart should lead to velocity that is proportional to the constant contraction/expansion wave speed. In the experiment, velocity follows a similar trend, but exhibits a slow decrease earlier during diastolic filling. The impedance pumping function exhibits reverse flow and then an overshoot in axial velocity before quickly dropping to a value of
0 (Fig. 2.3i) for both stiffness values. It lacks a sustained flow output. When the material constant is 60 Pa, the maximum velocity is 1.5-fold smaller than the stiffer heart as the wall expands in response to pressure, Table 2.2. It’s acknowledged that the impedance pump requires specific pumping frequencies and specific compliance mismatches at boundaries for optimum pumping, with the former being further evaluated in the next section. Fig. 2.3j shows the muscle function, which exhibits backflow due to the contraction near the inlet and a slightly over-damped response during forward flow for the heart with material constant of 10 kPa. Very little flow is seen for the 60 Pa heart, except near the start and end of contraction. In the elastic heart with the muscle function contraction pattern, the lumen stays open due to fluid pressure and the outlet pressure and flow stays low. Wall material properties appears to play a lesser role in the muscle function since radial expansion in table 2. 2 is relatively unaffected and since the majority of the heart experiences diffuse active contraction, as opposed to the small segment of active contraction in the other functions. Diffuse active contraction is the contraction expansion along the heart tube. Quantitatively, there is 26%, 29% and 13% variance (Variance% = 100% ∙ ∑|𝑉𝑎𝑙𝑢𝑒𝑃𝑀−𝑉𝑎𝑙𝑢𝑒𝐸𝑋|
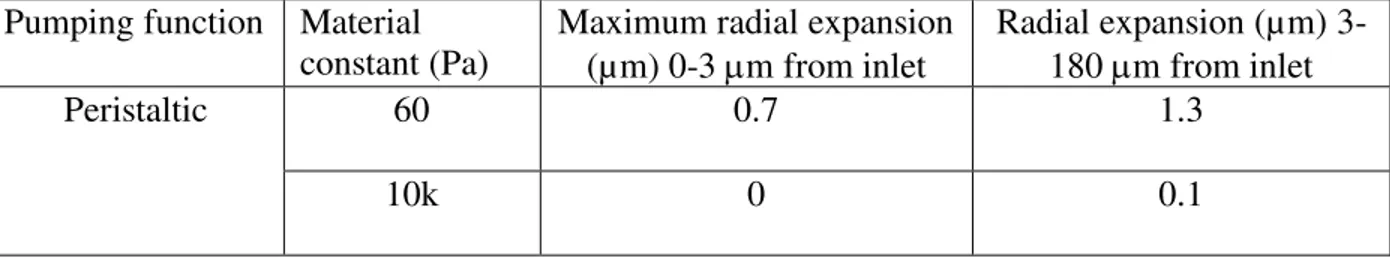
𝑉𝑎𝑙𝑢𝑒𝐸𝑋 ) respectively for the peristaltic, impedance, and muscle functions relative to the experiment for the material constant of 10 kPa, where 𝑉𝑎𝑙𝑢𝑒𝑃𝑀 is the simulated velocity and the 𝑉𝑎𝑙𝑢𝑒𝐸𝑋 is the experimental velocity. These values for the more compliant 60 Pa heart are 30%, 29% and 39%. Overall, the 10 kPa muscle function axial velocity matches best with experimental results. Table 2.2. The radial expansion during a cardiac cycle for different pumping functions
Pumping function Material
constant (Pa) Maximum radial expansion (µm) 0-3 m from inlet
Radial expansion (µm) 3-180 m from inlet
Peristaltic 60 0.7 1.3
Impedance 60 0 0.9
10k 0 0.3
Muscle function 60 0 0.1
10k 0 0
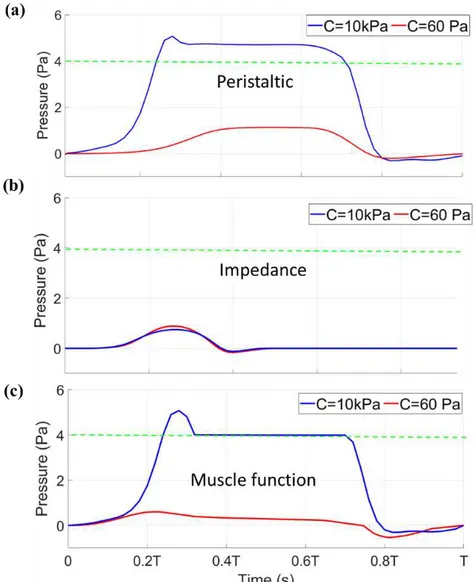
Blood pressure produced by the heart is important for driving flow throughout the circulation. Fig. 2. 5 shows the systolic blood pressure for all pumping functions at a HR of 120 bpm at the outlet. The green dashed line is the expected systolic pressure based on values reported in the literature [37–39]. The stiffer myocardium with the material constant of 10 kPa provides a sufficient systolic pressure (Fig. 2.4a, c) for peristaltic and muscle functions. Pressure is also sustained at the outlet in these two cases, which can lead to longer period of forward systolic flow due to a pressure differential existing across the heart for a longer period of time (note that pressure at the inlet is set to 0). Impedance pumping cannot provide a systolic pressure that matches previously reported values and only produces a high pressure for a very short duration <0.2T (Fig. 2.4b). In the impedance pumping mechanism, the heart stiffness is damping the waves. The stiffer heart damps the waves faster than the elastic heart. Overall, a stiff heart with sustained active contraction is necessary, seen in peristaltic and muscle function, to produce a sustained high pressure at the outlet for the current models.
Figure 2. 4. Systolic pressure comparison between the material constant of 60 Pa (red line) and 10 kPa (blue line) in (a) peristaltic, (b) impedance, and (c) muscle function pumping functions with respect to time normalized by the period of a complete cardiac cycle. The green dashed line shows the reported systolic pressure from the literature (4 Pa).
The circumferential stress on the solid wall and the fluid pressure plotted on an axial slice are shown in Fig. 2.5a-c. Contractile mechanics are largely dictated by the active and passive circumferential stress in the wall. As seen in Fig. 2.5a-c, circumferential stress is highest in regions of active contraction and in the case of impedance pumping, it remains high along the traveling pressure wave. This leads to concentrated regions of circumferential stress in peristaltic and impedance pumping compared to more diffuse circumferential stress seen in the muscle function
that actively contracts over a larger region. In addition to differences related to the pumping function, stress is higher for a stiffer wall in the simulations since active contraction is created by defining a radial contractile force in each pumping function, such that the force nearly collapses the lumen without creating contact (due to limitations in FSI simulations). Since less force is required for this purpose in the 60 Pa heart, there is less circumferential stress. Overall, an active force creates a region of high circumferential stress to deform the heart tube, thereby increasing pressure that drives fluid forward, while circumferential stress patterns change depending on the pumping function and stiffness.
The axial and circumferential wall stress is integrated through Eq. 6 to determine the approximate work done during one cardiac cycle to support peristaltic, impedance, and muscle function pumping, which is shown in Fig. 2.5(d). It is noted that work is only performed while the cardiomyocyte is actively contracting (a fraction of the overall cardiac cycle) and the effect of the axial wall stress is almost negligible. The amount of work done is higher for a stiffness of 10 kPa when compared with 60 Pa for all pumping functions due to the higher specified contractile force. Peristaltic and impedance pumping results in a shorter interval of contraction per cardiomyocyte, thereby leading to less work done per cell, when compared to the diffuse long phase of contraction per cardiomyocyte specified for the muscle function. Altogether, work done by a cardiomyocyte is lowest for the impedance function and highest for the muscle function.
Global cardiac energetics are also quantified. Fig. 2.5e shows the energy exiting the heart in each cardiac cycle. The peristaltic and muscle function pumping functions produce the most energy for the material constant of 10 kPa, leading to comparable energy seen in experiments [37]. This is due to ability of these pumping functions to provide the highest CO and pressure. The energy out from impedance pumping is much lower for both stiffness values. Energy efficiency
for peristaltic, impedance, and muscle functions when the material constant of myocardium is 10 kPa is 1.7%, 0.1%, and 0.57% respectively, while the corresponding values for the more compliant myocardium (60 Pa) are 18.5%, 1.2% and 10.3% respectively (Fig. 2.5f). Based on these results, the stiffer heart is less efficient, as cardiomyocytes overcome the wall stiffness to generate a contractile wave, yet a stiffer heart is required to obtain a physiologic energy output.
Figure 2.5. Solid circumferential stress and fluid pressure contours plotted on an axial slice at two time points during the cardiac cycle for 60 Pa and 10 kPa pertaining to (a) peristaltic, (b) impedance, and (c) muscle functions. (d) Work done (log scale) by each cardiomyocyte for each pumping function for the material constant of 60 Pa and 10 kPa. (e) Energy out (log scale) from the heart for each pumping function for material constant of 60 Pa and 10 kPa. The experimental value of the energy out from the zebrafish heart at this stage is shown by the green dashed line comes from the literature. (f)efficiency of each pumping function for material constants of 60 Pa and 10 kPa.
The HR (or pumping frequency) can impact upon the pump’s output based on both pumping functions and mechanical properties. A healthy zebrafish HR during early development ranges from 80-120 bpm at room temperature. Fig. 2.6a demonstrates that a peristaltic function with a stiff myocardium (10 kPa) can provide a CO that matches experiments, while a 60 Pa myocardium underestimates CO for HRs within this range. CO for the HRs below 60 bpm and above 240 bpm are not shown since these HRs would be abnormal for embryonic zebrafish. Note that the CO increases with HR since a peristaltic pump functions as a volume displacement pump, where faster contractile wave translation leads to faster rates of volume displacement. Impedance pumping does not provide a sufficient CO (Fig. 2.6b) regardless of stiffness for any HR based on operating conditions. Hearts with the muscle function provide the optimal CO for a HR of 120 bpm, which is a typical HR for zebrafish at the studied stage of development. The experimental CO value is just used as a benchmark to examine different pumping mechanism. HR was not varied in our experiments; it was only varied in the simulations otherwise the CO for each HR is a different value. Overall, these results demonstrate that the optimal CO can be provided when the myocardial material constant is on the order of 10 kPa, except for the impedance pump case, which cannot provide the optimal CO regardless of material constant for the current simulation.
Overall, an FSI simulation of the embryonic heart tube demonstrates that hemodynamics match between embryonic zebrafish at 30 hours postfertilization when the myocardial stiffness is on the order of 10 kPa. However, while a stiff heart produces the greatest pressure and flow, it does so at a cost in efficiency when compared to a more compliant heart. This is because contraction must overcome the stiffness of the surrounding cells. 60 Pa is commonly assumed as the embryonic myocardial stiffness in computational studies. In present simulations, 60 Pa cannot produce a sufficient CO and pressure, without requiring a higher contractile force that would lead
to compression of the cardiac jelly and endocardium – a potentially damaging scenario due to tribological interactions. Results show that the myocardium is likely stiffer in zebrafish than what has been previously modeled when evaluating pumping, which is in agreement with recent findings through measurements made during cardiac pressurization experiments, while peristaltic and muscle functions provide a sufficient hemodynamic output that matches experiments [19]. The prior studies might change if a stiffer value were used.
Figure 2.6. Cardiac output relative to heart rate (HR) for myocardial mechanical properties of 60 Pa (red line) and 10kPa (blue line) in (a) peristaltic, (b) impedance, and (c) muscle function pumping functions. The green line shows the cardiac output coming from the experiment (experimental value for CO is 0.02 µL/min).