FATIGUE BEHAVIOUR STUDY OF LASER HYBRID
WELDED ECCENTRIC FILLET JOINTS – PART I
M. M. Alam
1), Z. Barsoum
2), P. Jonsén
1), H. A. Häggblad
1), and A. F. H.
Kaplan
1)1) Luleå University of Technology, Dept. of Applied Physics and Mechanical Engineering, Sweden, www.ltu.se/tfm/produktion and
2) Royal Institute of Technology (KTH), Dept. of Aeronautical and Vehicle Engineering, Sweden
Abstract
Welded joints are a major component that is often responsible for causing a structure failure or for being the point at which fatigue cracking initiates and propagates. Despite tremendous research efforts, the understanding of fatigue behaviour is still limited, particularly for new techniques like laser hybrid welding. Beside a comprehensive state-of-the-art study, the paper presents a fatigue study of laser hybrid welded eccentric fillet joint of stainless steel of 10 mm thickness, with 5 mm displacement. Motivation is to study the influence of the surface
geometry shape on fatigue performance under a four point bending test. 13 samples were produced, measuring the toe radii and testing under constant amplitude loading with stress ratio R=0. Different techniques have been used to measure local weld geometry, like plastic replica, a 3D optical profiler and a 3D-digitizer. The influence of the local weld geometry, like the toe radii, on the stress concentration was studied by FE-analysis. Occasionally lack of fusion was observed, which was taken into account in the FE-analysis. Based on the nominal stress approach, SN-curves were designed for laser hybrid welded eccentric fillet joints. Macro hardness tests were carried out and the crack surfaces were observed in order to detect crack initiation and propagation. Correlations between the toe radii, the corresponding stress maxima and crack initiation locations were studied between the different samples and even along the welds.
Keywords: fatigue, laser hybrid welding, eccentric fillet joint, stress concentration, FEA, S-N
curve.
1. Introduction
1.1 Background and motivation
Welding strongly affects material by the process of heating and cooling, as well as by the addition of filler material, resulting in inhomogeneous material zones. As a consequence, fatigue failures appear in welded structures mostly at the welds rather than in the base metal.
For this reason, fatigue analyses are of high practical interest for all cyclic loaded welded structures, such as ships, offshore structures, cranes, bridges vehicles, railcars etc.
For several years there has been a trend towards fatigue life improvement by using advanced welding techniques i.e. laser welding, hybrid laser welding. Hitherto, all toughness improvement of fatigue strength of welds was carried out by post-weld treatments such as TIG (Tungsten Inert Gas) dressing; hammer peening, grinding, UIT (Ultrasonic Impact Treatment) and post-weld heat treatment [1–3]. However, these methods often require well-skilled workers or special equipments, and most of these methods are time-consuming processes which inevitably make construction costs higher. Kirkhope et al. [4, 5]also
discusses methods of improving the fatigue life of welded steel structures by operations such as grinding, peening, water-jet eroding and remelting. They stated that the use of special welding techniques applied as part of the welding process in lieu of post-weld operations are attractive because the associated costs are lower and the quality control is simpler. Nowadays the improvement of weld surface geometry is being achieved with advanced welding
technology i.e. hybrid laser welding. Hybrid welding creates narrow deep welds and offers the freedom to control the surface geometry. Therefore, studies of geometrical aspects on the fatigue behavior of hybrid laser welded joints are necessary. In this paper a state-of-the-art of fatigue analysis of welded joints is discussed. The main objective was on to analyze fatigue life prediction on hybrid laser welded joints. Since hybrid laser welding is a new technology and very little research has been done on this area, the literature survey had to be restricted to conventional welding process. Around 550 publications are illustrated in [6].
The fatigue failure of welded elements without crack-like defects comprises two phases: fatigue crack initiation and fatigue crack propagation [7]. To estimate fatigue crack initiation life, the weld toe stress concentration factor (SCF) is usually needed. To predict the crack propagation life, stress intensity factors (SIFs) are used when a linear elastic fracture mechanics approach is employed [8].Estimation of fatigue lives usually assumed weld toe geometry by a weld angle, and a circular arc which defines the weld toe radius. This local geometry affects the local stress concentration and, together with defects of different types, fatigue cracks form during cyclic loading and lead to a large scatter in fatigue life data. Also there is another important weld surface geometry - weld surface waviness or ripples from where cracks may initiate. Chapetti and Otegui [9] investigated the effect of toe irregularity for fatigue resistance of welds and concluded that the period of toe waves, as well as local toe geometry, strongly influences fatigue crack initiation and propagation lives.
In this paper, state-of-the-art of fatigue analysis of welded joints with a journal survey table was illustrated. Based on the knowledge from state-of-the-art, a fatigue behaviour study of laser hybrid welded joint was carried out focusing on the macro and micro weld surface geometry. Different weld surface measurement techniques have been discussed and FE analysis was carried out with the help of surface measured data. Four point bend fatigue tests were carried out on welded specimen under constant amplitude stress ratio. Subsequently, analyses of specimen fracture surfaces were carried out to identify crack initiation points and crack propagation paths.
1.2 Fundamental knowledge of fatigue analysis
Fatigue is the progressive and localized structural damage that occurs when a material is subjected to cyclic loading. The maximum stress values are less than the ultimate tensile stress limit, and may be below the yield stress limit of the material. Failure of a material due
to fatigue may be viewed on a microscopic level in three steps
(a) Crack Initiation - The initial crack occurs in this stage. The crack may be caused by
surface scratches caused by handling, or tooling of the material; threads (as in a screw or bolt); slip bands or dislocations intersecting the surface as a result of previous cyclic loading or work hardening.
(b) Crack Propagation - The crack continues to grow during this stage as a result of
continuously applied stresses.
(c)Failure - Failure occurs when the material that has not been affected by the crack cannot
withstand the applied stress. This stage happens very quickly.
Fig. 1 Crack Propagation Due to Fatigue [11]
The Fig. 1 illustrates the various ways in which cracks are initiated and the stages that occur after they start. This is extremely important since these cracks will ultimately lead to failure of the material if not detected and recognized. The material shown is pulled in tension with a cyclic stress in the y, or horizontal direction. Cracks can be initiated by several different causes. There are several methods for fatigue assessment which are frequently used in fatigue life prediction or fatigue crack propagation of welded structures and components. They can be divided as global Nominal and Geometric Stress Method and local
approaches-Effective Notch Stress Method and LEFM (Linear Elastic Fracture Mechanics). All these
methods are described briefly in this paper:
1.2.1 Fatigue mechanism
Fatigue is a mechanism of failure which involves the formation and growth of cracks under the action of repeated stresses. Ultimately, a crack may propagate to such an extent that total fracture of the member may occur. It is known that the local weld geometry, toe angle, toe radius, undercuts and cracks strongly influence the fatigue strength. The local geometry affects the local stress concentration and together with defects of different types fatigue cracks may form during cyclic loading and lead to large scatter in fatigue life [11]. At present, there are two primary approaches used for predicting fatigue life, namely, the fracture mechanics approach and the S-N curve approach. See Fig. 2. The relationship between these approaches as depicted in Fig. 2.
Fig. 2 Relationship between the characteristics S-N curve and fracture mechanics approaches
1.2.2 Nominal Stress
Nominal stress can, in simple cases, be calculated analytically using elementary theories of structural mechanics, based on linear-elastic behavior. In general the simple formula can be used W M M F nom = + σ (1) 1.2.3 Geometric Stress
The geometric stress (Fig. 3) incorporates all the stress raising effects on a structural detail, with the exception of stress concentration originating from the weld itself. In fatigue
calculation, the geometric stress must be determined in the critical direction and location on the welded joint. The approach is not appropriate for joints where the crack would develop from the root of the weld or from an internal defect. Geometric stress is calculated by taking the stress provided by the finite element analysis or calculated from the deformation measured by gauges at specified distances from the bead toe, as shown in Fig. 3b. The geometric stress at the bead toe is extrapolated from the values obtained at the measuring points using a two- or three-point formula, in accordance with the following equations
t t HS 1.67σ0.4 0.67σ1.0 σ = − (2) t t t HS 2.52σ0.4 2.24σ0.9 0.72σ1.4 σ = − + (3) (a) (b)
Fig. 3 Definition of geometric stress (a) and extrapolation points (b) [12] 1.2.4 Effective Notch Stress Method
The effective notch stress is the maximum stress measured at the notch, corresponding to a radius of 1 mm, as shown in Fig. 4, assuming linear elastic behaviour in the material. One essential benefit of this method is that the notch stress is independent of the geometry, so that a common fatigue strength curve can be used.
Fig. 4 Principle of applying 1 mm notch radius at the bead toe and root [12]
1.2.5 Linear Elastic Fracture Mechanics
The basic procedure of fracture mechanics used for fatigue crack propagation based on the following two equations
( )
m K C dN da Δ = (4)- stress intensity factor range, ∆K (in MPa m )
a a
F
K = Δσ π
Δ ( ) (5) where, a= initial crack size in the direction of the crack growth, C, m = material constant, ∆σ = applied nominal stress, F(a) = correction factor for the stress intensity factor.
In the literature some engineering values for initial crack sizes in welds in steel can be found. Radaj (13) give the value a = 0.1-0.5 mm for a line crack and for a semi elliptical crack, he give a/c = 0.1 – 0.5 for the depth/width ratio. In a literature survey by Samuelsson (14) the following typical flaw sizes were found for use in conjunction with welds. At the surface, welding causes defects with depths from 0.01 to 0.05 mm.
When the applied stress range, ∆σ, is constant during crack propagation, fatigue crack growth equation can be written as follows
[
]
m a a F C da dN π σ Δ = ) ( (6)Then, the fatigue crack propagation life, Np, from and initial crack size ai to a final crack size af can be computed as follows:
[
]
∫
∫
= Δ = f i f i a a m N N P a a F C da dN N π σ ) ( (7)The stress intensity factor range, ∆K, for a crack initiating at the weld toe may conveniently express as follows: a F F F F K = S. E. G. T.σ π Δ (8)
where, FS = correction factor for free surface, FE = correction factor for crack shape, FG = geometry correction factor accounting for the effect of stress concentration due to geometrical discontinuity, FT = correction factor for finite thickness or finite width.
1.2.6 Elastic plastic fracture mechanics
Elastic Plastic Fracture Mechanics (EPFM) assumes isotropic and elastic-plastic materials. Based on the assumption, the strain energy fields or opening displacement near the crack tips are calculated. When the energy or opening exceeds the critical value, the crack will grow. EPFM analysis is usually being done by crack tip opening displacement method or by the J-integral. This analysis is not described because it irrelevant to this paper.
1.3 State-of-the-art
The trends of fatigue analysis over last three decades are summarized in table 1. It has been found that the fatigue analysis on laser or hybrid laser welded joint is limited. Researchers are using different method to predict fatigue life but it is common to use FE software. Table 1 indicates weld toe is the critical location of weld joint. Extensive literature survey is being carried out by Jaroslav [6] and Wolfgang [54] on fatigue analysis of welded joint.
Table 1. Survey of publications on fatigue analysis
No.
Author name Country Welding ty
p es Joint typ es Critica l weld location Mathematical Models
/Techniques Simulation software Estimation
/Goal Year
15 B. Chang China S L Experimental - Hardness distribution 1999 16 P. Dong USA - L,T T FEM - Structural Stress 2001 17 El-Sayed USA S S T FEM NA Fatigue life estimation 1996 18 H.F.Henrysson Sweden S S T Coarse FEM - Fatigue life prediction 2000 19 H.Remes Finland L B R Theoretical - Fatigue strength 2003 20 S.K.Cho S. Korea L T T Thermo-elastic-plastic
FEM
AB Fatigue strength 2003 21 S.J.Maddox UK - C T Fracture mechanics - Fatigue cracks 1973 22 M.S.Alam USA - B T FEM AN Simulation-fatigue crack
growth 2004 23 L.S.Etube UK - U - Statistical - Y correction factor 2000 24 M.A.Sutton Columbia F B - FEM AN Residual stress measurements 2006 25 B.Guha India F C R Strain Energy density
approach -
Crack growth
behavior 1999 26 P.J.Haagensen Norway T L,T R Ultrasonic impact
treatment
- Introduction of fatigue test 1998
27 T.L.Teng Taiwan T B T Strain based - Prediction-fatigue crack
initiation 2003
28 X.Y.Li Finland - T T LEFM - Fatigue strength analysis 2001
29 Y. Jiang USA - - - Elastic-Plastic AB Crack growth rate and crack
direction. 2006
30 V.Caccese USA L C T Conventional FEM AN Weld geometric profile 2006
31 Chris Hsu USA L L T Cyclic stress-strain - Joint stress calculation 1991
No.
Author name Country Welding ty
p es Joint typ es Critica l weld location Mathematical Models
/Techniques Simulation software Estimation
/Goal Year
33 G.Pettersson Sweden - - - LEFM AN Non-linear effects 2004
34 P.Andersson Sweden - X - Creep ductility-based damage AB Creep crack growth investigation 1999
35 A. Assire France - X - FEM - Creep crack initiation 2000
36 F.P. Brennan UK - T - FEM - SCF calculations and analysis 2000
37 Infante, V Portugal - T T Elastic-Plastic AB Residual Stress analysis 2002
38 J.M. Ferreira Portugal A T,C T, M FEM - Fatigue life prediction 1994
39 C. H. Lee Rep. of Korea A C T Experimental - Fatigue life prediction 2008
40 B.Atzori Italy - C T LEFM - Fatigue strength analysis 1998
41 P.J.Budden UK - - C Facture mechanics BE Creep crack growth 1999
42 C.Maosheng China A B T Fracture mechanics - Crack growth & fatigue life
estimation 1990
43 H.P.Lieurade France A B,C T Fracture mechanics - Fatigue life estimation 1983
44 H.J.Schindler Switzerland - T,B R LEFM -
Fatigue endurance
analysis 2006
45 Chang K.H. Korea A B C Elastic-Plastic - Residual stress analysis 2006
46 W.Muller Germany - - C Elastic-Plastic AD Weld material properties 1988
47 K. E. Lahti Finland A F T,R Experimental - Nominal stress range 2000
LEGEND
Joint Type Welding type Critical Location Simulation Software
L : Lap S : Spot T : Toe AB : ABAQUS T : T L : Laser R : Root AN : ANSYS S : Spot F : Friction Stir C : Crack tip BS : BERSAFE B : Butt A : Arc M : Mid. of weld FR : FRANC 2D C : Cruciform T : TIG NA : NASTRAN U: Tubular H : Hybrid Laser AD : ADINA X : Cross Weld
2. Hybrid welding: experimental setup and results
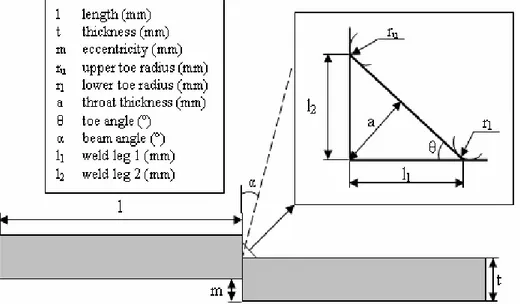
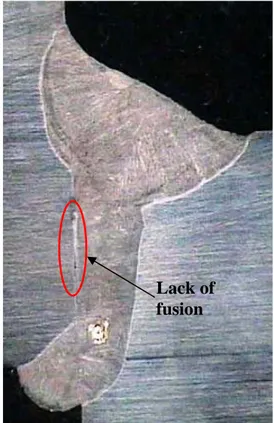
Structural stainless steel SS142333 was used throughout the experiment as base material which was specified by The Standard Commission in Sweden (SIS). The steel was 5 meter long plate with 50 mm wide and 10 mm thick. It was sliced into 50 pieces with the dimension of the base plate 100 x 50 x 10 mm and profiled by grinding and milling on the joint surface. Afterwards, the fillets were made between two base plates with 5 mm eccentricity using hybrid laser metal inert gas (L/MIG) welding process. See Fig. 5. Ytterbium Fiber Laser, beam power of 15 KW at a wavelength 1070 nm with 200 µm fiber core diameters was in operation during the experiment. ESAB ARISTO MIG equipment was used with fiber laser. Thefiller wire was AVESTA 253 MA with a diameter of 1.2 mm. During hybrid laser/MIG welding process, the laser beam was traveling in front of MIG torch by keeping 2 mm distance. Fig. 6 and 7 shows weld penetration profile top surface of eccentric fillet joint respectively where at Fig. 6(b), a side wall lack of fusion (LOF) has been found. The effective weld throat thickness is 6-7 mm and the leg length is 4mm. Hybrid laser/MIG welding process parameters are summarized in table 2. The chemical composition and mechanical properties of base metal and filler wire are presented in table 3 and 4 respectively.
After the welding had been completed, all specimens were milled about 12.5 mm on both side in the longitudinal direction of weld to avoid start and stop defects. Consequently, a small square plate with 25 x 25 x 5 mm dimensions was attached by manual arc weld under the eccentric base metal. The attachment was done on all specimens to keep stable during fatigue test. A thicker beam than base metal was specially prepared for fatigue test with two different grooves so that roller can fit in the groove. The thicker beam 54 x 25 x 25 mm in dimensions was made and hardened at about 200° C so that it was not deformed during fatigue test. The diameters of grooves are 10 mm and 5 mm respectively. See Fig. 18.
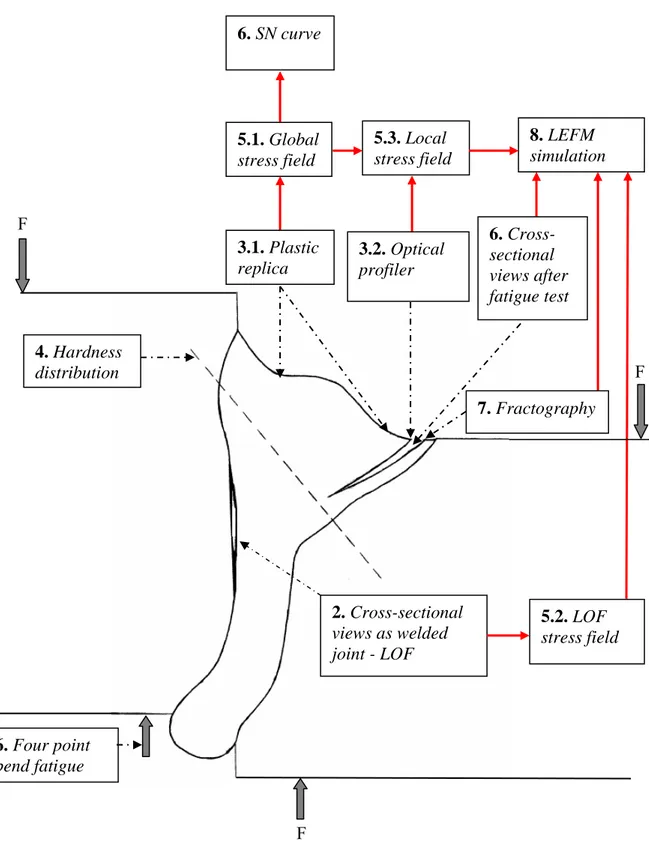
Figure 8 shows a schematic view of fatigue analysis is being done in this paper. Each square box in Fig. 8 represents chapter number and topic. Dotted line and bold solid line shows place of measurement and flow chart of fatigue study respectively.
Table 2
Welding process parameter
Parameters Process data
Welding process Hybrid laser weld
MIG current (A) 328
MIG voltage (V) 27
MIG Pulse time (ms) 2.4
MIG Frequency (Hz) 90
Wire stick out (mm) 16
Filler material, diameter 253 MA, 1.2 mm
Wire feed rate (m/min) 4.2
Shielding gas Ar
MIG Shielding gas flow (l/min) 20
Lateral beam angle (°) 10
Welding speed (m/min) 1.05
Laser power (kW) 3.25 – 3.30
Distance between wire and laser beam (mm), laser leading 2
Focal length (mm) 476
Magnification factor 3:1
Focal plane position 0
Table 3
Chemical Composition (%) for the joints partners (J) and filler wire (F)
Material C Si Mn Cr Ni P S N
JSS14233 0.05 1.0 2.0 19.0 11.0 0.045 0.030 - FAvesta 253
MA 0.07 1.6 0.6 21 10.0 - - 0.15
Table 4
Mechanical properties for the joints partners (J) and filler wire (F) Material Rp0.2(N/mm 2 ) min Rm(N/mm2) A5 (%) min Hardness, HB max JSS14233 210 490 – 690 45 200 FAvesta 253 MA 440 680 38 210
Lack of fusion
(a) (b)
Fig. 6 Weld penetration of eccentric fillet joint; (a) as welded cross-section, (b) as welded
cross section with LOF
6. SN curve 8. LEFM simulation 5.3. Local stress field 5.1. Global stress field
Fig. 8 Fatigue behavior study in schematic view (Square box shows chapter number and
corresponding topics, dotted line indicates the region of measurement, and bold solid line point out flow chart of fatigue analysis)
F 6. Cross-sectional views after fatigue test 3.1. Plastic replica F 3.2. Optical profiler 4. Hardness distribution 7. Fractography 2. Cross-sectional views as welded joint - LOF 5.2. LOF stress field 6. Four point bend fatigue F
3. Surface measuring techniques
3.1 Plastic Replica Method
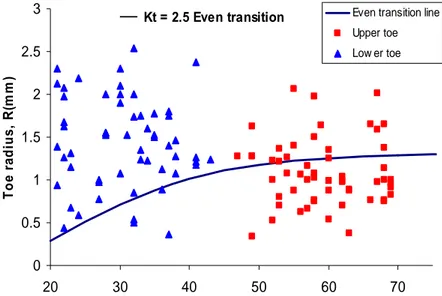
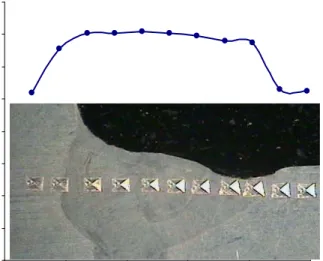
Conventionally, the local weld geometry, i.e. weld toe radius, weld angle and notch depth is measured by the plastic replica technique. In this method a silicon string is applied at the weld along the weld toe. When the silicon paste has hardened, it is separated from the specimen, and a replica of the weld along its weld features, is obtained. The replica string is then cut into thin slices, enlarges onto a paper using a photo copier or magnified with a profile projector. This makes it possible to measure the toe radius and angle by hand either on the paper or on the projected image. The measured data is then used to create a two-dimensional FE-model of the elastically loaded weld specimen to calculate the stress concentration factor. Figure 9 shows the relationship between toe radius and toe angle. In this figure all the measured values from plastic replica are plotted with Kt = 2.5, defined as stress concentration factor for an even transition [48]. It is desirable from even transition analysis that the points should be above the curve obtained for Kt= 2.5. This means that the specimens have a good local geometry and hence a low stress concentration factor.
Kt = 2.5 Even transition 0 0.5 1 1.5 2 2.5 3 20 30 40 50 60 70 Toe angle, θ(°) To e r adius , R (m m )
Even transition line Upper toe Low er toe
Fig. 9 Local weld geometry measured by plastic replica method
3.2 3D optical profiler
Wyko NT1100 was used as 3D optical profiler. It utilizes vertical scanning/white light interferometry. The technique uses the bright and dark pattern which is the result of the splitting of a light beam where one part is reflected against an internal smooth reference surface and the other off the sample. After reflection the beam recombine in the interferometer and a pattern of constructive and destructive interference occurs. The pattern is photographed by a CCD-camera analyzed by using a computer. A piezoelectric transducer moves the focus down and another picture is taken continuing until the specified scanning depth is reached. Then the pictures are analyzed in the computer which store the height data and create a three-dimensional picture. See Fig. 10. After this measurement, data can be analyzed. The software used for the analysis was Vision32. The optics in use has a large influence on the accuracy of the topometer.
(a) (b)
Fig. 10 3D optical profiler; (a) Wyko 1100NT 3D optical profiler, (b) Typical measured
surface topography
3.3 3D digitizer
ATOS III was used as 3D digitizer. This flexible optical measuring machine is based on the principle of triangulation. Projected fringe patterns are observed with two cameras. 3D coordinates for each camera pixel are calculated with high precision, a polygon mesh of the object’s surface is generated. The scanner produces up to 40 00 000 points in the measuring volume so the resolution will be about ±0.01 mm. The welded specimens were cleaned and covered with white spray with marking on the edges. Afterwards, ATOS III system was employed to measure the whole surface area of weld specimen covering the weld bead, the weld toe. The samples were digitized and the data in the form of 3d co-ordinates were
produced which is shown in Fig. 11. The three –dimensional coordinates were exported from ATOS III to CAD program NX-6 and with the help of surface stitching techniques; the whole specimen was converted into volume and stored it as parasolid file (*.x-b, *.x-t). FE-program ANSYS 11 is capable to handle parasolid file for FE analysis by giving fine mesh on the surface.
(a) (b)
Fig. 11 Scanned surface by ATOS III; (a) weld toe including surface irregularities, (b) whole
4. Hardness test
To measure the hardness of the material and the welded zone, the method of Vickers was used in this experiment. In this technique a diamond pyramid with an angle of 136° between the opposite faces is applied to be pressed with the load F into the sample. The duration of the impact is in range of 10 to 15 seconds. After removing the load the two diagonals of the indentation left in the surface of the material can be measured by using a microscope and the average of the values is calculated. Having done these measurements the Vickers hardness can be calculated with the following formula
2 854 . 1 d xF HV = (9)
or by using tables of the Vickers hardness. Figure 12shows the results of hardness
measurements of weld materials for different zones i.e. parent material, HAZ and weld filler material. The peak hardness values of 202 HV20 in the weld metal and 191 HV20 in the HAZ material were higher than the values of 165 HV20 in the parent material. This indicates that the weld metal and the HAZ of the laser hybrid joints were significantly overmatched compared to parent material.
60 80 100 120 140 160 180 200 220 0 1 2 3 4 5 Distance in mm Vi ck er s H a r d n es s (V 20 )
Fig. 12 Hardness profile over hybrid lased weld joint
5. Finite element modeling
5.1 Global geometry i.e. ideal toe
In order to study the effect of the test specimens on the stress concentration, a linear elastic FE model was setup by using ANSYS 11 FE code [49]. A 2D-model with 25000 8 nodes
quadrilateral element was used with mesh refinement around the weld toe region. The toe radius measured by plastic replica was used for each specimen to calculate Kt value. Due to extensive scatter range of lower and upper toe region; see Fig. 9, ideal toe radiuses are used to see the stress distribution over the weld surface and the effect of Kt on lower and upper toe radius according to Fig 13. The ideal toe radius was ranged from 0.75 mm to 2.5 mm.
Afterwards, Kt values were plotted against ideal toe radius and it was found that lower toe always shows maximum Kt at four point bending condition which is shown in Fig. 14. This indicates that lower toe for fillet joint under four point bend situation is critical at macro geometry level.
ltr : 0.75 mm ltr : 1.5 mm ltr : 2.0 mm ltr : 2.5 mm ltr : 2.5 mm utr : 0.75mm utr : 1.0 mm utr : 1.5 mm utr : 2.0 mm utr : 2.5 mm
Fig.13 Stress distribution field by varying global toe radius (ltr: lower toe radii, utr: upper
toe radii) Kt vs R 2 2.2 2.4 2.6 2.8 3 3.2 3.4 3.6 3.8 4 0.5 1 1.5 2 2.5 Toe radius R (mm) Kt ( 1 ) 3 Lower toe radius Upper toe radius
Fig. 14 Correlation between stress concentration factor (Kt) and toe radius
5.2 Global geometry including lack of fusion (LOF)
The effect of LOF in the eccentric fillet joint was investigated with the help of ANSYS 11 FE software [49]. In this analysis 2D linear elastic model was prepared where 22000 8-nodes quadrilateral element was used. Lower toe and upper toe were refined and radii were varied according to measured value by plastic replica. Additionally, side wall lack of fusion was introduced in this analysis and calculated Kt values for each specimen. The same model was also used to calculate the stress concentration factor by varying toe radius without side wall LOF. There was no significance difference was observed at Kt values and stress distribution over the weld bead while comparing specimens with LOF and without LOF. Figure 15 shows peak stress at lower toe even though side wall LOF exists in the model. Kt values comparison are illustrated in table 5 where maximum difference was 2.78%. Thus at four point bend compressive stress situation, side wall LOF does not contribute significantly to the fatigue strength of laser hybrid welded joint.
Fig. 15 FE model including LOF
Table 5 Kt values comparison No. 1 2 3 4 5 6 7 8 9 10 11 12 13 Kt w/o LOF 3.33 2.74 3.23 2.98 3.50 3.38 3.45 3.41 3.70 3.41 2.71 2.58 2.87 Kt with LOF 3.30 2.64 3.15 2.93 3.44 3.32 3.36 3.33 3.66 3.30 2.68 2.55 2.79 Diff (%) 0.90 2.5 2.47 1.67 1.71 1.77 2.60 2.34 1.08 2.34 1.10 1.16 2.78
5.3 Local geometry i.e. WYKO measurement
With the help of WYKO NT1100, the local geometry was measured near to the weld toe. In this investigation magnification of 10x has been used. As a result of this the smallest
measurable area was 1 mm x 0.9 mm. Height resolution was set to 1 nm. Afterwards, the measurement was taken in the middle of lower toe on a certain point. With the help of Vision32, the measured data was extracted and implemented into ANSYS 11 FE [49] software to compare between Wyco measured data and ideal toe radius. Extracted data from Vision32 were exact surface texture of weld toe at micro level. Vision32 also enables 3D view of surface topography on measured area as shown in Fig. 16(a).
FE analysis shows large geometrical topography scatter in the weld toe which contributes stress peaks. Compare to the ideal toe radii, highest stress peak are almost four times higher for the Wyko measured value as shown in Fig. 16(b-c) and 17. This comparison is also valid for weld bead where crack initiated from ripples. Kt value could even much higher at ripples due to surface irregularities. Several stress raisers were noticed at Fig. 16(c) and 17 within only 1mm2 measured areas whereas 25 x 4 mm2 will still remain. All these stress raisers would responsible for crack initiation.
(b)
(a) (c)
Fig. 16 3D optical profiler measurement;(a) Surface topology at lower toe radius (b) FE
model from ideal toe radii (c) FE model from Wyko measurement
0 1 2 3 4 5 6 7 8 0 0.2 0.4 0.6 0.8 1 X (mm) Kt Wyko Measurement 1 mm_ideal 1.5 mm_ideal 2 mm_ideal
Fig. 17 Comparison between Wyko measurements and ideal toe radius
6. Fatigue test
An experimental fatigue study was undertaken to investigate the effect of local weld profile. The fatigue test was performed using Instron 1272 (max ± 50 kN) servo hydraulic machine by keeping constant amplitude stress ratio, R = 0 under force controlled with a frequency of 45 Hz as shown in Fig. 18. Crack was started from upper toe and lower toe after fatigue test as shown in Fig. 20. Fatigue test result summary are enlisted in table 6 according to procedure described by IIW [50].Subsequently using nominal stress approach, S-N curve was developed for laser hybrid welded joint as shown in Fig. 19. Figure 19 shows the fatigue test results together with the mean SN-curve, natural mean curve and the characteristic FAT curve. These FAT curves are calculated on survival probability level P=95% (mean-2*stand. dev.) and P=50% (mean).
Table 6
Fatigue result summary
IIW norm Results
Kt – mean / standard deviation 3.09 / 0.35 LogC (m=3) – mean / standard deviation 12.71 / 0.18
m – natural slope 3.16
Mean value, ((N = 2e6, m = natural slope) 141
Mean value, Pf 50% (N = 2e6, m = 3) 137
FAT, Pf 5% (N = 2e6, m = 3) 95
F
Weld top
Fig. 18 Fatigue test arrangement
Fig. 19 Fatigue test result compiled in S-N-curves, together with mean curve (50% failure
probability) evaluated with m=3, natural mean curve with m evaluated with linear regression and the FAT (5% failure probability) curve according to IIW.
Fig. 20 Cross sectional view after fatigue test
7. Fractography
In this experiment, there are two different types of crack surfaces observed i.e. cracks in the weld bead and in the weld toe. Both cracks are originated due to undercuts according to J.L. Otegui et al. [51]. Surface ripples or waviness are considered here as undercuts. Crack
initiation points (CIP) for weld bead failure specimen are shown in Fig. 21(b) and subsequent crack propagation paths are illustrated at Fig. 21(a). At Fig. 21(a), crack propagation on different planes exactly follows surface ripples path and joins together afterwards which forms step known as ratchet marks [52]. On the crack face at Fig. 21 (b), multiple crack initiation point with ratchet mark has been seen. After a few millimeters of crack growth, when the ratchet line vanishes the individual cracks fully coalesce into a single uniform through crack across the specimen [53].
When studying the fracture of specimen at toe failure, several chevron marks are observed with ratchet lines according to Fig. 22. Usually chevron marks point to the crack origin. Even though the specimen contains many initiation sites, only a few of them become predominant during the fatigue damage process. Chevron marks are considered here main crack initiation point. Each crack plan in Fig. 22 is separated by ratchet line. When ratchet lines disappear after crack growth across the weld, the individual crack coalesces and forms a single crack plan.
Crack initiation
(a) (b)
Fig. 21 Fatigue crack from surface ripples; (a) crack propagation, (b) crack initiation
Chevron mark
Ratchet line
(a) (b)
Fig. 22 Fatigue crack weld from toe regions; (a) crack propagation, (b) crack initiation
8.
Linear elastic fracture mechanics (LEFM)
Weld defect assessment using linear elastic fracture mechanics (LEFM) crack growth analysis was carried out in order to study the effect of crack like defects that where detected in the welded joints; upper- and lower-weld toe and lack-of-fusion. The objective was to study the impact of different defect sizes, crack propagation interaction and fracture avoidance from the different failure critical positions. The total fatigue life of welds involves both a crack
initiation and crack propagation stage. For welded joints an initial crack is assumed to exist due to the presence of weld defects and the major part of the fatigue life is consumed by propagation. This is a conservative way of predicting fatigue life in some cases, especially if a (large) defect is assumed to take the form of a straight-fronted ‘line’ crack (depth/surface length a/2c = 0). However, the crack initiation phase is a negligible part of the fatigue life if accurate inspections are not utilised in the serial production of welds.
A 2D plane strain FE model was used for the LEFM calculations together with the crack simulator Franc2D [55]. The crack starting position, as shown in Fig. 23, are from the upper weld toe (A), lower weld toe (B) and lack of fusion (C). The crack propagating path is shown in Fig. 24. Of the three different cracks crack B gives the highest stress intensity and the highest possibility to propagate, see Fig. 25.
F = F = A B C
Fig. 23 Global FE mesh, 4p-bending load condition and initial crack position at weld toes
and at lack of fusion (LoF).
Fig. 24 Crack propagation path
0.00 10.00 20.00 30.00 40.00 50.00 60.00 70.00 80.00 0.00 0.50 1.00 1.50 2.00 2.50 3.00 3.50 4.00 4.50 5.00 Crack length (mm) Δ K I (M Pa √mm ) A 0.1B 0.1 C 1 A 0.5 B 0.5 C 3
9.
Discussion
In this paper fatigue behavior study of laser hybrid welded eccentric fillet joint was discussed. A journal survey table was prepared on fatigue analysis of different welded joint and
categorized them. Thus it was found from the categorization that researchers are fond of doing FE analysis for predicting fatigue life and trend of different fatigue analysis techniques over the last three decades. The surface geometry of the welded joint was mostly focused in this study since all most all cracks initiated from either weld toe or weld bead. Three different weld surface measurement techniques were discussed and analyzed the measured data with the help of FE software. It was found that local topography generates higher stress peak. To measure the hardness of the material and the welded zone, the method of Vickers was used in this experiment. Weld metal and the HAZ of the laser hybrid joints significantly overmatched and shows higher hardness compare to parent material. Four point bend fatigue test were carried out on fillet joint with 5 mm eccentricity at constant stress amplitude ratio. Based on fatigue data, S-N curve was designed as per IIW recommendation for eccentric fillet joint where the fatigue strength at Pf 5% was 95 MPa. Fatigue cracking was observed both in weld toe and weld bead. Multiple crack initiation point was observed in all specimens fracture surfaces with ratchet marks. This ratched mark step vanished when they coalescence.
At Fig. 26, the fatigue behavior study discussed in this paper is illustrated schematically. The flow chart reveals a systematic way of analyzing fatigue behavior of eccentric fillet joints. With the help of non-destructive methods i.e. plastic replica and optical profiler, the surface geometry was measured. FE analysis with the measured toe radius from plastic replica shows maximum stress at the lower toe radii. Subsequently, fatigue test data with combination of FE results, lead to plot a SN curve for eccentric fillet joints where the natural slope increases from 3.0 to 3.16. While comparing global stress with local topography, surface ripples were stress raisers. The cross section of fatigue tested samples and the crack plane were observed to identify the crack initiation and propagation path. A correlation was thus found in local stress raisers and crack initiation points. Linear elastic fracture mechanics crack growth analysis was then carried out by combining information from local stress raisers and fractography. LEFM considers all crack like defects at lower toe, upper toe and lack of fusion (LOF) and found that the lower toe has given the highest stress intensity and it propagates exactly the same as observed in the cross section of fatigue tested samples.
6. Natural slope, m increased 8. Lower toe dominates on other crack region 5.3. Surface ripples are stress raisers 5.1. More Critical: lower toe
Fig. 26 Fatigue behavior study in schematic view, commented
F F 6. Direction of fatigue crack propagation 3.1. Non destructive method 3.2. Measure 1mm2 area, height resolution 1nm 4. Overmatched weld and HAZ
metal F 7. Crack initiaion 2. Detection of lack of fusion (LOF) by viewing X-section in as welded joint 5.2. LOF less significant at compressive stress 6. Four point bend fatigue F
10. Conclusion
• Finite element modelling is a powerful method for calculating fatigue of welded joints. • ANSYS 11 is capable to handle 3D parasolid file for FE analysis by giving fine mesh
on the irregular surface ripples.
• Manifold methods provide more comprehensive information.
• Weld metal and the HAZ of the laser hybrid joints significantly overmatched compared to parent material.
• At compressive stress situation, LOF does not contribute much to the fatigue strength of laser hybrid welded joint.
• Lower toe radii are more critical compare to upper toe.
• Global toe radius does not always need to determine for fatigue analysis rather local topography radii can raise stress.
• Cracking on the weld surface exactly followed weld resolidification pattern. • Design rules for hybrid welds and for the process can be desired.
11. Acknowledgements
The authors are grateful to VINNOVA – The Swedish Innovation Agency (project HYBRIGHT, no. 27382-2) for funding the research.
12. References
[1] Miki, C, Homma, K, Tominaga, T, High strength and high performance steels and their use in bridge structures, Journal of Constructional Steel Research, p. 3 – 20 (2002).
[2] Bjorhovde, R, Development and use of high performance steel, Journal of Constructional Steel Research, p. 393–400 (2004).
[3] Dahle, T, Design fatigue strength of TIG-dressed welded joints in high-strength steels subjected to spectrum loading, International Journal of Fatigue, p. 677-681 (1998).
[4] Kirkhope, K J, Bell, R, Caron, L, Basu, R I, Ma, K T, Weld detail fatigue life improvement techniques, part 1: review, Marine Structures, Vol. 2, p. 447-474 (1999).
[5] Kirkhope, K J, Bell, R, Caron, L, Basu, R I, Ma, K T, Weld detail fatigue life
improvement techniques, part 2: application to ship structures, Marine Structures, Vol. 12, p. 477-496 (1999).
[6] Jaroslav, M, Finite element analysis and simulation of welding – an addendum: a bibliography (1996-2001), Modelling and Simulation in Materials Science and
Engineering, Vol. 10, p. 295-318 (2002).
[7] Xiulin, Z, Baotong, L, Tianxie, C, Xiaoyan, L, Chao, L, Fatigue tests and life prediction of 16 Mn steel butt welds without crack-like defect, International Journal of Fracture, Vol. 68, p. 275–85 (1994).
[8] Hou, C Y, Fatigue analysis of welded joints with the aid of real
three-dimensional weld toe geometry, International Journal of Fatigue, Vol. 29, p. 785 (2007).
[10] Chapetti, M D, Otegui, J, L, Importance of toe irregularity for fatigue resistance of automatic welds, International Journal of Fatigue, Vol. 17, p. 531-538 (1995). [11] Ellyin, F, Fatigue damage, crack growth and life prediction, ISBN 8.
[12] Pettersson G, Fatigue assessment of welded structures with non-linear boundary conditions, Licentiate Thesis, Dept. of Aeronautical and Vehicle Engineering, KTH, Sweden, ISBN 91-7283-948-1 (2004).
[13] Radaj D, Design and analysis of fatigue resistant welded structures, Abington Publishing, ISBN 1 85573 004 9 (1990).
[14] Samuelsson J, Fatigue design of vehicle components: methodology and
applications, report 88-23, Dep. Of Aeronautical Structures and Materials, The Royal Institute of Technology, Stockholm, (1998).
[15] Baohua, C, Yaown, S, Liangqing, L, Studies on the stress distribution and fatigue behaviour of weld-bonded lap shear joints, Journal of Materials Processing
Technology, p. 307-313 (2001).
[16] Dong, P, A structural stress definition and numerical implementation for fatigue analysis of welded joints, International Journal of Fatigue, Vol. 23, p. 865-876 (2001). [17] El-Sayed, M E M, Stawiarski, T, Frutiger, R, Fatigue analysis of spot-welded joints
under variable amplitude load history, Engineering Fracture Mechanics, Vol. 55, No. 3, p. 363-369 (1996).
[18] Henrysson, H F, Fatigue life predictions of spot welds using coarse FE meshes, Fatigue Fracture Engineering Material Structure, Vol. 23, pp. 737-746 (2000). [19] Remes, H, A theoretical model to predict fatigue life of laser welded joints, Ship
laboratory, Helsinki University of Technology, Finland.
[20] Cho, S K, Yang, Y S, Son, K J, Kim, J Y, Fatigue strength in laser welding of the lap joint, Finite Elements in Analysis and Design, Vol. 40, p. 1059-1070 (2004). [21] Maddox, S J, An analysis of fatigue cracks in fillet welded joints, International
Journal of Fracture, Vol. 11, No. 2, p. 221-243 (1975).
[22] Alam, M S, Wahab, M A, Modelling the fatigue crack growth and propagation life of a joint of two elastic materials using interface elements, International journals of pressure vessels and piping, Vol. 82, p. 105-113 (2005).
[23] Etube, L S, Bremen, F P, Dover, W D, A new method for predicting stress intensity factors in cracked welded tubular joints, International Journal of Fatigue, Vol. 22, p. 447-456 (2000).
[24] Sutton, M A, Reynolds, A P, Ge, Y Z, Deng, X, Limited weld residual stress measurements in fatigue crack propagation: Part II FEM based fatigue crack
propagation with complete residual stress fields, Fatigue Fracture Engineering Material Structure, Vol. 29, p. 537-545 (2006).
[25] Balasubramanian, V, Guha, B, Effect of weld size on fatigue crack growth behaviour of cruciform joints by strain energy density factor approach, Theroretical and Applied Fracture Mechanics, Vol. 31, p. 141-148, 1999. [26] Haagensen, P J, Statnikov, E S, Martinez, L L, Introductory fatigue tests on
welded joints in high strength steel and aluminium improved by various methods including ultrasonic impact treatment, IIW Doc. XIII- 1748-98.
[27] Teng, T L, Chang, P H, Effect of residual stresses in fatigue crack initiation life for butt-welded joints, Journal of Materials Processing Technology, Vol. 145, p.325-335 (2004).
[28] Li, X Y, Partanen, T, Nykänen, T, Björk, T, Finite element analysis of the effect of weld geometry and local condition on fatigue strength of lap joint, International Journal of Pressure Vessels and Pipping, Vol. 78, p. 591-597 (2001).
[29] Ding, F, Zhao, T, Jiang, Y, A study of fatigue crack growth with changing loading direction, Engineering Fracture Mechanics, Vol. 74, p. 2014-2029 (2007). [30] Caccese, V, Blomquist, P A, Berube K A, Effect of weld geometric profile on
fatigue life of cruciform welds made by laser/GMAW processes, Marine Structures, Vol. 19, p. 1-22 (2006).
[31] Hsu, C, Albright, C E, Fatigue analysis of laser welded lap joints, Engineering Fracture Mechanics Vol. 39, No. 3, p. 575-580 (1991).
[32] Barsoum, Z, Residual Stress Analysis and fatigue of Welded Structures, Licentiate Thesis, Dept. of Aeronautical and Vehicle Engineering, KTH, Sweden (2006), ISBN 91-7178-264-8.
[33] Pettersson G, Fatigue assessment of welded structures with non-linear boundary conditions, Licentiate Thesis, Dept. of Aeronautical and Vehicle Engineering, KTH, Sweden (2004), ISBN 91-7283-948-1.
[34] Andersson P, Segle P, Samuelson L Å, Numerical investigation of creep crack growth in cross-weld CT specimens. Part II: influence of specimen size, Fatigue Fract. Engng. Struct., Vol. 23, p. 533-540 (1999).
[35] Assire, A, Michel, B, Raous, M, Creep crack initiation and creep crack growth assessments in welded structures, Nuclear Engineering and Design, Vol. 206, p. 45-56 (2001).
[36] Brennan, F P, Peleties, P, Hellier, A K, Predicting weld toe stress concentration factors for T and skewed T-joint plate connections, International Journal of Fatigue, Vol. 22 p. 573-584 (2000).
[37] Infante, V, Branco, C M, Bapista, R, Gomes, E, A residual stresses and fracture mechanics analysis of welded joints repaired by hammer peening, 8th Portuguese Conference on Fracture, 2002.
[38] Ferreira, J M, Pereira, A H, Branco, C M, A fracture mechanics based fatigue life prediction for welded joints of square tubes, Thin Walled Structures, Vol. 21, p. 120 (1995).
[39] Chin, H L, Kyong, H C, Gab, C J, Chan, Y L, Effect of weld geometry on the fatigue life of non-load-carrying fillet welded cruciform joints, Engineering Failure Analysis, (2008).
[40] Atzori, B, Lazzarin, P, Tovo, R, From a local stress approach to fracture
mechanics: a comprehensive evaluation of the fatigue strength of welded joints, Fatigue Fract. Engng. Struct., Vol. 22, p. 369-381 (1998).
[41] Budden, P J, Curbishley, I, Assessment of creep crack growth in dissimilar metal welds, Nuclear Engineering and Design, Vol. 197, p. 13-23 (2000).
[42] Maosheng, C, Shan, W, Shaofu, L, Crack growth and fatigue life estimation in welded T- Tubular joints based on fracture mechanics, Proceedings of the
International Offshore Mechanics and Arctic Engineering symposium, Vol. 3, p. 358 (1990).
[43] Lieurade, H P, Application of fracture mechanics to the fatigue of welded structures, Welding in the world, Vol. 21, No. 11, p. 272-295 (1983).
[44] Schindler, H J, Martens, H J, Sönnichsen, S, A fracture mechanics approach to estimate the fatigue endurance of welded t-joints including residual stress effects, Fatigue Fract. Engng. Mater. Struct., Vol. 30, pp. 206-213 (2006).
[45] Chang, K H, Lee, C H, Residual stresses and fracture mechanics analysis of a crack
in welds of high strength steels, Engineering Fracture Mechanics, Vol. 74, Issue 6, p.
980-994 (2007).
[46] Muller, W, Veith, H, Influence of weld material properties on fracture mechanics parameters in welds analysed by FEM calculations, Int. J. Pres. Ves. & Piping, Vol. 33, p. 285-300 (1988).
[47] Lahti, K E, Hannu, H, Erkki N, Nominal stress range fatigue of stainless steel fillet welds — the effect of weld size, Journal of Constructional Steel Research, Vol. 54, p. 161-172 (2000).
[48] Ricondo, R F, Fatigue and quality analysis of cruciform joints welded with different methods, Master thesis, Department of Aeronautical and Vehicle
Engineering, The Royal Institute of Technology, Stockholm (2006). [49] ANSYS guide, ANSYS release 11. Houston : Swanson Analysis Systems.
[50] Hobbacher, A, Fatigue design of welded joints and components, IIW document XIII-2151-07 / XV-1254-07.
[51] Otegui, J L, Kerr, H W, Burns, D J, Mohaupt, U H, Fatigue crack initiation from defects at weld toes in steel, International Journal of Pressure Vessel and Piping, Vol. 38 p. 385-417 (1989).
[52] Hertzberg, R W, Deformation and fracture mechanics of engineering materials, John Wiley and Sons, INC. 4th Edition, ISBN 0-471-01214-9,USA (1996).
[53] Verreman, Y, Nie, B, Short crack growth and coalescence along the toe of a manual fillet weld, Fatigue & Fracture of Engineering Materials & Structures, Vol. 14, p. 349 (1991).
[54] Wolfgang F, Fatigue analysis of welded joints: state of development, Marine Structures, Vol. 16, p. 185-200 (2003)
![Fig. 1 Crack Propagation Due to Fatigue [11]](https://thumb-eu.123doks.com/thumbv2/5dokorg/5498911.143203/3.892.198.721.370.910/fig-crack-propagation-due-to-fatigue.webp)

![Fig. 4 Principle of applying 1 mm notch radius at the bead toe and root [12]](https://thumb-eu.123doks.com/thumbv2/5dokorg/5498911.143203/5.892.240.675.706.901/fig-principle-applying-notch-radius-bead-toe-root.webp)