ESG or Financial
Performance –
Does It Have to
Be a Choice?
MASTER THESIS
THESIS WITHIN: Business Administration Finance NUMBER OF CREDITS: 30 ECTS
PROGRAMME OF STUDY: Civilekonomprogrammet AUTHOR: Lisa Hedqvist, Amanda Larsson
TUTOR: Fredrik Hansen & Toni Duras JÖNKÖPING May 2020
A Regression Analysis of Thomson Reuters ESG scores
and Financial Performance in Sweden and the UK
Master Thesis within Business Administration - Finance
Title: ESG or Financial Performance – Does it Have to Be a Choice? – A Regression Analysis of Thomson Reuters ESG scores and Financial Performance in Sweden and the UK
Authors: Lisa Hedqvist & Amanda Larsson Tutor:
Date:
Fredrik Hansen & Toni Duras May 2020
Key terms: ESG, ESG Score, Financial Performance, Sustainable Finance, EU Policies.
Abstract
Background: The term Environmental, Social, and Governance (ESG) is a relatively new
concept within the financial industry. However, there are a couple of issues connected to the ESG score and sustainable finance. Thus, there is an ongoing conflict between creating economic value, which is the main task for managers, as well as tackling ethical issues such as ESG.
Purpose: The purpose of this report is to investigate if there is a correlation between ESG
scores and financial performance measures. The measures analysed are, Return on Assets (ROA), Retention Ratio (RET), Operating Cash-Flow (CF) and Debt-Equity (DE), for listed companies in Sweden and the UK.
Method: To see if there is a correlation between ESG and financial performance, a Pooled
OLS Regression and Fixed Effect Regression Model (FE) was used. The data was collected from the Thomson Reuters datastream, where 75 companies listed on the OMXSLCGI in Sweden and 75 companies listed on the FTSE100 in the UK, was retrieved.
Conclusion: The regression results indicated a positive correlation between CF and ESG
for both the FE regression and the Pooled OLS for the Swedish middle-ranked companies, as well as a positive correlation between DE and ESG for the lower-ranked Swedish companies. For the UK, no significant variables were found. Because of the limited significant results, this thesis found that there is yet no apparent correlation between the ESG score and financial performance based on the four years analyzed.
Acknowledgments
The authors would like to thank our tutor Fredrik Hansen and co-tutor Toni Duras, who have supported us with guidance and advice throughout the time writing this thesis. We would further like to express our gratitude towards our seminar group and fellow students for providing us with essential feedback during the writing process. Finally, we would like to thank Jönköping International Business School for making the data collection possible.
Table of Contents
1.
Introduction ... 1
1.1. Background ... 1 1.2. Problem Statement ... 4 1.3. Purpose ... 5 1.4. Research Questions ... 5 1.5. Delimitations ... 52.
Theoretical Framework ... 7
2.1. Search Strategy ... 7 2.2. Sustainable Finance ... 72.2.1. Corporate Social Responsibility ... 8
2.3. Environmental, Social and Governance (ESG) ... 8
2.3.1. Stakeholder Theory and Shareholder Theory ... 10
2.4. ESG Score ... 12
2.5. EU Policies and Regulations ... 13
2.6. Financial Measures ... 15
2.6.1. ROA ... 15
2.6.2. Operating Cash Flow ... 16
2.6.3. Retention Ratio ... 16
2.6.4. Debt-Equity Ratio ... 17
2.7. ESG and Financial Performance ... 17
3.
Methodology ... 19
3.1. Scientific Research ... 19 3.2. Data Sampling ... 20 3.3. Data Collection ... 20 3.3.1. Secondary Data ... 20 3.3.2. Procedure ... 21 3.4. Data Analysis ... 223.4.1. Multiple Linear Regression Model ... 22
3.4.2. Ordinary Least Square (OLS) ... 22
3.4.3. Fixed Effect Model ... 24
3.5. Hypotheses ... 25
3.6. Limitations ... 25
3.6.1. Reliability and Validity ... 27
4.
Empirical findings ... 28
4.1. Results ... 28 4.1.1. Descriptive Statistics ... 28 4.1.2. Regression Summary ... 29 4.1.3. OLS Regression ... 30 4.1.4. Sweden ... 30 4.1.5. United Kingdom ... 335.
Analysis & Discussion ... 36
5.1. Sweden – ESG Score and Financial Performance ... 37
5.2. UK – ESG score and Financial Performance ... 39
5.3. Theories and Policies ... 40
6.
Conclusion ... 43
6.1. Answering the Research Questions ... 43
6.2. Practical Contribution of the Study ... 44
6.3. Research Implications ... 44
6.3.1. Theoretical Implications ... 44
6.3.2. Managerial and Ethical Implications ... 45
6.4. Future Research ... 46
List of References ... 48
Appendices ... 54
Appendix 1 ... 54 Appendix 2 ... 55 Appendix 3 ... 57 Appendix 4 ... 57 Appendix 5 ... 58 Appendix 6 ... 58 Appendix 7 ... 59 Appendix 8 ... 60 Appendix 9 ... 61 Appendix 10 ... 62 Appendix 11 ... 63 Appendix 12 ... 64 Appendix 13 ... 65 Appendix 14 ... 66 Appendix 15 ... 67 Appendix 16 ... 68 Appendix 17 ... 69 Appendix 18 ... 70List of Tables
Table 1: Descriptive statistics: Summary statistics for the Swedish variables during the
period 2015-2018 ... 28
Table 2: Descriptive statistics: Summary statistics for the UK variables during the
period 2015-2018 ... 28
Table 3: Correlation Matrix: To detect multicollinearity for Sweden ... 29 Table 4: Correlation Matrix: To detect multicollinearity for the UK ... 29 Table 5: Diagnostics test for Sweden: To determine if a Pooled effect or fixed effect
model should be used ... 31
Table 6: Fixed effect model regression: Regression with robust standard errors for
Sweden during the period 2015-2018 with ESG as the dependent variable and ROA, RET, CF and DE as independent ... 31
Table 7: Combined Pooled OLS Regression: Regression for Sweden during the period
2015-2018 with ESG as the dependent variable and ROA, RET, CF and DE as independent ... 32
Table 8: Separate group regressions: Regression for Sweden during the period
2015-2018 for the separate ranking groups, high, middle and low with ESG as the dependent variable and ROA, RET, CF and DE as independent ... 33
Table 9: Diagnostics test for the UK: To determine if a Pooled effect or fixed effect
model should be used ... 34
Table 10: Fixed effect model regression: Regression with robust standard error for the
UK during the period 2015-2018 with ESG as the dependent variable and ROA, RET, CF and DE as independent ... 34 Table 11: Combined Pooled OLS Regression: Regression for Sweden during the period
2015-2018 with ESG as the dependent variable and ROA, RET, CF and DE as independent ... 35
Table 12: Separate group regressions: Regression for the UK during the period
2015-2018 for the separate ranking groups, high, middle and low with ESG as the dependent variable and ROA, RET, CF and DE as independent ... 35
Definitions
CF - Cash Flow from Operating Activities CSP - Corporate Sustainable Performance CSR - Corporate Social Responsibility DE - Debt/ Equity ratio
EBIT - Earnings Before Interest and Tax ESG - Environmental Social Governance FE - Fixed Effect Regression Model FP - Financial Performance
HLEG - High Level Expert Group KPI - Key Performance Indicators
OLS - Ordinary Least Square Regression Model RET - Retention ratio
ROA - Return on Assets
1. Introduction
______________________________________________________________________
The first chapter starts with a short introduction and background information about the topic. Chapter one continues by stating the research problem as well as the purpose of this thesis and the research questions are presented. The chapter is completed with delimitations regarding the topic.
______________________________________________________________________
The concept of sustainability is not new to the financial market; however, during recent years, it has grown in popularity and importance as the population has grown more worried about the future of this planet. Because of climate change, the relationship between sustainability and economic growth has become heavily discussed. There are previous studies that have investigated the possibility of a correlation between Environment, Social, and Governance (ESG), and financial performance. However, none of the previous studies have compared Sweden and the UK, and therefore this is an interesting topic to investigate.
1.1. Background
By the end of March 2018, the European Commission implemented an “action plan on sustainable finance” which is based on the recommendations from the High Level Expert Group (HLEG). The action plan aims to simplify and increase the understanding of the strategy to combine finance and sustainability. One of the main tasks is, therefore, to improve the transparency of companies’ ESG policies.
The Environment, which is the first component of ESG, combined with economic growth, is a hot topic in society. To prevent environmental changes, the EU members signed the Paris Agreement in 2015. After the Paris Agreement, the EU implemented new regulations during 2018 with the intention to reduce greenhouse emissions by 2030. The key targets connected to the regulations specify that the countries within the EU must cut their emissions by at least 40% compared to the levels from 1990, implement at least 32% of renewable energy and, improve the energy efficiency by 32.5% (European Commission, 2020).
Two of the issues that the Social (S) part of ESG covers are human rights and fair trade, and according to Fairtrade’s website, sustainable trade is dependent on human rights. Therefore, Fairtrade (2020) encourages companies to analyse the supply chain to ensure that human rights are respected.
The two theories connected to the final component of ESG, which is Governance (G), are the stakeholder theory and the shareholder theory. These theories imply that the managers of a company must choose between them, where the core of the shareholder theory is to create value for their shareholders. The main objective of the stakeholder theory is to create value for the employees, customers, and the shareholders. However, one problem that could pose as a threat within a company is corruption. A recent example is the money-laundering scandal related to the Swedish bank Swedbank, where the suspicions of this incident arose during the spring of 2019 (Schwartzkopf, 2019).
ESG is not only important from an ethical point of view, it is also argued to be important from an investment perspective as well. According to OECD (2017), the ESG factors have shown to be essential drivers for the risk and return of portfolios. This is confirmed in a report by Bloomberg (2018). The report states that investors have understood that ESG issues might have a material effect on industries and impact the value of their portfolios. Therefore, different agencies are calculating these scores and ranking companies according to the ESG measurement to guide both companies and investors towards more sustainable investments. Thus, there is a need for a ranking system to determine how companies work with ESG, for all actors on the market. However, the ranking system used today is somewhat confusing since the different agents use their own methodologies, which are related to cultural and ideological factors. Thus, different agents can obtain different scores, even though they must respect the same criteria (Dorfleitner et al., 2015).
To determine to what extent companies are working with ESG related risks, an ESG score is obtained. The ESG score is a way for companies to compare their sustainability performance to their competitors. The ESG scores are provided by “sustainability rating agencies,” which have been accepted as agents within the market. The sustainability
agents use different kinds of information from companies and the public to calculate ESG scores (Cui et al., 2016). A few of these rating agencies are Morgan Stanley Capital International (MSCI), RobecoSAM, Viego-EIRIS, and Thomson Reuters (Escrig-Olmedo et al., 2019).
According to Thomson Reuters (2013), the ESG Score was developed for reasonable assessments of Corporate Social Responsibility (CSR) for both investments as well as for other agents who find ESG important. They further explain that the goal of the ESG score is to increase transparency, consistency, and illegal discoveries among organizations. Even though ESG is important, one cannot escape the fact that the financial performance of a company is crucial for its survival.
To determine a company’s financial performance, its financial and non-financial measures are examined. These measures are indicators connected to financial performance and analysis in the form of assets, cash-flows, and net income, among others. It is evident that financial performance is crucial for companies' survival; however, it is argued that ESG is equally important for a company to survive in the long-run. For a company to survive, it must be accepted by society. The acceptance-need, together with the societal trends that focus on sustainability within firms, indicates that companies with a high ESG score reduce their risk. Hence, it is argued by Syed (2017) that sustainable companies have a strong financial performance in the long-run. These new demands of reducing climate change force companies to change their strategies to succeed in the long-run. However, it is challenging to build a strategy that balances environmental, social, and economic needs for both the company and society (Epstein & Roy, 2001).
The three factors within ESG are influenced in different ways in various countries, which can be observed for Sweden and the UK. One of the differences concerns the use of renewable energy1, which is one factor within the environmental aspect of ESG. Sweden uses 58.79% renewable energy, while this share only represents 33% of the total energy production in the UK (SCB, 2018; UK Government, 2018). These reports show that Sweden has a larger share of renewable energy sources of their total production. Another difference between the two countries analysed is the minimum wage rate. The Swedish
minimum wage is approximately 25,500 SEK per month (SCB, 2018), while it is £1,252.82 per month in the UK (UK Government, 2018). The UK minimum wage is correspondingly 14,2173 SEK, which indicates that wages are lower in the UK compared to Sweden. These indicators show that these two countries have different policies regarding the aspects of ESG.
1.2. Problem Statement
The increased demand for sustainable solutions and investments requires companies to adjust. At the same time, new sustainable solutions, for example, product development, change in production, increased wages, and improved working conditions, often lead to an increase in expenses. The increased expenses can have a negative impact on companies in the short-run before achieving the long-run benefits. However, there are important aspects within ESG that need to be taken into consideration since climate changes worsen, and several workers still live on minimum wages. Syed (2017) addresses this dilemma by explaining that managers are considering making ESG part of their investment process; still, it is not prioritised. Syed explains that managers’ essential tasks should be to run their business effectively and have a strong financial performance. Thus, managers must have a clear view of their goals in terms of their investment choices, and they must choose to either increase economic- or ethical value.
Therefore, this thesis will investigate if there must be a choice between ethics and value creation or if a correlation exists between a high ESG score and a strong financial performance. The measurements that will be analysed are Return on Assets (ROA), Retention ratio, Operating Cash-Flow (CF), and Debt-equity (DE). To contribute to new research, three new measures were added in addition to ROA. These measurements include different components of values within a company; hence, they provide various indications of the financial performance of a company.
Since ESG is a relatively new concept, few studies have investigated this relationship, as can be seen, previous studies have used data before 2014 (Eccles et al., 2014; Friede et al., 2015; Teti et al., 2015; Velte, 2017). Besides, these studies have been implemented
2 £7.83 * 40hours * 4weaks = £1 252.8
on larger economies such as the US and Germany. To our knowledge, a comparison between Sweden and the UK has not yet been investigated. Therefore, a study where a comparison between Sweden and the UK is conducted could contribute with new research to already existing research. This comparison is interesting because of the difference in economies and the similarities in culture. The UK is a much larger economy than Sweden (Bajpai, 2020); however, the two countries are similar in terms of culture, which contributes to an interesting comparison. Another factor that makes this comparison noteworthy is that Sweden and the UK have chosen to implement ESG differently. Thus, it could be interesting to see if this will result in different outcomes for Sweden and the UK.
1.3. Purpose
The purpose of this report is to investigate, through running a multiple linear regression, if there is a significant correlation between financial performance and the ESG score for the two countries, Sweden and the UK. Further, the differences in the countries’ regression results will be analysed.
1.4. Research Questions
RQ1: Is there a correlation between the ESG score and financial performance among
the largest companies on the Swedish stock market?
RQ2: Is there a correlation between the ESG score and financial performance for the
largest companies on the British stock market?
RQ3: Is there a difference between the different ranked groups of high, middle, and low
ESG scores?
RQ4: Is there any difference between the two countries Sweden and the UK?
1.5. Delimitations
One delimitation for this report concerns the EU policies. There have been more guidelines and policies regarding sustainable finance and the term ESG rather than
specific regulations. Since the individual countries set their own regulations, it is difficult to assess and compare the two countries based on individual regulations. Because of this factor, it could be challenging to use separate regulations as a frame of reference when interpreting and analysing the data. Therefore, in this thesis, the EU policies will be used as a frame of reference and not the individual countries’ regulations.
2. Theoretical Framework
This chapter begins with an explanation of the search strategy, followed by a review of the literature regarding sustainable finance, ESG, EU policies, and Financial performance.
2.1. Search Strategy
To gain insight into the topic of ESG, policies, and financial performance, various information was gathered through search engines as well as websites of different authorities and the EU. The different search engines used were ABI Inform, Google scholar, Web of science, and Proquest. The most commonly used search terms include ESG, sustainable finance, financial performance, and financial measures; these have been used in different combinations to find the most relevant sources for this thesis. Therefore, when determining the relevance and reliability of the articles or sources, different filters have been used, such as peer-reviewed, scholarly journals, and articles. However, since ESG is relatively new, the use of the function citations has been limited. Another aspect taken into consideration when searching for articles was the relevance in terms of how recent the literature and previous research was. The final function used to find relevant articles or other sources was to review the references in articles related to the topic.
2.2. Sustainable Finance
Sustainable finance is an important and growing subject which is stated in the EU’s action plan from 2018, where ESG is a big part of sustainable finance. Furthermore, Soppe (2004) writes that sustainable corporate finance is an approach where the social, environmental, and financial parts are combined and unified. The EU definition of sustainable development is “… the classical Brundtland version development that meets the needs of the present without compromising the ability of future generations to meet their own needs” (United Nations, 1987).
Furthermore, Soppe (2004) states that in previous research, it has been discussed that wealth is a function of capital, nature, and labour. During the 19th century, labour was an essential part of that function. However, in the 20th century, capital became the main
driver to create value. Thus, it could be argued that nature should be the next main driver because of the current environmental issues.
In addition, the concept of sustainable finance contains behavioural development, which sees the agent on the financial market as a human being with morals, which is discussed within business ethics. Thus, the companies cannot merely focus on making a profit but must consider other dimensions within society (Soppe, 2004).
According to Drempetic et al. (2019), investing more capital in companies that are more sustainable, is one way of reaching the sustainable development goals formed by the EU. Furthermore, Lagoarde-Segot (2011) is arguing that, according to modern portfolio theory, diversification with a foundation in social and environmental criteria reduces profit. However, Epstein and Roy (2001) argue that firms that are socially responsible are more innovative and cost-efficient, which in turn is attractive for qualified staff. These cost reductions and product improvements could create a positive response among consumers. Thus, the authors argue that a strong sustainability performance can lead to customer loyalty, which in turn leads to an increased stream of consumption. Hence, these firms often have higher profits and therefore generate higher alfas than stocks that are not socially responsible.
2.2.1. Corporate Social Responsibility
The purpose of CSR is to increase shareholder value as well as their social responsibility. The European Commission altered the definition of CSR in 2011. The new definition was then: “The responsibility of enterprises for their impacts on society” (European Commission, 2011). The commission says that for the companies to meet these responsibilities, they must include factors such as social, environmental, ethical, as well as consumer concerns into their operations (European Commission, 2011).
2.3. Environmental, Social and Governance (ESG)
ESG is a new part of “Socially responsible investments” also called SRI (Syed, 2017), where SRI is an approach where unethical industries are excluded from the portfolio. The purpose of the ESG framework is to have a positive effect on the society, environment, and the firm’s issues regarding Governance (Syed, 2017). According to Galbreath (2013),
the environmental factor within ESG considers pollution, climate change, and the use of water and energy. While on the other hand, the social component of ESG incorporates working with human rights, fair trade, equality between the sexes, product safety, and health. The last part of ESG, Governance, tackles issues that are connected to corporate governance, which could be independence of the board, corruption, reporting, and disclosure as well as protection of their shareholders.
Since the ESG focuses on these three parts to determine a firm’s potential in the long-run, a strong performance in terms of environmental and social awareness and a strong governance record reduces risk. Thus this is an indication of a strong financial performance for many years ahead (Syed, 2017).
However, Syed (2017) argues that there are divided opinions regarding ESG when it comes to the foundation of the phrase. The first opinion implies that ESG is a broader and more developed term of SRI. On the other hand, the other opinion implies that SRI is derived from the ESG, which focuses on what is right and wrong and is thus, a more constricted approach that is aimed towards the retail industry. The ESG is used by “institutional investors” with an approach intended to be aimed towards everybody, instead of only targeting the retail industry.
Based on the two opinions mentioned above, it is difficult to draw a line between ESG and SRI as well as determining if they overlap at any point. The author writes that ESG is thought of as a tool or procedure to determine good management practices, with a concentration on fundamentals (Syed, 2017). By using the ESG framework as part of their primary criteria, the firms are combining an approach of governance and SRI. Therefore, there are companies that are socially responsible and use ESG criteria when making investment decisions today. Thus, this demonstrates that ESG is a term that was developed from SRI but is, in fact, an extension of it (Syed, 2017).
Furthermore, Clarkson (1995) states that the main characters of a company are the managers. The way an organization acts depends on many contractor factors, where one factor is value creation for the shareholders. However, another critical challenge for managers today is to balance a strong business performance with ethical dimensions. To
embrace this challenge, managers must know which ethical practices that are ideal for their company. A manager’s primary task should always be to run their business in the most efficient way possible, as well as trying to achieve good management- and financial performance (Syed, 2017).
According to Kocmanová and Dočekalová (2012), ESG is an important part when deciding and evaluating sustainable development within finance and investments. The authors then continue by saying that including the ESG concept into their financial investing procedures maximizes the company’s, as well as their shareholders, long-term interests. However, these results focus on a Czech perspective, which implies that the results found, apply to that specific country and values used. The results might then differ depending on the country, as well as ESG score and financial performance measures used.
2.3.1. Stakeholder Theory and Shareholder Theory
One of the two theories within Governance is the Shareholder theory, which was first presented by Milton Friedman (1970) in The New York Times. Friedman further explained how the theory refers to the managers increasing value for the shareholders, which could imply that the managers act in favour of the shareholders, without any positive impact on the company itself. This could mean that they refrain from an action that would benefit the company and would, therefore, decrease the value, or work against the interest, of the shareholders.
Freeman (2010), however, came with an alternative theory that shifted focus from solely the shareholders of a company by incorporating the stakeholders. This theory allowed the managers to include employees, customers, and the shareholders of the company when making decisions.
These two, which are an essential part within the governance aspect of the ESG score, have created a dilemma for managers when making decisions concerning the company. Jeff Smith (2003) discusses the differences between the two theories to shed some light on the situation in corporate society. This can be applied to more recent scandals, which
occurred in 2015 and 2019 for the companies Telia4 and Swedbank5. The author then continues by stating that many critics within the subject say these scandals show a failure within the shareholder theory while calling a victory for the stakeholder theory.
Smith (2003) further explain what the main focuses are of the two theories, shareholder and stakeholder. The author explains that these two theories are normative, meaning they indicate what a company’s role ought to be in the aspect of corporate social responsibility. The main focus depends on the theory, the shareholder theory’s main goal is to increase the value of capital to their managers, which are expected to spend the company’s resources in a way that has been permitted by the shareholders of the firm. According to Smith, the stakeholder theory focuses on the obligation of the company towards the stakeholders. The stakeholders can be translated into shareholders, consumers, personnel, suppliers, and the community, which implies that CSR should be included in the management processes.
An example Smith (2003) acknowledges in his article is that the shareholder theory is orientated towards maximizing short-term profitability while disregarding the long-term expenses that may originate from it. However, according to Smith, this is typically not the case since the debate focuses on enlightened self-interest, which would shift the managers towards more long-term decisions. This implies that managers act on behalf of their individual interests. Depending on the manager, the focus will be either to create higher value in the short-run since these benefits will be achieved sooner or to create value in the long-run.
Like with the shareholder theory, there are some confusions regarding the stakeholder theory as well. Smith (2003) explains that a common misunderstanding is that the theory does not focus on profitability, which is not the case. Since, according to the theory, all stakeholder's interests are considered, which include the shareholders. This means that the theory is focusing on profitability; however, it may not be to the same extent as the shareholder theory.
4 This scandal concerns the Swedish telecom company Telia, who helped Azerbaijan’s presidential family swindle approximately
SEK 6 billion (sverigesradio.se, 2015)
5 This arose over suspicions that the Swedish bank, Swedbank was part of a money-laundering scandal, which has been confirmed
Both Freeman et al. (2010) and Kramer and Porter (2011) argue that companies can increase their values when working with sustainability and ESG. By including stakeholder values, when making a decision, the value for the shareholders will increase as well. However, if the stakeholders, thus, the employees and customers are ignored, they can turn to different companies, which will decrease the company’s value in the long-run.
2.4. ESG Score
To comprehend the core of sustainable finance, it is essential to know what the ESG score measures, since the ESG score is part of determining a company’s corporate sustainable performance (CSP) (Drempetic et al., 2019).
Thus, the ESG score is a non-financial way of assessing companies where the purpose is to evaluate how, and to what extent, they work with environmental, social and governance aspects (Achim & Borlea, 2015). One definition of the ESG scores is that it is an additional financial measure of valuation risk, that is intangible. By taking main performance indicators for industries within ESG, the factors that represent opportunities and risks for firms and industries can be analysed (Bloomberg, 2013a, 2013b). However, Bloomberg’s ESG scores are criticised because of its purpose, which is to increase financial profit. According to Lloyed (2018), this could lead to bias, which could affect data integrity.
However, there are short-term issues with sustainable finance. For example, companies might experience additional costs in the short-run when trying to increase the environmental performance. Muhmad and Muhamad (2020) explain that carbon tax, which is a way to reduce carbon emissions, contribute to these expenses. The production costs for manufacturing companies will, therefore, increase because of the carbon tax. However, the atuthors argue that sustainable finance will increase the profitability in the long-run in terms of stakeholder relationships and profitability (Ma et al. 2017; Muhmad & Muhamad, 2020; Cheng et al. 2017).
According to Escrig-Olmedo et al. (2019), MSCI, RobecoSAM, and Viego-EIRIS merge are rating agencies that provide ESG scores. Other agencies are Bloomberg (Bloomberg, 2019) and Thomson Reuters (Tarmuji et al., 2016), where Thomson Reuters will be used in this thesis.
Dorfleitner et al. (2015) investigated the different databases that provide ESG scores to see how much they differ from each other. The databases compared were Bloomberg, Thomson Reuters, and the KLD ratings, and they found variation in the methodologies used. For instance, Bloomberg provides ESG data for 4100 companies in 52 different countries. Thomson Reuters’ provided ESG data for 4300 companies worldwide during 2014, and the KLD provided data for the 3000 largest companies in the US during 2003. The KLD does not provide an overall ESG score nor an individual ESG sub-criteria score. Thus, the ESG score provided by the KLD is presented by binary ESG indicators. Thomson Reuters, on the other hand, divides the binary data points into 18 category scores, which are divided into pillars that represent the ESG factors. These pillars are equally weighted when calculating the score, and all scores are normalized and benchmarked against the total 4000 companies. Bloomberg calculates a “total ESG disclosure score,” which combines the factors of the ESG disclosure scores. These are then tailored towards different business sectors so that the data points that the companies are evaluated on are relevant for the industry it practices within. However, there were no significant statistical differences regarding the variances of the scores reported.
2.5. EU Policies and Regulations
According to the European Commission (2018), the financial sectors and centers are important for the promotions concerning sustainable finance. In addition, the expansion of sustainability goals and climate actions are growing within different sectors in the economy (European Commission, 2018). It is stated in the report that since ESG is a relatively new concept and subject for the financial sectors, the number of centers that officially work toward these goals are still low. For this to expand, the EU must encourage this behaviour and support the green and sustainable financial initiatives; this implies that the fiscal policies implemented must be evaluated.
Based on the situation regarding sustainability, present within the financial sectors, the High Level Expert Group (HLEG) recommends that the financial sectors have to be more specific and more transparent regarding the ESG reporting. Another recommendation is that these sectors review their policies and systems, such as the fiscal situation. It is also important that the time and effort needed for green and sustainable actions and investments are prioritized (European Commission, 2018).
In a report by KPMG (2019), it is written that after the recommendations from the European Commission, different countries have taken different actions regarding sustainable finance. Some governments have chosen to apply specific restrictions while others have chosen to let the market be the main driver. The Swedish government has, according to a report conducted by the Swedish financial supervisory authority (Finansinspektionen, 2018), chosen to incorporate sustainability as a part of the whole corporate governance and not limit it to certain areas of corporate governance. The UK , on the other hand, decided to work with three pillars to strengthen the competitiveness within the financial sector and to align environmentally friendly growth with the financial flows in the private sector. The three pillars are the following, “greening finance,” “financing green,” and “capturing the opportunity” (the Green Finance Strategy report, 2019).
However, Goodhart (2008) mentions one issue that is connected to the EU policies, the boundary problem, which sums up the challenge of internalising external factors. This means that when stricter regulations are implemented into one segment, the business will be shifted to other segments and to other countries with fewer requirements. Another example is when national restrictions for products can be avoided by relocating the production to other countries with fewer restrictions. When looking at issues present in the finance sector, the “sustainable” investors sell the unsustainable investments, but these investments are then “picked up” again by other investors who see these as undervalued investments (Schoenmaker & Wierts, 2015). The authors then propose that a solution to this problem could be an activity or product-based regulation.
In addition, Schoenmaker and Tilburg (2016) present another way to solve the boundary problem, which is to supervise and decrease the financial imbalances within the whole
financial sector that arise because of ecological pressure. The authors propose that this could be done by supervisors and central banks through, for instance, carbon stress tests. This stress test would reveal concentrations in and overexposures to assets that are “carbon-intensive,” which includes all sectors that use fossil fuels in any way.
2.6. Financial Measures
Some of the most common traditional financial performance measures are according to Bernard (1999) Return on assets (ROA), Return on equity (ROE), Return on capital (ROC), Debt-Equity ratio, Retention ratio among others. The authors continue by saying that the performance indicators used and calculated depend on the growth stage of a company; for example, a business that is in the start-up phase would focus on the growth performance, while a more stable firm would focus on maximizing their profit. Previous studies that are presented under the upcoming section 2.7. has apart from these accounting-based measures used market-based measures such as Tobins’q and stock returns (Teti et al., 2015; Eccles et al., 2014; Friede et al., 2015; Velte, 2017).
2.6.1. ROA
According to Selling and Stickney (1989), the return on assets (ROA) is a measure that shows the success of a company by using their assets in comparison to their earnings, which are independent of the financing, which means either debt or equity. This means that ROA includes variables such as net income, tax rate, interest expense, as well as the total assets when calculated. The authors continue by explaining that changes in ROA are connected to either the operating leverage or product-life-cycle trends. This shows that companies with smaller operating leverage have a more stable ROA than companies with greater operating leverage. According to Damodaran (2012), the formula to calculate ROA is:6
𝑅𝑂𝐴 =
𝐸𝐵𝐼𝑇∗(1−𝑇𝑐)𝑇𝑜𝑡𝑎𝑙 𝐴𝑠𝑠𝑒𝑡𝑠 (1)
2.6.2. Operating Cash Flow
Cheng et al. (2020) state that the operating cash flow (CF) of a company is an essential part when evaluating the performance of the company. The authors continue by saying that as time has passed, more people have started to acknowledge the importance of the measurement, such as investors and other professionals in the field. Cheng et al. are critical to the opinion that CF cannot be managed. Instead, the authors consider the measurement to be a benchmark when evaluating the predictability of earnings. In another paper by Rayburn and Jennings (1986), the author explains that the process where earnings are connected to operating activities is a function of when cash flows are transformed into earnings. This measure can then be used to see the relationship between earnings and different activities within the company, which makes it an important financial performance measurement. According to Rist and Pizzica (2015), the formula for Operating Cash Flow is the following:
𝐶𝐹 = (𝐸𝐵𝐼𝑇 ∗ (1 − 𝑇𝑎𝑥 𝑟𝑎𝑡𝑒)) + 𝐷𝑒𝑝𝑟𝑒𝑐𝑖𝑎𝑡𝑖𝑜𝑛 + 𝐴𝑚𝑜𝑟𝑡𝑖𝑧𝑎𝑡𝑖𝑜𝑛
(2)2.6.3. Retention Ratio
In their study, Sasaki and Fujita (2011) mention that the retention ratio of a firm is the amount that the company decides to keep within the company. I.e., how much they are reinvesting back into the company and therefore, do not pay out to their shareholders, which is confirmed by Kahn et al. (2011). The retention ratio is calculated by subtracting the company’s total dividend from earnings and dividing that by the earnings. The authors continue by saying that this ratio is used in combination with the dividend to see its effects on stock prices. In an article by Lieu et al. (2008), it is stated that stable firms tend to have lower retention ratio as well as a lower likelihood of financial distress. Retention ratio can also be written as reinvestment rate in different articles or sources. Chakravarty and Xiang (2011) and Hanusch and Pyka (2007) states that reinvestments are placed into areas such as development and research as well as human resources. These two areas include attracting new employees, who contribute to innovative solutions in order to increase the firm’s profit. Based on the information provided by Kahn et al. (2011), the formula for retention ratio is:
2.6.4. Debt-Equity Ratio
According to Bhandari (1988), the debt-equity ratio is used to estimate the risk of a company’s equity, by dividing the debt by the equity. Bhandari then continues by explaining that if the ratio increases, so does the risk that is connected to the common equity. The ratio is expected to be positively correlated to a company’s equity risk; this is then the reason for the ratio being used as an alternative to risk in an analysis. The risks that are connected to this ratio are the business and financial risk (Bender, 2014). Business risk is the risk within the firm, which is not correlated with the financing of the company. Thus, business risk determines a company’s ability to make enough profit to cover its operational costs and thereby make a profit. The financial risk is the risk for bankruptcy and is focused on the debt and financial leverage of the firm (Gabriel et al. 1980). Between these two, there should be a negative correlation; if the business risk is increasing, the financial risk should decrease. The level of risk depends on the growth phase of a company, thus, if a company is in a stable growth phase the business risk should decrease since it becomes less risky to invest, and vice versa for firms in an unstable growth phase. When the business risk decrease, the financial risk should increase, which can be done by increasing the debt in the company. Thus, the debt-equity ratio should increase as a company gets more stable (Bender, 2014). The formula to calculate the debt-equity ratio is, according to Damodaran (2012):
𝐷𝑒𝑏𝑡-𝑒𝑞𝑢𝑖𝑡𝑦
𝑟𝑎𝑡𝑖𝑜=
𝐷𝑒𝑏𝑡𝐸𝑞𝑢𝑖𝑡𝑦 (4)
2.7. ESG and Financial Performance
There have been a few previous studies to investigate if there is a relationship between ESG and different financial performance measures. One previous study conducted by Teti et al. (2015) for the period 2005-2010, with a sample between 191 to 538 companies, found that sustainable investments can create value for both the investor and the companies.
Eccles et al. (2014), tested 90 companies that were considered to be highly sustainable and 90 unsustainable companies in the US for an 18 year period between the years 1993 and 2010, to find the effect of sustainability in companies processes and performance.
From this study, the authors found significant results saying that highly sustainable companies surpassed the other, less sustainable, companies in the long-run in both the stock market and accounting performances. Another conclusion drawn by the authors is that less sustainable companies focus more on maximizing their profit and sustainability is seen as an externality.
Fried et al. (2015) conducted a meta-analysis on approximately 2200 individual studies, where they found a positive relationship in 90 percent of the cases, with a significance level of 0.05, where they tested the ESG against corporate financial performance. The authors also concluded that the positive impact ESG has on CFP seems to be stable in the long-run.
In a previous study by Velte (2017), the impact of ESG on the CFP for German companies such as DAX307, TecDAX8 , and MDAX9 was investigated. For the research, Velte conducted the study on 412 observations over the time-period between 2010 and 2014. The number of companies ranged from 80 to 85 for the four years. The results showed, as the two previous studies mentioned, a positive impact on financial performance when the three factors are tested individually. Velte found that the factor, Governance, had the biggest influence on the financial performance contrasted to the other two factors. However, when the author tested the ESG against Tobin’s Q, which is the financial performance based on the market, no significant impact was found in the relationship between the variables.
7 DAX30 is the German stock market index, with companies trading on the Frankfurt Stock Exchange (Lobel, 2020). 8 TecDAX is an index containing the 30 companies ranked directly beneath the DAX stocks in terms of size
(Deutsche Börse Group, 2020b).
3. Methodology
Chapter three explains the scientific research approach, which is followed by a description of the data, data collection, and data analysis. Finally, the hypotheses are described, and the limitations are acknowledged.
3.1. Scientific Research
Within the scientific research on methodology, several areas need to be decided and clarified when conducting a research report, according to Saunders et al. (2016). These areas are research philosophies, approaches, and designs, which are based on different aspects and approaches.
However, for this research, a positivistic philosophy will be used since this report is using a larger scaled sample as well as a quantitative data set. Hence, a quantitative method is most appropriate since this method is, just like the philosophy, used for larger scaled data sets as well as for statistical analysis. This is the case with the data regarding the ESG score as well as financial performance indicators. The most suitable approach for this report is a deductive method since, for this method, the theory must be determined first, and the data is collected based on the theory in order to find evidence for or against the already existing theory (Saunders et al., 2016).
Within the final area, substantial deductions must be made depending on the purpose of the research design. The type of study that is conducted in this report is a combination of exploratory and explanatory studies. An exploratory study is, according to Saunders et al. (2016), when the research questions are open in order to discover and explain what happens as well as gaining insight and interest in the subject. While the explanatory studies are more about creating a fundamental relationship between different variables in the research. Based on these deductions, this report will be based on a combination of these two, and gain insight into the subject as well as investigating if there is a relationship between the variables ESG and financial performance. ESG is not formally seen as an approach within finance; however, there is still a policy pressure on the concept. Hence
it is an important aspect when investigating the relationship. Another aspect of the analytical tests of this report is the null hypothesis, which consists of a prediction that there will not be a significant relationship between the variables.
3.2. Data Sampling
The countries that will be compared are Sweden and the United Kingdom. The original plan of action was to have around 20 companies that had a low ESG score, 20 with a moderate ESG score, and 20 with a high ESG score. Thus, a variety of both higher and lower scores leads to a more fair approach. However, when reviewing the data, the sample was slightly small. Therefore, the remaining companies that had the financial information needed and an ESG score for the period analysed were retrieved. Each group was thereby increased, and the final sample consisted of 25 companies with a high score, 25 with a middle score, and 25 with a low score. Thus, 75 companies from the OMXSLCGI, where companies with a market capitalization over 1 billion Euro are listed, was chosen for Sweden (Avanza, 2020). The same process was made for the UK, where 75 companies from the FTSE100 was collected, where the 100 largest companies in terms of market capitalization are listed for the UK. The companies used for this thesis can be seen in appendix 1 for Sweden and appendix 2 for the UK. Furthermore, both Nemetz (2015) and Lloyd (2020) have, because of the purpose of their investigations, said that companies with higher ESG scores were measured to work more with sustainability. The assumption made by Nemetz and Lloyd will be applied in this thesis.
3.3. Data Collection
3.3.1. Secondary DataSecondary data can come in many forms; one example, is raw data, which means that there has been close to no alternations and processing of the data. Secondary data can also be compiled data, which includes data that has been received by some selection or summarization (Saunders et al., 2016). For this report, the data used is secondary data collected from the Thomson Reuter Eikon datastream, which is a form of compiled data. Secondary data will be used since the ESG score is distributed by the main rating agencies such as Thomson Reuter and Bloomberg. For the financial measures, secondary data will also be used in order to be consistent with the gathering of the values, by using
the values from Thomson Reuters it is ensured that they have been through the same process when being calculated. Thomson Reuters delivers high-quality data, which ensures high reliability. The data collected is also interpreted as panel data.
3.3.2. Procedure
The ESG scores were collected from Thomson Reuters Datastream, as well as the financial performance indicators. This datastream is used for both the Swedish and British variables.
Since Dorfleitner et al. (2015) investigated the differences between the different databases that provide ESG scores and found no significant difference between them, the data was collected from the Thomson Reuters datastream. Thomson Reuters was chosen since that database was accessible at the University and provide high-quality data.
To divide the companies into three groups of high, mid, and low scores, the Thomson Reuters ranking from 2019 was used as a guideline. However, since the scores included in this thesis are collected during the period 2015-2018, the final ranking will be based on the 2018 ESG scores. This means that companies that were, during 2019, ranked among the middle and the lower-ranked companies, had, in some cases, higher scores in 2018 than the higher ranked companies in 2019. However, the ranking presented in this thesis is based on the 2018 scores; the companies chosen are inspired by the 2019 ranking. This did not impact the results since we rearranged the companies after their ESG scores when they were all listed in the same Excel file.
The data concerning the ESG score is retrieved from the Thomson Reuters database, which is a peer-to-peer comparison, that is deigned to be as accurate as possible. The process of producing the score is divided into six main conclusions; these processes transform the data into ratings, which consists of three values for the screened companies; these are the Raw Score, Percentile Rank, and Ratings. The Raw score gives a value between 0 and 1 if they have reported at least one Key Performance Indicator (KPI) during a given year. The percentile rank is based on the raw score. The final value produced, which is used in this report, is the Ratings, which gives a value between 0 and 100, this rating is calculated by using the Environmental, Social, and Governance practices which
have been normalized and adjusted for skewness. The conclusions consist of weighting and modelling KPIs, environmental-, social- and governance practices, calculations of denominators for KPIs, and policy indicators. However, this does not weigh as heavy as the observed practices, and the final conclusion is that each KPI’s weight is checked against academic literature (Thomson Reuters, 2013).
3.4. Data Analysis
3.4.1. Multiple Linear Regression Model
Regression analysis is a common tool to use for forecasting and prediction. A multiple linear regression model can be used to determine if a relationship exists between at least two or more explanatory variables. Furthermore, one of the main tasks when creating a multiple regression model is to choose the factors. The factors that were chosen was ESG score, ROA, CF, RET, and D/E ratio, because of their capacity to inform investors about the company’s financial performance, where the ESG score is the dependent variable.
Osbourne and Waters (2002) explain that in a multiple regression analysis, there are four assumptions that researchers should always test. These assumptions are that the variables used are normally distributed, linearity between independent and dependent variables, reliability of the variables, and homoscedasticity (Osbourne & Waters, 2002). In the case where these assumptions are not fulfilled, the results and findings are less reliable; hence they can interfere with the results. Another assumption is that there is no multicollinearity in the multiple regression. When this assumption is not satisfied, it is difficult to estimate the impacts of the independent variables in the regression, which is why it is one of the more severe problems with the analysis of the regression (Obite et al., 2020).
3.4.2. Ordinary Least Square (OLS)
Ordinary least square (OLS) regression is a way of estimating linear regression models (Ohlson & Kim, 2014). When performing an OLS regression on panel data, this becomes a Pooled OLS regression. However, OLS cannot be used when there are outliers, which are points that are located very far away from the other observations. Neither can it be used when heteroscedasticity exists (Ohlson & Kim,
2014). Heteroscedasticity is a situation where the dependent variable has a variance that is linked to the values of the independent variables (Cai & Hayes, 2008).
Furthermore, a few remedies for heteroscedasticity are mentioned in the article by Cai and Hayes (2008), for example, WLS (weighted least squares) estimators. However, weighted least squares can only be used if the cause of the heteroscedasticity is known. If the cause for the heteroscedasticity is unknown, there is still a need to consider it. If the heteroscedasticity is not considered, it can lead to biased and inconsistent standard errors. A consequence of biased and inconsistent standard errors are incorrect t-tests (Cai & Hayes, 2008).
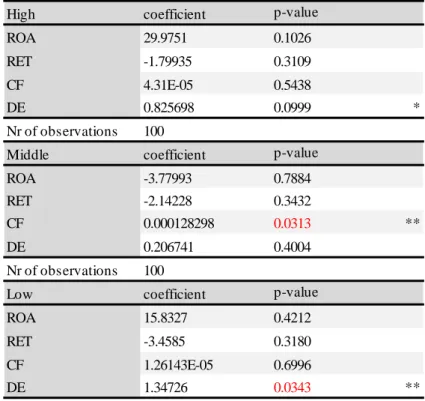
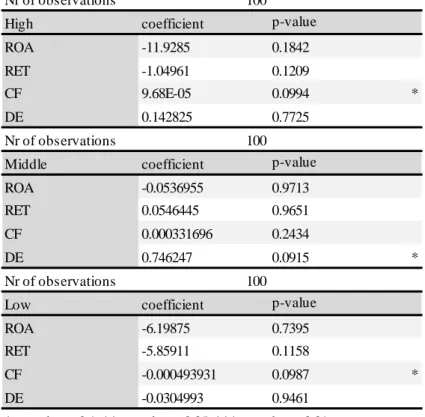
In order to analyse the data, five regressions will be performed, where two regressions will include all companies, and three will be performed for the individual groups, thus, contain 25 companies each. When including all the data, a Pooled OLS regression and a Fixed effect regression model (FE) will be used. For the three smaller sample groups (high-, middle- and low ESG score), a Pooled OLS will be used since these samples are too small for a FE model to be accurate.
When using a Pooled OLS regression for panel data, the results can be misleading since one assumption this regression makes is that the data is independent. This means that the OLS regression has the best effect when the individual effect (i.e., cross-sectional or time-specific effect) does not exist. In other words, this means that the variation is not isolated within the units, which could indicate that, for example, the results for the lower-ranked companies might affect the higher-rated companies. Thus, the results can be misleading.
Furthermore, when determining which regression model to use, it is crucial to choose the model that fits the data best. One indicator of how well the model fits the data is the adjusted R2, which can be seen in the appendix 5 for Sweden with a value of 0.031461 and in appendix 8 for the UK with a value of 0.055825. Both the adjusted R2 in the Pooled OLS regressions for the two countries are relatively low, which indicates that this model is not the most appropriate to use for this data sample.
3.4.3. Fixed Effect Model
Previous studies, such as Velte (2017) and Eccles et al. (2014), used a FE to investigate the relationship between ESG and financial performance. A FE is, according to Uchôa et al. (2014), commonly used when analysing panel data. The purpose of the FE is, therefore, to tackle the matter of omitted variable bias (Allison et al., 2017). One issue that arises when estimating variation between units, which for example, could be men and women, when using traditional statistical methods is an increased risk for omitted variable bias and heterogeneity (Hill et al., 2019; Uchôa et al. (2014). However, Hill et al. emphasize that when using a FE, the variation is kept within the units, thus with the example above within the individuals. This reduces the risk of unnoticed heteroscedasticity and omitted variable bias. The reason for the decrease in omitted variable bias under FE is because less variation appears within units than between units. Furthermore, Vaisey et al. (2016) explain that the FE is designed in a way that makes it able to clear out the estimation equation of all features, unmeasured as well as measured, that are constant within groups or over time.
However, there are some critics, like Gayle and Lambert (2014), who mean that the sample size is reduced when a sample is limited to variables that change over time. The authors continue by saying that this then leads to lower statistical power.
To determine which model to use, a diagnostics test was performed. This test resulted in the FE regression model to fit the data better for the regressions where all companies were included. Previous studies have used the FE model when analysing similar data sets, in terms of size and aim of the study. An example of a similar study that has used the FE model is Velte (2017), where 80-85 companies were analysed for four years, which resulted in a total of 412 observations. Therefore, the FE model will be used for the regression, including all companies. However, the Pooled OLS run for all companies, will be included as well, but will be used as a benchmark to see if the results differ between the FE and the Pooled OLS. For the regressions that only contain one of the three groups (low, middle, or high), the Pooled OLS was preferred, according to an additional diagnostic test. Thus, the Pooled OLS will be used for the separate groups.
𝐸𝑆𝐺𝑖 = 𝛽0 + 𝛽1𝑅𝑂𝐴𝑖+ 𝛽2𝑅𝐸𝑇𝑖 + 𝛽3𝐶𝐹𝑖 + 𝛽4𝐷𝐸𝑖 + 𝜀𝑖 (5)
3.5. Hypotheses
In order to determine if there is a relationship between the ESG score and financial performance in Sweden and the UK, two hypotheses were conducted for FE regression. Two different hypotheses are presented below for the Pooled regressions for the individual ranking groups (high, middle, and low). The hypotheses are based on a positivistic approach, which means that the standing point is that there is no correlation between the independent variable and the dependent variable. Thus, the hypotheses are as follows:
H1: There is no positive/negative correlation between the ESG score and any of
the financial measures ROA, RET, CF, and DE for companies in Sweden during the time-period 2015-2018.
H2: There is no positive/negative correlation between the ESG score and any of
the financial measures ROA, RET, CF, and DE for companies in the UK during the time-period 2015-2018.
H3: There is no positive/negative correlation between the ESG score and any of
the financial measures ROA, RET, CF, and DE for companies in any of the individual ranking groups, high, mid, and low in Sweden during the time-period 2015-2018?
H4: There is no positive/negative correlation between the ESG score and any of
the financial measures ROA RET, CF, and DE for companies in any of the individual ranking groups, high, mid, and low in the UK during the time-period 2015-2018?
3.6.
Limitations
One important factor has been to maximize the reliability of this thesis through transparency with the help theory and data selection and analytical tests. However, some limitations and restrictions have to be considered when implementing the analysis, which will be presented in this section.
Since the data was collected from Thomson Reuters datastream, the data is limited to the data available on datastream. The companies that contained all information needed for this thesis are companies listed as large-cap. Besides, Thomson Reuters only had accessible data for the majority of the companies during a four-year period, which is a limitation regarding the long-term effects. Hence, it will not be possible to draw any significant conclusions regarding the long-run effect, nor differences between different company sizes. The data collection has further been limited because of a change in opening hours at the IT service at the university because of Covid-19. The IT services are needed in order to access the database Thomson Reuters, where data for another country would have been collected.
The first limitation concerning the multiple linear regression model used for the statistical tests is the assumptions; normal distribution, linearity, reliability, and homoscedasticity as well as multicollinearity. Since the ESG score is considered being a predictive measure, linearity could be a problem since the exact structure of the relationship cannot be determined. This means that we can neither dismiss nor confirm that linearity is a problem within these tests conducted in section 4.1. Another limitation of the multiple linear regression model is that it only takes the information that is easily measured, into account. This means that information that is not included within this category could be excluded, e.g., the culture within a company, which can affect both the ESG and the financial performance. By using the FE model, these limitations are accounted for and thus should not be a problem. A multiple linear regression model is also sensitive to outliers, which can be a limitation when running the regression. Limitations regarding the final FE regression model, which is presented in section 4.1, showed signs for heteroskedasticity for both Sweden and the UK, which indicates that the regression does not capture all the relevant information. However, when running the regressions, the model considers this through robust standard errors.
There are also limitations regarding the data sample, firstly, this report only considers four years, which means that this report does not consider the long-term effect of the relationship between the ESG score and financial performance measures. Another limitation is that this report only uses data from 2 countries, Sweden and the UK, which
both are located in Europe. Furthermore, the ESG score itself is a constraint, since different agencies use different techniques to obtain the ESG scores. Thus, the final score for the same company could differ from agency to agency. However, since Thomson Reuters is a high-quality rating agency, the findings in this thesis will be based on this data.
3.6.1. Reliability and Validity
When measuring data, there are three main biases that could occur; deliberate distortion, changes in the data collection, and a data collection method that does not fit the purpose of the topic (Saunders et al., 2016). These affect the reliability of the research. Reliability is referring to the ability to replicate the study and consistency. Thus, if someone can successfully replicate a previous research design and accomplish the same results, the method is reliable. Another vital part of any research is the term validity, which means correctness of the different measures used as well as the precision of the study (Saunders et al., 2016). The secondary data used for this report can be seen as reliable because the data is collected from Thomson Reuters, which has an influential part within the field of financial data.
4. Empirical findings
The fourth chapter presents the statistical results where the descriptive statistics are presented first, followed by the regression results obtained for Sweden and finally, the UK.
4.1. Results
4.1.1. Descriptive Statistics
This study was conducted on 75 companies in each country, which is equivalent to 300 observations for each country. Thus, there are 600 observations in total.
For the different countries, most of the variables have similar descriptive statistics; however, for the minimum value, the UK has lower values than Sweden, except for the CF, which can be seen in Table 1 and Table 2. Other variables that differ are the median for the CF, where Sweden has higher values than the UK. The standard deviation is
Nr of observations 300
ESG ROA RET CF DE
MEAN 67.2740 0.0568 0.1685 3778.00 1.2016 MEDIAN 70.3850 0.0500 0.0800 2814.50 0.5300 MINIMUM 17.0700 -0.1600 -3.0000 -305050.00 0.0000 MAXIMUM 94.2100 0.3400 1.0000 70932.00 32.8000 STD. DEV 17.4490 0.0565 0.3874 27718.00 2.6254 Nr of observations 300
ESG ROA RET CF DE
MEAN 69.3000 0.1000 0.0150 3038.30 1.1232 MEDIAN 71.5950 0.0600 0.2600 701.2500 0.6300 MINIMUM 7.0000 -0.2300 -6.8000 -12414.00 -2.3600 MAXIMUM 95.3300 2.3700 1.0000 68959.00 24.7000 STD. DEV 15.0590 0.2666 0.7236 7663.60 1.9392
Table 1: Descriptive statistics: Summary statistics for the Swedish variables
during the period 2015-2018
Table 2: Descriptive statistics: Summary statistics for the UK variables
another variable that differed for the CF, where Sweden also had higher values than the UK.
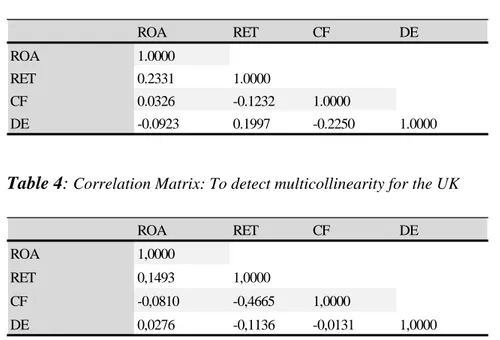
Within the formulas, two variables are including EBIT, which could imply that there is a multicollinearity problem. A correlation matrix was performed to detect a potential multicollinearity problem for the two countries. However, these found no collinearity between the independent variables for neither of the countries, which can be seen in Table 3 and 4 respectively.
4.1.2. Regression Summary
In order to conduct the OLS regression, we used the program GRETL, which stands for Gnu Regression, Econometrics, and Time-series Library. This program is, according to their official website, a software for econometric analysis, which is written in the programming language C (Gretl, 2020).
Gretle was chosen since it is a program that is specially designed for the type of data that we are using as well as its easy access.
Furthermore, five regressions will be performed in order to evaluate if there is any correlation, thus no causation between financial performance and ESG score. The
ROA RET CF DE ROA 1.0000 RET 0.2331 1.0000 CF 0.0326 -0.1232 1.0000 DE -0.0923 0.1997 -0.2250 1.0000 ROA RET CF DE ROA 1,0000 RET 0,1493 1,0000 CF -0,0810 -0,4665 1,0000 DE 0,0276 -0,1136 -0,0131 1,0000
Table 3: Correlation Matrix: To detect multicollinearity for Sweden