This is the published version of a paper published in A|Z ITU Journal of the Faculty of Architecture.
Citation for the original published paper (version of record): Abshirini, E., Koch, D. (2017)
Resilience, space syntax and spatialinterfaces: The case of river cities. A|Z ITU Journal of the Faculty of Architecture, 14(1): 25-41
https://doi.org/10.5505/itujfa.2017.65265
Access to the published version may require subscription. N.B. When citing this work, cite the original published paper.
Permanent link to this version:
Resilience, space syntax and spatial
interfaces: The case of river cities
Abstract
Resilience defined as the capacity of a system to manage impacts, keep its ef-ficiency and continue its development has been scrutinized by researchers from different points of view over the past decades. Due to the prominence of resilience in urban planning, this paper intends to find out how the spatial structure of cities deals with disturbances, and if geographical phenomena such as rivers affect the resilience in cities. Using the space syntax methods syntactically analyze the resil-ience in cities, we innovatively introduce two measures; similarity and sameness. These measures are in relation with the syntactical properties of cities and com-pare the degree of resilience between different groups. Similarity measures the degree to which each city retains the relative magnitude of its foreground network after a disturbance and sameness is the degree to which each city retains the same segments as its foreground network after a disturbance. Likewise to network resil-ience studies, we apply different disturbances on cities and explore the reaction of cities to disturbances in terms of size of the foreground network and which seg-ments are parts thereof. We then compare different groups based on these mea-surements as a method to analyze sameness and similarity. The results show that the resilience, in the way we define it, is different in different cities depending on in which view and based on which parameters we are discussing the resilience. Additionally morphological phenomena such as rivers have a great impact on the structure of cities and in turn on their resilience.
Keywords
River-cities, Resilience, Space syntax, Spatial analysis, Disturbances. Ehsan ABSHIRINI1, Daniel KOCH2
1ehab@kth.se • Department of Urban Planning and Environment, School of Architecture and Built Environment, KTH Royal Institute of Technology, Stockholm, Sweden
2daniel.koch@kth.se • School of Architecture, KTH Royal Institute of Technology, Stockholm, Sweden
Received: December 2015 •Final Acceptance: December 2016
do
i: 10.5505/i
tu
jf
1. Introduction
The rate of urbanization and the dy-namic development of cities has been rapidly increasing over the past centu-ry, with half of the world’s population now living in cities (United Nations, 2014). As a result, urban resilience is becoming an increasingly important issue. The frequently uninhibited pat-terns of urban sprawl make cities and the people living there vulnerable to multiple stresses, and increase the need for sustainable planning (TERI, 2009). A resilient city not only facilitates in-teraction with nature, and improves re-sponse to natural disasters; it also helps increase sustainability, mitigating some of the undesired consequences stem-ming from human activity (Reid and Demarin, 2013). It has also become clear that as a result of climate change and the consequent increased risk of flooding or droughts, rising sea levels, and more extreme weather conditions, geographical conditions are increas-ingly factors that must be considered in studies of urban resilience (Carter et al., Leichenko, 2011; Pickett, Cadenas-so, and Grove, 2004).
In relation to this broad set of is-sues, in this paper we investigate how a single property of urban space—the morphological configuration of public space into networks—relates to a sin-gle geographical feature—the presence or absence of a river—and how this re-lates to questions of urban resilience. This research is designed to increase our knowledge of a focused subset of urban resilience, “resilience in spatial morphology” (Marcus and Colding, 2014). In particular, we will study how spatial configurations, specifically as studied in space syntax research, may be more or less resilient to alterations to their systems. Further, the inclusion of rivers allows us to offer some initial findings on whether vulnerabilities can be generically linked to a city’s geo-graphical features.
Degrees of network continuity and network fragmentation are common-ly investigated and important features of network resilience in terms of ro-bustness. In this study, we investigate different aspects of networks from the perspective of resilience. Our focus will not be on network continuity is-sues per se, but rather on how the con-figurational and systemic characteris-tics of networks and nodes are changed by disturbances. A novel method us-ing sameness and similarity measures
(Koch & Miranda, 2013) was created for analyzing urban resilience through investigating the effects of disturbances on the city network. This paper focuses on developing these two concepts with-in the context of the spatial configura-tion of cities, and using them to exam-ine whether the presence or absence of rivers has a significant impact on how cities react to disturbances. As such, this is not a comprehensive investiga-tion of resilience, but rather an attempt to add additional perspectives on what constitutes resilience in urban settle-ments, as well as an understanding of the structural effect of rivers and the role of bridges in city configurations. A full investigation would include studies of complete system breaks, changes to global trip lengths, changes in specific accessibilities and distances, and many other issues.
Finally, with this research we aim to increase knowledge within the field of space syntax on aspects of system-ic change, whsystem-ich arguably is still in need of development. In order to do this, both resilience and space syntax as they pertain to the content of this paper require further discussion, as does the translation of the concepts of sameness and similarity into the meth-odology that is this paper’s primary contribution. This includes testing the developed concepts on larger empirical samples.
2. Resilience
While ostensibly a clearly defined term, the concept of resilience has become ambiguous due to the way it is used in different fields. It is a regu-lar part of the vocaburegu-lary employed in fields such as ecology, engineering, social network and network theory, the material sciences, economics, and architecture, and has lately become a nearly interchangeable substitute for the term sustainability in urban plan-ning. Concerns have recently been raised that the proliferation in its use may lead to it becoming a catch-all term, similar to what has arguably happened with “sustainability” (Rose, 2007; Grünewald and Warner, 2012; Galderisi, 2014). Reviewing how re-silience is defined in different fields, therefore, is important in order to clar-ify the set of properties of a resilient system that will be employed in this study.
Resilience was given its contempo-rary definition in the field of ecology by
Holling (1973, p. 14) as “a measure of the persistence of systems and of their ability to absorb change and distur-bance and still maintain the same rela-tionships between populations or state variables.” This definition is similar to what United Nations International Strategy for Disaster Reduction (UNIS-DR, 2009, p. 24, p. 31) offers as “the ability of a system, community, or soci-ety exposed to hazards to resist, absorb, accommodate to, and recover from the effects of a hazard in a timely and ef-ficient manner, including through the preservation and restoration of its es-sential basic structures and functions.” Similarly, in network theory resilience is defined as the degree to which a net-work’s efficiency remains functional, changes or is damaged when vertices are removed in a random or targeted fashion from the system (Iyer et al., 2013). In urban planning, resilience is defined as the “capability to pre-pare for, respond to, and recover from significant multi-hazard threats with minimum damage to public safety and health, the economy, and national se-curity” (Wilbanks, 2007, p. 2). A sum-mary of the concept of resilience, then, would seem to concern the ability of a system to survive or be maintained in the face of disturbance. Holling him-self, however, later noted (1996) that two dominant types of resilience defi-nitions have emerged, which he calls ecology resilience and engineering re-silience. In short, the former is charac-terized by a system’s ability to “bounce back” after a disturbance, and the latter by a system’s ability to continue work-ing unaffected by a disturbance. The research in this paper addresses both of these kinds of resilience to an extent, although through the specific interpre-tation of each as sameness and similar-ity factors.
3. Space syntax and resilience
In this paper we therefore aim to develop a method for measuring re-silience in different cities interpret-ed through space syntax models, and measured from different points of view. We seek to establish a link between the spatial properties of a city network and resilience on the one hand, and be-tween resilience and the morphology of a city on the other hand. The useful-ness of space syntax as a set of theories and tools for spatial and configuration-al anconfiguration-alysis has been demonstrated not only in the interpretation of
morpho-logical space, but also in linking geo-metrical and syntactical measures and analysis of the city’s spatial configura-tion. Research that directly addresses the relationship between space syntax and resilience problems is uncommon, although a few recent cases can be found. Researchers like Hillier (1996) and Shpuza (2005, 2006, 2007, 2011, and 2013) have implicitly pointed to resilience in some of their studies, but without using the same term. In his thesis, for example, Shpuza (2006) ex-amined the relationship between floor plate shapes and layout integration. He showed that removing unit cells in dif-ferent ways from building floor plates in different shapes affects the mean depth and integration values different-ly. He stated that this effect depends on the position of the cell in relation to the presence of underlying regions in a floor plate shape. This, however, does not directly address resilience, and centers on small-scale spaces like floor plate shapes, rather than compar-atively large-scale spaces such as street networks and cities.
Esposito and De Pinto (2015) in-vestigated the influence of flood risk on the city of Turin and syntactically measured flood resilience. They calcu-lated different syntactical properties, such as angular segment integration and angular segment choice values in global and local radii for the condi-tions before and after the flood. Con-ducting a principal component analy-sis and clustering, they compared the spatial configuration of the city both pre- and post-flood. Since they found limited changes in spatial properties, they concluded that Turin’s network retained the same functional structure before and after the flood, and could be considered resilient in the wake of the flood disaster.
Cutini and Di Pinto (2015) exam-ined the actual effects of the Vesuvius volcano on the configuration of the self-organized urban area on its slopes to try to find out how space syntax may be involved in measuring the resilience of the city in relation to the volcano. Introducing different syntactical pa-rameters, including mean connectivity, synergy (correlation between radius 3 and radius n integration), and fre-quency index (the ratio between the highest choice value and the value for the maximum frequency of use for a given line), they posited that a system is more resilient if the first two
param-eters mentioned above increase, while the third decreases. They concluded that the new development in the city, from this point of view, has made it more vulnerable to an eruption, and has decreased the area’s resilience.
Carpenter (2013) investigated disas-ter resilience in the coastal Mississippi area of the U.S. that was hit by Hurri-cane Katrina in 2005. Using temporal data from before and after the hurri-cane, Carpenter studied the effect of syntactical and built environmental measures on community resilience. The syntactical parameters used in this research to evaluate the connec-tivity of streets were metric and angu-lar reach (Peponis, Bafna and Zhang 2008), which are calculated based on distance and direction changes, re-spectively. Several other variables were also added to the model. Carpenter found that some specific syntactical and environmental parameters had positive influences on the city’s resil-ience, such as metric reach, the densi-ty of social networking organizations, historic site density, and land use mix. Other variables, such as the presence of parks, actually had a negative impact on resilience. The paper concluded by highlighting the role of the built envi-ronment and syntactical parameters on social networks and resilience.
In another recent work that forms part of the basis for the methodology used in this paper, Koch and Miranda (2013) sought to conceptually discuss resilience in relation to space syntax theory, and offered methodological parameters for measuring resilience in buildings, which other notable ear-lier work has also addressed albeit for other purposes (e.g., Unlu et al, 2005). To do so, they used existing space syn-tax measures, such as integration and connectivity, to suggest measures relat-ing to sensitivity such as sameness and similarity factors, which are discussed in the next section. Through these concepts of resilience they were able to measure a building’s adaptability, as well as identify vulnerable locations in-side buildings. It should be noted that Koch and Miranda use sameness and similarity as broader concepts with a range of specific individual mea-sures, allowing a qualitative discus-sion, whereas we, in this paper, will be making use of specific individual mea-sures as indicators of these concepts. The authors mention, however, that this definition of resilience does not
uniquely relate to morphology. What they present concretely is a framework by which buildings can be understood as resilient in different ways according to their spatial configuration. Resil-ience is then measurable depending on the answers given to the question “resilience of what and for what?” This question almost paraphrases what We-ichselgartner and Kelman (2014, p. 21) propose as the critical question for any resilience study. Koch and Miranda fi-nally conclude that syntactic resilience specifically means the degree to which a spatial configuration formulates a similar spatial interface (e.g. Hillier and Hanson, 1984) before and after a disturbance—or as Cutini and Di Pin-to (2015, p. 66:5) put it, the measures investigate “the impact of change on inhabitancy and cultural identity.” We chose this position in part because it reaches beyond the generic observa-tion that a more distributed system is more resilient to failures, acknowledg-ing that, for social and cultural rea-sons, simply increasing the distribut-edness of a system may be problematic. In this paper we will further expand upon Koch and Miranda’s work in ap-proaching resilience from the point of view of configuration as socio-spatial interface. A wide range of resilience issues—including, for example, emer-gency egress or access to emeremer-gency shelters (Sari and Kubat, 2011; Dou and Zhan, 2011)—can reasonably be much better understood using other models, measures, and methods.
A secondary aim of this paper is to elucidate the properties of a syntactical view of resilience by means of quantita-tive comparison of resilience between river cities and non-river cities. For this reason, while the main body of empiri-cal material concerns river cities, a con-trol sample of non-river cities has been added. The paper shows how investiga-tion of a large sample of cities morpho-logically divided into two groups allows patterns corresponding to each group of cities to be uncovered. The main hy-pothesis of our research is that resilience is affected by the form of cities, which in turn is affected by morphological phe-nomena on a geographic scale. In this study the presence or absence of rivers streaming through the cities plays the role of morphology which influences resilience in river cities in compari-son to non-river cities. To enhance the strength and accuracy of the results, a large sample of cities of different sizes
from a variety of locations was chosen. This means that the research in this paper constitutes a dual investigation of how spatial configuration, as studied in space syntax research, can be un-derstood from a resilience perspective, on the one hand, and how an under-standing of network configuration and characteristics, as developed in space syntax, can contribute to a broader un-derstanding of the resilience of city sys-tems on the other hand. We therefore introduce ways of measuring resilience related to syntax theory, and ways of understanding resilience based on the relationships between space and soci-ety explored in syntax research. This paper thus contributes to resilience re-search by investigating how concepts of resilience can be studied using the strengths of syntactic analysis, rather than looking at habitual methods of analyzing resilience, but implementing them using a syntactical model or syn-tactical measures.
4. How should resilience be measured?
Due to embracing a wide range of as-pects and definitions over time, there is no flawless, uniform method for mea-suring a system’s resilience. Depending on the system observed, and the point of view from which resilience is de-fined, the methods and models might be different. One of the established per-spectives for resilience investigation is the study of resilience in complex net-works, including city networks (Holme et al., 2002). In spite of dissimilarities in technique, the basis of all methods is similar, due to the ability to graphically represent a network as a collection of nodes and edges (referring to the ob-jects and connections, or interactions between objects in a network, respec-tively) (Albert et al., 2000; Latora and Marchiori, 2003; Hu and Verma, 2011; Ghedini and Riberio, 2001; Iyer et al., 2013). The method used in this paper conforms to the targeted failure and at-tack approach, but focuses on changes in syntactic properties, rather than on network continuity or network breaks.
While the terms resilience and ro-bustness are used nearly interchange-ably in research, in this paper we will in practice primarily investigate robust-ness, which is often used in research focusing on the efficiency and stability of a network. As Bankes (2010, p. 148) notes, “the resource base of methodolo-gy and software for robustness analysis
provides a solid foundation for estab-lishing a practice of resiliency analysis.” The difference between resilience and robustness, however, is that robustness concerns the strength and durability of a system to withstand internal and external disturbance without critical changes to the original system, while resilience refers to the flexibility and adaptability of a system to recover or bounce back from internal or external disruption and revert to the original system, or a stable state based on new requirements (Read, 2005; Folke, 2006; Haan et al., 2011). Robustness, from the point of view of this paper, forms a specific aspect of resilience clearly re-lated to Holling’s (1996) discussion of types of resilience above.
As mentioned previously, the con-nection between resilience and space syntax in research is limited compared to the potential. What we expect from this integration is: first, to develop a general framework for integrating spatial configuration in terms of space syntax and the resilience of a system; and second, to use this framework to quantitatively compute syntactical re-silience, and compare these measure-ments between cities.
To investigate resilience in different cities based on syntactical properties, the integration and choice values of the cities are extracted. These measures are the two main properties used today in space syntax research (Hillier et al., 2012, Hillier and Iida, 2005), and it has been repeatedly established (Hillier and Iida, 2005; Turner, 2007; Hillier et al., 2012) that they show positive and significant correlations to pedestrian movement flow in cities. Furthermore, we have earlier shown that choice value offers a good metric for the study of the interaction between morphology and street networks (Abshirini and Koch 2016). For the purposes of this paper integration and choice value can be explained as corresponding to close-ness centrality (Bavelas, 1950) and be-tweenness centrality (Freeman, 1977), in graph theory and complex network analysis, respectively. Integration mea-sures the accessibility of a network, de-fined as the number of turns that each segment has to make to reach all other street segments in the network (Hillier et al., 2012, Hillier and Iida, 2005), com-pared to a standardized growth pattern for normalization. Choice is defined as the number of shortest paths that pass through each segment of all shortest
paths between all pairs of segments in a system (Hillier, 2009; Hillier and Iida 2005). In order to keep the calcu-lations free of excessive dispersion, as well as to be able to compare cities of different sizes, this paper uses a meth-od intrmeth-oduced by Hillier et al., (2012) to normalize angular choice (NACH) and angular integration (NAIN) values (Figure 1).
Two factors must be taken into con-sideration for this analysis. The first is the method for applying a disturbance to the system, and the second is the method of measuring the effect of this disturbance on the system. The latter concerns the method for measuring the resilience of the city according to its syntactical properties, comparing pre- and post-disturbance states (cf. Cutini, 2013). Two different methods were used to simulate disturbances in the street network. The first, applied exclusively in river cities, was ground-ed on the importance of these bodies of water to the space, and involved sim-ply cutting bridges from the street net-works. The resulting city was thereaf-ter referred to as river-cut (Figure 2a). The second method involved applying a targeted attack to both river cities and non-river cities, by removing the segments with the highest choice value measures from the network. This was done since, as Hillier (2009) explains conceptually, the foreground network can be understood as the portion of the network that binds the city togeth-er globally. From ctogeth-ertain ptogeth-erspectives,
these segments thus perform a role that is conceptually similar to that of bridges, even if their precise function is different. While this is the conceptu-al interpretation of the foreground net-work, the way it is literally defined is as the subset of segments with the highest choice values, usually the highest 10% (cf. Hillier, 2009, Hillier, 2016). Hillier finds that to a large extent, this picks up a mostly interconnected global net-work of lines extending large distances through the system, while picking out a relatively small number of segments that tend to be interlinked. This is why binding the city together is suggested as a way to conceptually understand the foreground network, even though the precise definition does not require the system to be interconnected. This measure can be compared to Hillier and Hanson’s integration core measure (1984), which is the 10% of axial lines with the highest integration values. In both cases, the percentage can and has been altered (cf. Shpuza 2013), but 10% is the most commonly used figure. In both cases, it is common for—count-er to the conceptual idea—the “fore-ground network” and “integration core” to form internally disconnected systems. Usually they appear as one larger interconnected system, and ad-ditional smaller parts that are discon-nected from the larger core or fore-ground. This is especially true when the measures are applied to local radii. To ensure comparability, and to further inform the research, this method was
Figure 1. Illustration of NACH and NAIN values for a subsample of River-cities and Non-river-cities; a) NACH for Angers (river-city), b) NACH for Modena (non-river-city), c) NAIN for Haarlem (river-city), and d) NAIN for Luton; In all figures the color range varies from light gray lines to dark gray representing the lowest and the highest values respectively.
applied to both river and non-river cit-ies. The number of segments cut in this way in a river city was the same as the number of segments forming bridges in that city. For a non-river city, it was equal to the number of segments cut in a river city of the same size. Size was defined based on the total number of segments forming a city’s network. In this way, two new types of cities, riv-er-high-cut (Figure 2b) and non-river-high-cut (Figure 2c), were produced.
To measure the effect of distur-bances on the city network, a method inspired by Koch and Miranda’s work (2013) is introduced here. The method is developed and adapted for the net-works on the scale of cities instead of on the scale of buildings, and specified to allow comparison over a large num-ber of cases. Thus, while Koch and Mi-randa (2013) discuss sameness as the extent to which a configuration is the
same before and after a disturbance, and similarity as whether it has a sim-ilar character before and after a dis-turbance, these concepts require more precision in how they are measured. They also need to be adapted for the purposes of this paper. For Koch and Miranda, the purpose of sameness is to understand whether specific spac-es retain their role in a configuration, whereas the purpose of similarity is to evaluate whether the configuration as a whole can be considered to have the same character from the point of view of spatial configuration as a social in-terface, regardless of whether or not the specific spaces have the same role. For similarity, this means investigating the degrees of distributedness in the sys-tem: in effect, whether the system be-fore and after the disturbance becomes deeper or shallower, and whether the differentiation between deep and shal-low changes—that is, are there more or fewer spaces in shallow or deep parts of the system. This can be characterized as analyzing how the system distributes centrality. Our overall approach there-by echoes that of Cutini (2013), in that it concerns itself with how the glob-al network reacts to disruptions, but differs in how we specifically test and measure this. Cutini’s (2013, p. 102:5) work is based on “the assumption that resilience, roughly speaking, is a matter of diffused richness in alternative paths from any origin to any destination” and that “its value could be somehow reproduced by the level of distribution of the shortest paths.” Cutini suggests adding bridges to river cities as a means of increasing resilience, which makes our study a comparative parallel, since we remove bridges. Additionally, we investigate a larger sample compared to Cutini’s two hypothetical cases and one real disaster case. In order to oper-ationalize these concepts for the anal-ysis of large samples of cities, we have developed two specific parameters as indicators. For sameness, we ask the extent to which the foreground net-work is defined by the same segments before and after a disturbance, and for similarity, we ask whether centrality is distributed to fewer segments (becom-ing more structured accord(becom-ing to the works of Hillier et al.,) or to more seg-ments (becoming more distributed ac-cording to the works of Hillier et al.,).
These approaches to measuring the similarity and sameness factors are then analyzed using choice and
inte-Figure 2. Illustration of NAIN values; a) River-cut (Haarlem), b) River-high-cut (Angers), and c) Non-river-high-cut (Luton).In all figures the color range varies from light gray lines to dark gray representing the lowest and the highest values respectively.
gration values. To clarify this method, in Figure 3, a river-city (Angers), and a non-river-city (Luton), are shown in different states: the current city with all specifications; the city with its bridg-es cut (labeled river-cut city); and the city with the segments with the highest choice values cut (labeled river-cut city). As seen in Figure 3, the high-est 10% of the choice value in each cir-cumstance is considered to be the size of foreground network.
Similarity is intended to measure change in global network character. This concept echoes the work of Dal-ton and Kirsan (2005) on graph iso-morphism, but is measured differently here. Table 1 illustrates the difference between the size of the foreground net-work before and after the disturbance. This is calculated based on Equation 1:
Δx=|(A-B)|⁄A (1) In which Δx represents the change in the size of the foreground network, and A and B represent the size of the foreground network before (referred to as “original” in Table 1) and after the disturbance (referred to as “bridge-cut” and “high-“bridge-cut” in Table 1), respec-tively. The size of the foreground net-work is simply equal to the number of segments forming it. It should be noted that what Equation 1 calculates is not how many times bigger or smaller the size of foreground network A is than the size of network B (this is why the absolute value is used in the equation), but rather the ratio of changes in the foreground networks before and after the disturbance.
Since the whole networks do not in-crease or dein-crease in total size, this mea-sure can be used to understand whether the distribution of centrality becomes more focused (as in a structured sys-tem) or more dispersed (as in a distrib-uted system). From this point of view, the structure of a city is judged to be more similar if the difference in the size of the foreground network before and after a disturbance tend towards zero .
Figure 3. Illustration of the foreground network; The highest top 10 percent of choice value (black lines) is considered as foreground network; Angers: a)river city, b) river-cut, c) river-high-cut. Luton: d) non-river-city, and e) non-river-high-cut. Table 1. Calculation of similarity (difference in size) for a subsample of cities; Angers is a river city and Luton is a non-river-city. Size of foreground network is number of segments with the highest 10 percent value for choice and integration property. Difference in size is calculated based on equation 1. “Original” refers to before disturbance and “bridge-cut” and “high-cut” refer to after disturbance.
Similarity is calculated in the same way for the integration value, as well.
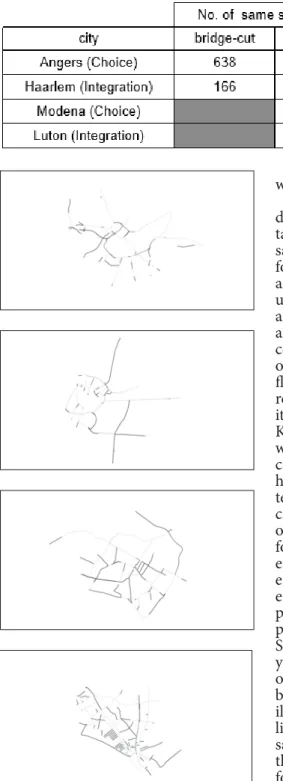
Sameness is the value showing the degree to which each city is able to re-tain and keep its functionality in the same way and in the same place as be-fore. To calculate this measure, Koch and Miranda (2013) correlated the val-ues of all vertices in a visibility graph analysis (VGA) of a building before and after a disturbance, with a higher correlation suggesting a higher degree of sameness. Sameness therefore re-flects Cutini’s idea that a network is less resilient if a disturbance moves central-ity to other nodes (2013, 102:5-102:8). Koch and Miranda additionally discuss whether the differences between states can be found locally or globally through how the differences appear in the scat-ter plots. In our analysis, we focus spe-cifically on centrality as an indicator of sameness. Therefore, the segments forming the foreground network in each city are compared before and after each disturbance to determine whether each segment that previously formed part of the foreground network is still part of this network post-disturbance. Specifically, we use a geometrical anal-ysis in order to compare the location of segments before and after a distur-bance on the foreground networks. As illustrated in Figure 4 , segments high-lighted in light gray are located in the same places in both scenarios, and are therefore categorized as same in the foreground network. Conversely, seg-ments highlighted in dark colors are not the same—they either disappeared from or were added to a foreground network after a disturbance—and are therefore categorized as changes in the foreground network. For clarity, we wish to stress here that the analysis of sameness is not about location per se, but about identifying which segments form part of the foreground network in order to be able to analyze the ratio of segments remaining in the foreground
Figure 4. Segments of foreground network changed (dark) and retain unchanged (light gray) after a disturbance; a) Angers (river-cut compared to origin for choice value), b) Haarlem (river-high-cut compared to origin for integration value), c) Modena (non-river-high-cut compared to origin for choice value), and d) Luton (non-river-high-cut compared to origin for integration value) ; origin: city before a disturbance.
Table 2. Calculation of sameness for a subsample of cities; Angers and Haarlem are river cities and the others are non-river cities. In each situation the number of same segments is compared to that for the original(before the disturbance).
network; that is, how much of the fore-ground network is constituted by the same segments as before. In a more de-tailed study using axial lines as the basis for segment generation, removal of in-dividual segments could change the ge-ometry and location of specific remain-ing segments that would still represent the same spatial unit, and the question we are investigating regards the spatial units of which the segments are ab-stract representations. Since we make use of road center line maps to generate segments, however, this is not the case. Thus, while the geometrical analysis is in principle a method for pinpoint-ing which segments are the same be-fore and after (by identifying segments with the same location), in this specific study, geometrical location and seg-ment identity correspond. This is then used to test how many segments retain their role as part of the foreground net-work, and how many newly appear or disappear from the same.
The ratio between the number of same segments and total segments in the foreground network gives us the sameness measure for the city (Table 2). This value can vary between zero and one, with a lower value pointing to lower resilience in that city in terms of sameness. A higher value, converse-ly, suggests that the city could preserve its functionality as before, indicating a structure with higher resilience.
Sameness and similarity thus test two different morphological proper-ties of the street network related to the overall idea of urban space as a social interface. Here, sameness answers how much of the interface remains the same,
and similarity measures the extent to which the city retains its configuration-al character.
4.1. The sample: Data training and area of research
Collection of spatial data for the pur-poses of comparative research is usually a time-consuming, onerous and costly process. In this paper, a large sample of cities is used with the intention of showing sufficient diversity in size, lo-cation and morphology, while main-taining some similarities. The sample is formed by two different groups of cities: those with rivers, and those without. To create the sample, we took advantage of freely distributed and editable geo-graphic maps called open street map (OSM) data (Haklay and Weber, 2008). Data acquired from this source typi-cally requires some preparation to be ready for subsequent analyses. This data is furthermore subject to the quality of the user-generated content. Because we are working with a large sample size, however, we believe that the quality and accuracy of the data after preparation is adequate. A sample of 42 river cities ranging from small (1,618 segments) to medium (86,828 segments) in size, from different European countries was collected (Table 3) and labeled river cit-ies. To be able to examine resilience in river cities specifically, a control sample of 21 cities without rivers was gathered and labeled non-river cities. This sam-ple was carefully compiled, taking the distribution of sizes and geographical locations into account in order to make the samples comparable (Table 3). 5. Results and discussion
This section begins with statisti-cal analysis, including correlation and anova (analysis of variance) tests. Correlation will show if there are sig-nificant correlations between differ-ent syntactical properties in differdiffer-ent groups of cities, and the anova test will show if there are significant differenc-es among the mean valudifferenc-es of different groups of cities. This ensures that the main and control samples are reason-ably different from each other, as well as sufficiently similar internally to be compared to one another as groups. After first establishing that the samples are relevant and statistically compara-ble, we will then proceed to investigate similarity based on the size of the fore-ground network, and sameness based on the methodology explained above. Based on these analyses, potential pat-terns in each main group of cities will be discussed.
As background to the anova test and the correlation, the key properties of space syntax for different groups are presented in Table 4. As a general pat-tern, we can see that the values for each property show a reduction after the disturbance, as would be expected. The only unexpected change is in the riv-er-cut group, which shows a dramatic increase in all properties in compari-son to the other groups that is
consis-tent throughout most of the sample. For example, all of the river-cut cities show increased mean choice values, as demonstrated in Figure 5, whereas maximum choice increased in 75% of the cases (31/42). In terms of integra-tion, there is an increase in mean in-tegration in 57% (24/42) of the cases, and in maximum integration of 64% (27/42). A table showing all value changes is provided as an appendix (Appendix Table 1). This is more close-ly examined and anaclose-lyzed in Abshirini and Koch (2016).
This may seem surprising, but it is logical given the specific kind of system information provided by the syntactic analyses. The bridges, while being im-portant connectors in the city, are few in number, and as normalized network entities form comparatively segregated sub-systems, with a limited amount of connections to other segments. The standard deviation shows the mini-mum dispersion for the mean choice value (0.012), while the maximum in-tegration value shows the maximum dispersion (0.117).
5.1 Correlation and Anova Test In order to establish the relevance of the statistics and our correlation re-search, an anova test was conducted on the syntactical properties of all groups to show if the mean of samples in the groups are different. The null hypothe-sis assumes that the samples come from populations that are not significantly differentiated by their mean values. Since differences in the mean value are critical for the rest of the comparative analyses (Abshirini & Koch, 2016), the null hypothesis needs to be rejected.
Figure 5. Dramatic increase in mean choice value of the cut cities in comparison to cities. All the river-cut cities show increased mean choice values, as demonstrated in diagram.
Table 4. Choice and integration values calculated for different groups.
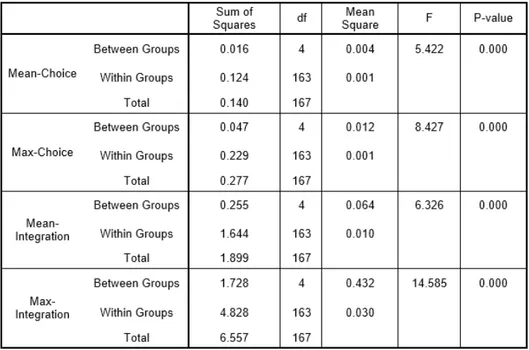
Table 5 shows the results of the anova test for all properties in all different samples, including river cities, non-riv-er cities, and all variations of these (5 groups). As illustrated in Table 5, the anova test determined significant dif-ferences between groups at the p<.001 level for the three conditions: [F(4, 163) = 5.422, p = 0.000] for mean choice value; [F(4, 163) = 8.427, p = 0.000] for maximum choice value; [F(4, 163) = 6.326, p = 0.000] for mean integra-tion value; and [F (4, 163) = 14.585, p = 0.000] for maximum integration val-ue. This validates the separation of the samples into two different groups for further analysis.
Following the anova test we made correlations between each pair (dis-turbed groups and their original groups) to see how the different dis-turbances in the cities affected the cor-relations between spatial configuration properties in these cities. The average value for each property (mean choice, maximum choice, mean integration
and maximum integration) is com-pared. Based on the results collected in Table 6, it is evident that the correlation between river-high-cut and river cities is the highest of all.
In contrast, the correlation between the non-river-high-cut group and its group of origin, non-river cities, is the lowest. It is also evident that the cor-relation between cut and river-high-cut (two different derivations of river cities based on two different types of disturbances) is relatively lower than the correlations between these groups and their group of origin (river cit-ies). This means that bridges and fore-ground networks have different effects on river cities. Additionally, the mean choice values show the highest correla-tions for almost all pairs (the only ex-ception is the correlation value (0.499) between non-river and non-river-high-cut). Maximum choice values show the lowest correlation.
Table 5. ANOVA test conducted on the samples for all properties in different groups. “df” is degree of freedom calculated based on number of groups(5) and number of all individuals(168) and F is the statistic ratio calculated by “df(between groups)/df(within groups)”. The results are rounded to 3 decimal places by SPSS.
5.2. Similarity
Based on the definition of similarity in this paper, if a city’s similarity shows a uniform change before and after the disturbance, it might suggest that the city is more stable or more resilient. This is used as an indicator of how the spatial system operates as an “interface logic” from a socio-structural point of view—that is, the extent to which the system is arranged in a distribut-ed or structurdistribut-ed manner, as under-stood through how large portions of the system participate in forming the foreground network. From this point of view, the specific streets forming the foreground are not the issue, but rath-er the structural proprath-erties of the net-work considered as a whole.
Figures 6a and 6b demonstrate that the river-cut group shows relative-ly superior similarity in comparison to the other groups in terms of the choice property (except for minimum size factor). Similarity for the integra-tion value, however, is more sporad-ic, and cannot be said to characterize any group. While river-high-cut shows 0.425 for the mean size factor, which is the highest of all, river-cut and non-river-high-cut groups show 0.872 and 0.015 for the maximum and minimum size factors, respectively. This, however, generally follows the same trend as the choice value. As an interesting find-ing, non-river-high-cut shows the best size factor for both minimum choice (0.002) and minimum integration (0.015) values.
As a general conclusion to this sec-tion, we can state that the river cities overall showed superior similarity compared to non-river cities, although minimum similarity for the choice and integration properties is better in non-river cities than in river cities.
It can be noted here that while the magnitude of change is considered in absolute values, cutting the bridges generally had a decreasing effect on the size of the foreground network in river cities as calculated via the
inte-gration value (35.7% showed an in-creased value, whereas the rest showed a decreased value). Cutting the highest value segments, on the other hand, had a less consistent effect on river cit-ies (50% increase and 50% decrease), and there was a tendency for sizes to increase in the non-river cities (76.2% increase). This becomes increasingly clear looking at the choice values, with the portion of cities with increased net-work sizes reaching 30.9%, 57.1% and 76.2%, respectively. It thus appears that the general reaction of non-river cities to the disturbance was to involve more segments in the foreground network as a response, whereas the picture for river cities was different, even taking into account the shrinking effect of cutting the bridges. Thus, while the change is generally smaller for riv-er cities than for non-rivriv-er cities, the response in non-river cities seems to be more predictable. This consistent-ly increased spread of the foreground network in the latter may have im-plications for other aspects of resil-ience, or on the effects of consecutive disturbances. It also seems that as a social interface, there was a clear ten-dency for non-river cities to become less structured by disturbances to the foreground network, whereas a notice-able portion of the river cities became more structured—that is, dependent on fewer segments to form the global city interface structure. This suggests the existence of additional research opportunities in order to determine which morphological properties lead to an increased foreground network size, and which lead to a decreased size in response to disturbances, where the sampling of river cities and non-river cities has implications for this. Conclu-sive results, however, are not within the scope of the present study.
5.3. Sameness
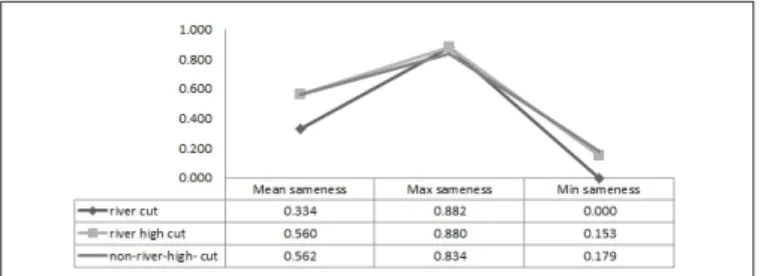
As defined in the methodology sec-tion, sameness concerns the degree to which a city retains the same segments
Figure 6. Average, minimum, and maximum similarity calculated for different groups of cities; a) Choice value, b) Integration value
forming the foreground network be-fore and after a disturbance. Figures 7a and 7b show that the results for same-ness factor do not show a significant variation from the results for similarity. For the choice property, the river-cut group has the highest sameness value. The river-high-cut group follows the same pattern closely, except in mean value (0.585), for which non-river cit-ies come out ahead (0.611). It is worth noting that while this supports Cutini’s (2013) reasoning that highly central segments are important for resilience, it indicates that bridges, specifically, are not as crucial as they may seem for global network properties, even if they are crucial from other resilience points of view. It becomes important to differentiate between the bridge as an architectural object, the role played by bridges in systems, through binding cities together across rivers, and the system role of organizing centrality. Like similarity, sameness demonstrates an irregular pattern for the integration properties, and varies from measure to measure. In Figure 7b, non-river cit-ies show the highest sameness for the mean (0.562) and minimum values (0.179). River-high-cut keeps its place in between for each individual same-ness value; this is almost identical to sameness for the choice value.
6. Conclusion
Cities are susceptible to any distur-bances to their structures, especially to their foreground networks. This is demonstrated by perceptible changes to the syntactical properties of their foreground networks before and after disturbances. These reactions can af-fect their sameness before and after a disturbance, and their similarity before and after a disturbance respectively, where the former comes close to engi-neering resilience and the latter, argu-ably, closer to ecological resilience as discussed by Holling (1996). The reac-tions of cities to disturbances, howev-er, are different, due to their different structures and morphologies. The re-sults of this paper may suggest that a river as a morphological phenomenon plays a significant role in the stability and resilience of river cities, albeit in a way that may seem counter-intuitive. This is because the correlation values show that the river-high-cut group is more connected to its group of origin than the river-cut group, which in turn is more connected than the
non-riv-er-high-cut group. The way river cities respond to disturbances in their fore-ground network (measured by their statistical mean) is more regular and more resilient than how they respond to cutting their connecting bridges, and more resilient than non-river cities in their performance as spatial syntac-tic structures for social interface. This both confirms and challenges Cutini’s (2013) work. Studying effects on cen-trality patterns before and after change is informative, but the particular use of bridges as key actors in the system is re-fined when it comes to understanding the global properties of the network. Our work also statistically tests some of Cutini’s and Koch’s and Miranda’s ideas on a large sample. The regularity found in this study, however, does not by it-self signify a higher generic resilience in river cities, since a generic measure-ment of resilience would need to take into account additional properties.
It should be noted that while we found here that the syntactic structure of public space systems seemed to be more resilient in river cities, our re-search did not supply enough evidence to confirm that this was due to the presence of a river. At this point, this remains an observation of an existing correlation rather than a conclusion of causation. Having noted this im-portant distinction as to what conclu-sions can be drawn from the research, however, the results do indicate that as socio-spatial interfaces (cf. Hilli-er and Hanson 1984, Markus 1993, Koch 2013), river cities are generally more resilient than non-river cities. This means that they have the capac-ity to maintain more similar interface logic after a disturbance is introduced, whereas the interface logic changes more in non-river cities. Maintained interface logic is understood here to mean that the system remains struc-tured or distributed to a similar degree in river cities, but grows more struc-tured or distributed in non-river cities as a result of disturbance.
Figure 7. Average, minimum, and maximum sameness calculated for different groups of cities; a) Choice value, b) Integration value
The results for sameness factor, which is the degree to which a city maintains the same foreground seg-ments after a disturbance, are almost the same as for similarity. This means that river cities show a higher capabil-ity for maintaining a configuration in which the segments of the foreground network are the same as before the dis-turbance. A simpler way to state this is that it examines if the main street remains the main street, syntactical-ly, after the disturbance is introduced. If the role of being main streets shifts to other segments, the city may need to adapt its program over time. Max-imum and minMax-imum values can help reveal the general trend of syntactic resilience in different groups. From the perspective of this paper’s methodolo-gy, the river-cut group demonstrated the highest resilience. This goes for all values except sameness for the integra-tion value, which suggests there are nu-ances elucidated by the methodology that can be investigated further in re-search to come. A finding of interest is that non-river cities tend to respond to disturbances by distributing the fore-ground network onto more segments. Which morphological properties lead to which kind of responses needs to be further investigated, as this may have significant implications for how a society would need to respond to dis-turbances both immediately, and over time. At the same time, the non-river-high-cut group shows the lowest values for all calculations, the sole exception being the integration value for same-ness. The river-high-cut group’s resil-ience falls somewhere in between the two other groups, with the exception of the integration value for sameness.
The main purpose of this paper, however, has been to present an ini-tial demonstration of the potenini-tial of methodological advances for analyzing syntactic resilience, further developing the work of Koch and Miranda (2013) and adapting it to an urban scale, since, as Esposito and Pinto (2015) point out, the work of Koch and Miranda is meth-odologically not directly applicable to urban-scale analysis. The developed method provides important informa-tion that pertains to urban resilience, while specific implications require fur-ther research.
It must be recognized in this discus-sion that the measures used here do not take into account “complete net-work break” of the system (cf. Wang,
2015) (such as when one part of a city becomes inaccessible from another), the effects of disturbances on global or specific trip lengths, or specific pro-grammatic connections between land uses, all of which would reasonably form part of a more complete review of a city system’s resilience. In addition, the results are not uniform within the different groups, and the focus in this paper has been on general trends garding the effects of rivers on city re-silience from a morphological system point of view. The focus on syntactical properties, however, highlights some specifically morphological resilience characteristics that are important to consider. Resilience is a multifacet-ed and fuzzy concept, and as complex networks, cities show complex reac-tions to disturbances in their structure that vary from one city to another. To compare or evaluate the resilience of different cities we acknowledge that, as has been noted repeatedly in resilience research (e.g. Galderisi, 2014; Rose, 2007), the use of a bundle of parame-ters is necessary. This paper proposes two such parameters as a contribution to this bundle: syntactic sameness, and syntactic similarity.
References
Albert, R., Jeong, H., and Barabá-si, A. L. (2000). Error and attack tolerance of complex networks. Na-ture, 406(6794), 378-382.
Bankes, S. C. (2010). Robustness, Adaptivity, and Resiliency Analysis. In AAAI Fall Symposium: Complex Adaptive Systems.
Bavelas, A. (1950). Communication patterns in task-oriented groups. Jour-nal of the acoustical society of America.
Carpenter, A. (2013). Disaster Re-silience and the Social Fabric of Space. In Proceedings of Ninth International Space Syntax Symposium ). Sejong Uni-versity Press.
Carter, J. G., Cavan, G., Connelly, A., Guy, S., Handley, J., and Kazmierczak, A. (2015). Climate change and the city: Building capacity for urban adaptation. Progress in Planning, 95, 1–66. http:// doi.org/10.1016/j.progress.2013.08.001 Cutini, V. (2013). The city when it trembles. Earthquake destructions, post-earthquake reconstruction and grid configuration. In: Kim, Y. O., Park, H. T., Seo, K. W. (eds), Proceedings of the Ninth International Space Syntax, Seoul: Sejong University.
On the slopes of Vesuvius: Configura-tion as a thread between hazard and opportunity, Proceedings of the 10th International Space Syntax Sympo-sium, London, UK.
Dalton, CR. and Kirsan. C. (2005). Graph Isomorphism and Genotypical Houses. Proceedings of the 5th Inter-national Space Syntax Symposium, Volume II, edited by Akkelies van Nes 15-17. Delft: Techne Press.
Dou, K., & Zhan, Q. (2011). Acces-sibility analysis of urban emergency shelters: comparing gravity model and space syntax. In Remote Sensing, En-vironment and Transportation Engi-neering (RSETE), 2011 International Conference on (pp. 5681-5684). IEEE.
Esposito A., and De Pinto V. (2015). Calm after the storm: The configura-tional approach to manage flood risk in river cities. Proceedings of the 10th In-ternational Space Syntax Symposium, London, UK.
Folke, C. (2006). Resilience: the emergence of a perspective for social– ecological systems analyses. Global en-vironmental change, 16(3), 253-267.
Freeman, L. C. (1977). A set of mea-sures of centrality based on between-ness.Sociometry, 35-41.
Galderisi, A. (2014). Urban Resil-ience: A framework for empowering cities in face of heterogeneous risk fac-tors. A|Z ITU, 11(1), 36-68.
Ghedini, C. G., and Ribeiro, C. H. (2011). Rethinking failure and attack tolerance assessment in complex net-works. Physica A: Statistical Mechanics and its Applications, 390(23), 4684-4691.
Grünewald, F., and Warner, J. (2012). Resilience: buzz word or useful concept? http://www.urd.org/RESIL-IENCE-buzz-word-or-useful?
Haan, J., Kwakkel, J. H., Walker, W. E., Spirco, J., and Thissen, W. A. H. (2011). Framing flexibility: Theorising and data mining to develop a useful definition of flexibility and related con-cepts. Futures, 43(9), 923-933.
Haklay, M., and Weber, P. (2008). Openstreetmap: User-generated street maps.Pervasive Computing, IEEE, 7(4), 12-18.
Hillier, B. (1996). Space is the Ma-chine. Cambridge, Massachusetts: Cambridge University Press.
Hillier, B. (2009). Spatial sustainabil-ity in cities: Organic patterns and sus-tainable forms. In: Koch, D., Marcus, L. and Steen, J. (eds.), Proceedings of the Seventh International Space Syntax
Symposium, Stockholm: Royal Institute of Technology, p.K01.1-K01.20
Hillier, B. (2016). What are cities for? And how does this relate to their spatial form?
Journal of Space Syntax, 6(2), 199-212.
Hillier, B., and Hanson, J. (1984). The social logic of space. Cambridge univer-sity press.
Hillier, B., and Iida, S. (2005). Net-work and psychological effects in ur-ban movement. In Spatial information theory (pp. 475-490). Springer Berlin Heidelberg.
Hillier, B., Yang, T., and Turner, A. (2012). Normalising least angle choice in Depthmap-and how it opens up new perspectives on the global and local analysis of city space. Journal of Space Syntax, 3(2), 155-193.
Holling, C.S. (1973). Resilience and stability of ecological systems. Annual Review of Ecology and Systematics 4, 1–23.
Holling, C.S. (1996). Engineering re-silience versus Ecological rere-silience. In Engineering with ecological constraints. National Academy, Washington D.C.
Holme, P., Kim, B. J., Yoon, C. N., and Han, S. K. (2002). Attack vulner-ability of complex networks. Physical Review E, 65(5), 056109.
Hu, Z., and Verma, P. K. (2011). Topological resilience of complex networks against failure and attack. In Advanced Networks and Telecom-munication Systems (ANTS), IEEE 5th International Conference on (pp. 1-6). IEEE.
Iyer, S., Killingback, T., Sundaram, B., and Wang, Z. (2013). Attack ro-bustness and centrality of complex net-works. PloS one, 8(4), e59613.
Koch, D., and Miranda Carranza, P. (2013). Syntactic Resilience. In Pro-ceedings of Ninth International Space Syntax Symposium. Seoul: Sejong Uni-versity Press.
Koch, D. (2013). The architectural interface inside out. In Proceedings of Ninth International Space Syntax Sym-posium. Seoul: Sejong University Press. Latora, V., and Marchiori, M. (2003). Economic small-world behavior in weighted networks. The European Physical Journal B-Condensed Matter and Complex Systems, 32(2), 249-263.
Leichenko, R. (2011). Climate change and urban resilience. Current Opinion in Environmental Sustainabil-ity, 3(3), 164–168.
Power: Freedom and Control in the Ori-gin of Modern Building Types.
Marcus, L., and Colding, J. (2014). Toward an integrated theory of spatial morphology and resilient urban sys-tems. Ecology and Society, 19(4). http:// doi.org/10.5751/ES-06939-190455
Pickett, S. T. A., Cadenasso, M. L., and Grove, J. M. (2004). Resilient cit-ies: meaning, models, and metaphor for integrating the ecological, so-cio-economic, and planning realms. Landscape and Urban Planning, 69(4), 369–384. http://doi.org/10.1016/j. landurbplan.2003.10.035
Read, D. (2005). Some observations on resilience and robustness in human systems. Cybernetics and Systems: An International Journal, 36(8), 773-802.
Reid, R., and Demarin, P. (2013) The importance of urban resilience, World Economic Forum, http://forumblog. org/2013/01/the-importance-of-ur-ban-resilience/#disqus_thread, Ac-cessed 8/20/2015.
Rose, A. (2007). Economic resil-ience to natural and man-made di-sasters: Multidisciplinary origins and contextual dimensions. Environmental Hazards, 7, 383-398.
Sari, F. and Kubat, A.S. (2011), Syn-tactic properties of evacuation and access routes in earthquake vulnera-ble settlements. In: Greene, M., Reyes, J. and Castro, A. (eds.), Proceedings of the 8th International Space Syntax Symposium, Santiago de Chile: PUC, p.8038:1-8038:11.
Shpuza, E. (2006). Floorplate Shapes and Office Layouts: A model of the ef-fect of floorplate shape on circulation integration. Atlanta: Georgia Institute of Technology.
Shpuza E. (2007). Urban shapes and urban grids: a comparative study of Adriatic and Ionian coastal cities. Pro-ceedings of the 6th Space Syntax Sym-posium, 9.1-9.22. Istanbul.
Shpuza, E. (2011). A coupled
con-figurational description of boundary shape based on distance and direction-ality. Artificial Intelligence for Engineer-ing Design, Analysis and manufactur-ing, 25(04), 357-374.
Shpuza, E. (2013). Foreground Net-works during Urban Evolution. In Pro-ceedings of Ninth International Space Syntax Symposium. Sejong University Press.
Shpuza, E and Peponis, J. (2005). “Floorplate Shapes and Office Layouts.” In Proceedings to the 5th Internation-al Space Syntax Symposium, Volume II, edited by Akkelies van Nes, 89-102. Delft: Techne Press.
TERI. (2009), ‘Nanotechnology De-velopments in India: a Status Report’, The Energy and Resources Institute, New Delhi.
Turner, A. (2007). From axial to road-center lines: a new representa-tion for space syntax and a new model of route choice for transport network analysis. Environment and Planning B: Planning and Design, 34(3), 539-555.
United Nations International Strate-gy for Disaster Reduction (UNISDR), (2009). Geneva, Switzerland.
United Nations, Department of Eco-nomic and Social Affairs, Population Division (2014). World Urbanization Prospects: The 2014 Revision, High-lights (ST/ESA/SER.A/352).
Wang, J. (2015). Resilience of Self-Organised and Top-Down Planned Cities—A Case Study on Lon-don and Beijing Street Networks. PLoS one, 10(12), e0141736.
Weichellgartner, J., and Kelman, I. (2014). Challenges and opportunities for building urban resilience. A|Z ITU, 11 (1), 20-35.
Wilbanks, T. (2007). “The Re-search Component of the Communi-ty and Regional Resilience Initiative (CARRI)”. Presentation at the Natural Hazards Center, University of Colora-do-Boulder.