This is a submitted version of a paper published in Energy.
Citation for the published paper:
Song, H., Dotzauer, E., Thorin, E., Yan, J. [Year unknown!]
"Techno-Economic Analysis of a Straw-Based Biorefinery System for Power, Heat,
Pellet and Bioethanol Production"
Energy
Access to the published version may require subscription.
Permanent link to this version:
http://urn.kb.se/resolve?urn=urn:nbn:se:mdh:diva-13187
1 2 3 4 5 6 7 8 9 10 11 12 13 14 15 16 17 18 19 20 21 22 23 24 25 26 27 28 29 30 31 32 33 34 35 36 37 38 39 40 41 42 43 44 45 46 47 48 49 50 51 52 53 54 55 56 57 58 59 60 61 1 1
Techno-Economic Analysis of a Straw-Based Biorefinery System for
Power, Heat, Pellet and Bioethanol Production
Han Song1 , Erik Dotzauer1, Eva Thorin1, Jinyue Yan1,2*
1. School of Sustainable Development of Society and Technology, Mälardalen University, SE-72123 Västerås, Sweden
2. School of Chemical Science, Royal Institute of Technology, SE-100 44 Stockholm, Sweden
*Corresponding author:
Tel: +46 (0)21 103134; Fax: +46 (0)21 101370; E-mail: jinyue.yan@mdh.se;
Full post address: School of Sustainable Development of Society and Technology, Mälardalen University, SE-72123 Västerås, Sweden.
Abstract: Bioethanol is considered an alternative to fossil fuels in the transportation sector. The
use of pellets for heating is another efficient way to mitigate greenhouse gas emissions. This paper evaluates the techno-economic performance of a biorefinery system in which an existing combined heat and power plant integrates with the productions of bioethanol and pellets using straw as feedstock. A two-stage acid hydrolysis process for bioethanol production is used, and two different drying technologies are chosen for drying hydrolysis solid residues. A sensitivity analysis on critical parameters, such as the bioethanol selling price and feedstock price, is performed. The bioethanol production cost is also calculated for two cases at the conditions of ten-year and five-year payback time. The results show that the first case is a more feasible economic configuration at present, having an over 30% production cost reduction compared with the conventional cogeneration plants of bioethanol and solid fuel.
Key words: combined heat and power, pellet, biorefinery, drying, bioethanol, straw.
Classification:
9.060: Biomass
17.030: Small-scale RES Systems
17.050: Combined Heat and Power CHP
1 2 3 4 5 6 7 8 9 10 11 12 13 14 15 16 17 18 19 20 21 22 23 24 25 26 27 28 29 30 31 32 33 34 35 36 37 38 39 40 41 42 43 44 45 46 47 48 49 50 51 52 53 54 55 56 57 58 59 60 61 Abbreviation List
Abbreviation Full name
BSP Bioethanol selling price
CHP Combined heat and power
DH District heating
EHV Effective heating values
HHV Higher heating values
HP High pressure
HSR Hydrolysis solid residues
IRR Internal return rate
LP Low pressure
MC Moisture content
NPV Net present values
PB Payback
1. Introduction
Ethanol from biomass has become an increasingly popular alternative to fossil fuels in the transportation sector. However, using food-based feedstock for the production of bioethanol (first generation biofuels) might result in undesirable competition with food supply [1]. A switch to a more abundant and inedible plant material should help to alleviate the pressures on food crops. Large portions of these planted materials are made up of complex carbohydrates, such as cellulose and hemicelluloses, which can be converted to fermentable sugars and bioethanol by microorganisms.
Various lignocellulosic biomass, such as the agricultural residues of straw, can be the potential feedstock for bioethanol production. Straw is an abundant lignocellulosic waste material across the world. As estimated, the global productions of rice straw and wheat straw are up to 731 Mt/y [2] and 354 Mt/y [3], respectively. Furthermore, the straw has high cellulose and hemicellulose contents that can be readily hydrolyzed into fermentable sugars. In terms of chemical composition, the straw predominantly contains cellulose (32–47 %), hemicellulose (19–27 %) and lignin (5–24 %) ([4, 5].
At present, in addition to the cost of the feedstock, the economic feasibility of bioethanol also strongly depends on the amount of energy needed during the production process. To improve the economic performance and the energy efficiency of bioethanol production, relative to traditional fossil fuels production from the crude oil, a number of optimization steps have been proposed concerning the purification of bioethanol; concentration and de-watering of bioethanol by distillation that require especially large amounts of thermal energy [6, 7, 8, 9] and further exploitation of byproducts [10, 11, 12]. To cope with this high energy demand, and increase energy efficiency and decrease production costs, the bioethanol production integrated with other industrial processes provides the opportunity to improve the techno-economic performance, especially for small-scale bioethanol plants [7].
1 2 3 4 5 6 7 8 9 10 11 12 13 14 15 16 17 18 19 20 21 22 23 24 25 26 27 28 29 30 31 32 33 34 35 36 37 38 39 40 41 42 43 44 45 46 47 48 49 50 51 52 53 54 55 56 57 58 59 60 61 3
Improving the existing combined heat and power (CHP) plants by polygeneration has been studied for combined heat, power and cooling productions. For example, the experiments and simulation were conducted on a tri-generation system of a CHP plant using a micro-turbine integrated with an absorption chiller [13]. The results showed that the primary energy utilization efficiency could be increased by over 15%, compared to separate plants. Another study investigating this kind of system had discovered that integration of cooling with a CHP plant might not offer the desired results in terms of primary energy consumption or lower operation cost, but resulted in reduction of greenhouse gas emissions [14]. Few studies were presented in the literature that focused on the integration of bioethanol production into an existing operated CHP plant. The previous studies [6, 9] showed that integration of bioethanol production with an existing CHP plant could be beneficial from both an energy and economic point of view. If a new small-scale CHP plant can be installed for the integration with an existing bioethanol plant, the residual energy from production process could be utilized as much as possible while reducing production costs and mitigating CO2 emissions [15]. Further, the pellet production integrated
with an existing CHP plant [16] offered better system performance, such as longer operation time of the CHP plant and reduction of CO2 emissions, compared with conventional plants. An
integrated system of bioethanol and solid fuel production were studied in [12, 17] for a lower production cost than the stand-alone plants. A methodology for economic assessment and comparison of the integrated CHP plants was also presented by [18], where the influence of external steam demands from various industrial units on the CHP plants was investigated by case studies. However, its predicted economic results strongly depended on the how often the steam demand was needed from the external users.
In this paper, technical and economic analyses are made in detail for the studied biorefinery system with productions of bioethanol and pellet integrated with an existing CHP plant. The aim is to investigate the techno-economic feasibility of the integrated biorefinery system under given payback time.
2. Methods and Objectives
In this study, the computer-based tool, IPSEpro, is used to simulate the process and system through the Process Simulation Environment (PSE) with a focus on the mass and energy balances.First, the whole system is divided into functional units that are interconnected physically by the mass streams. The energy and mass balance equations are constructed for each unit and then imbedded into the models through IPSEpro. The models are then validated with data collected from an existing CHP plant in Sala, Sweden and the literature.
In order to analyse the cost performance, an economic assessment is conducted for the biorefinery system. A sensitivity analysis on critical parameters of the bioethanol selling price (BSP) and feedstock price is also performed in terms of the internal return rate (IRR) and net present values (NPV) under given payback time. The costs for bioethanol production in the biorefinery system are then calculated and analyzed in two different cases of ten-year and five year payback. The results are compared with the conventional cogeneration plants of bioethanol and solid fuels without integrated with the existing CHP plants.
1 2 3 4 5 6 7 8 9 10 11 12 13 14 15 16 17 18 19 20 21 22 23 24 25 26 27 28 29 30 31 32 33 34 35 36 37 38 39 40 41 42 43 44 45 46 47 48 49 50 51 52 53 54 55 56 57 58 59 60 61
3. Description of the Studied Biorefinery System
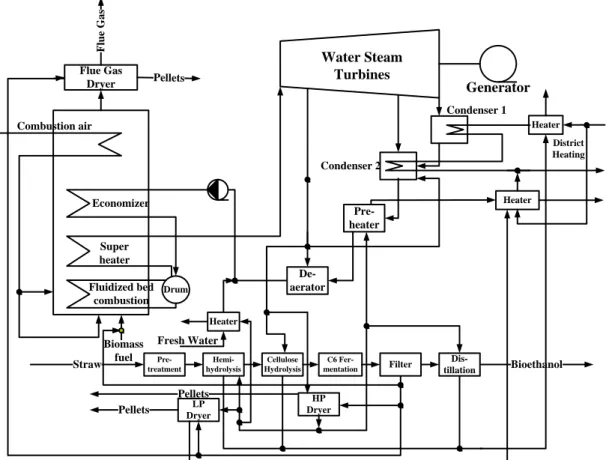
A studied biorefinery system is configured by integrating bioethanol production into an existing CHP plant with a drying process to produce power, heat, pellet and bioethanol, as shown in Fig. 1. The integrated system consists of three main subsystems, namely, CHP, bioethanol production, and drying systems. More detailed descriptions of the three subsystems are presented as follows.
3.1 CHP Plant
The CHP plant, located in Sala, Sweden, operates on 100 % solid biomass like straws and wood chips, and has the capacity of 9 MW of power and 22 MW of heat with the main stream data of 480 °C and 80 bar at full load. The CHP plant consists of four air pre-heaters, two economizers, three super-heaters, one fluidized bed combustion chamber and one steam turbine. The air is separated into two streams, each of which is pre-heated by the flue gas to over 100 °C. The air is then combined into one stream before the combustion chamber, where the biofuel is burned to produce the high-temperature flue gas. Two economizers are used to pre-heat the incoming feeding water before it is vaporized in the walls of the boiler, and the steam is super-heated in three steps before expansion in the four-stage steam turbine. The steam turbine has three extractions of steam after the first, second and third stages for the de-aerator, bioethanol production, drying process, return feeding water heat exchanger and steam condenser.
3.2 Process of Bioethanol Production from Straw
In the bioethonal production subsystem, agricultural residues such as straw are used as feedstock. Physical pre-treatment is done first to limit the size of the straw to between a few millimeters and a few centimeters [19]. This step destroys the cell structure and makes the biomass more accessible to the subsequent chemical and biological treatments. The sized straw is then impregnated with dilute sulfuric acid, followed by a hemi-hydrolysis process. In this process, low pressure (LP) steam from the high pressure (HP) dryer is introduced to break down and remove the surrounding hemicelluloses and lignin, because, combined with steam explosion, acid hydrolysis can give a higher sugar yield ([17, 20]. As a result, the microfibers of cellulose are modified, and all or most part of the hemicelluloses with lignin is removed. The soluble sugars are primarily xylose, mannose, arabinose, and galactose. A small portion of the cellulose may be converted into glucose. However, the cellulose bulk is hydrolyzed in a separate step, called the hydrolysis process, which is considered to be the main hydrolysis step. In this hydrolysis, the HP steam [21] is utilized to obtain high C6 sugar yields and convert cellulose to glucose (Eq. 1):
6 10 5 2 6 12 6
(
C H O
)
n
nH O
nC H O
(1) This reaction can be catalyzed by dilute acid, concentrated acid or enzymes (cellulase). The mash product must then be cooled by water before going to the fermentation reactor. Here, only C6 sugars, mainly glucose from cellulose, are targeted to be converted to bioethanol (see Eq. 2) due to the costly biochemical conversion process from the hemicelluloses to ethanol [6]. Therefore, it is not included in this study.6 12 6
2
2 52
21 2 3 4 5 6 7 8 9 10 11 12 13 14 15 16 17 18 19 20 21 22 23 24 25 26 27 28 29 30 31 32 33 34 35 36 37 38 39 40 41 42 43 44 45 46 47 48 49 50 51 52 53 54 55 56 57 58 59 60 61 5
After membrane filtration, the hydrolysis solid residues (HSR) are collected with high moisture content (MC) on wet basis (w.b.) and utilized as feedstock for the pellet production after being dried. The remaining broth from the filter operation is distilled by the water steam, allowing the bioethanol product to be obtained. The stillage can also be collected for other uses [22] or disposed through special treatments, which is not included in this paper.
3.3 Drying Process
The drying process is performed by three dryers – one flue gas dryer and two steam dryers. After the economizers of the CHP plant, the exhaust flue gas has a temperature of over 140 °C, from which the thermal energy down to the dew point can be utilized for drying purposes. The MC of the feedstock is evaporated into the exhaust flue gas to form the secondary exhaust flue gas with a higher MC [10].
In fact, the steam dryers mean a two-stage drying process with different pressures. The HP dryer uses the super-heated steam that is extracted from the first stage of the turbine; after, the pressure drops to LP with a temperature over the saturation point. The LP steam out of the HP dryer is divided into four streams for the LP dryer, hemi-hydrolysis, feeding water pre-heater and distillation process (as previously described by [23]), respectively. In the LP dryer, the LP water steam is continuously used to dry the feedstock. The outlet steam, at atmospheric pressure, from the LP dryer is then condensed to heat the district heating (DH) network.
For all dryers, the drying medium contacts the wet feedstock directly in the dryer in countercurrent flow, so that the feedstock can move across an increasingly dried environment with a higher temperature for more effective dehydration [24]. The total energy input is equal to the enthalpy difference of the drying medium between the inlet and outlet of the dryer. Energy balance equations used are from Song et al. [10].
4. Process Models and Input Data Assumptions
The main energy demanding steps by descending order are the steam dryer, distillation, hydrolysis and hemi-hydrolysis, for which the models are referred to Starfelt et al. [9] with some modifications, except the dryer model.
4.1 CHP Plant Model
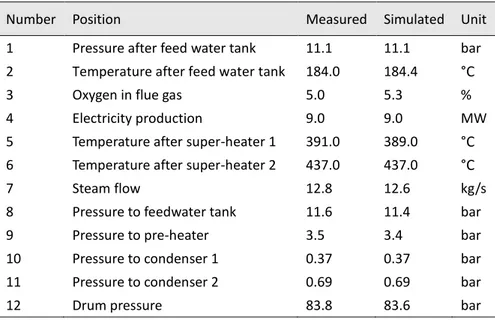
The main functional unit models of the CHP plant are taken from the previous studies [6, 9, 10]. The model is validated by operation data collected from the CHP plant by field study and Starfelt et al. [6], seen in Table 1. As a result, the simulated results show satisfactory agreement with data measured at the plant.
4.2 Bioethanol Plant Model
The configurations of the pilot plant in Örnsköldsvik of Sweden [25] is used for modeling the bioethanol production process, which uses the two-stage acid hydrolysis technology for bioethanol production with the feedstock of woody biomass and straw. Some of the operational data for the simulation are also referred to the plant in Oregon [21]. Mechanical pre-treatment of the feedstock is not considered in this model.
1 2 3 4 5 6 7 8 9 10 11 12 13 14 15 16 17 18 19 20 21 22 23 24 25 26 27 28 29 30 31 32 33 34 35 36 37 38 39 40 41 42 43 44 45 46 47 48 49 50 51 52 53 54 55 56 57 58 59 60 61
4.3 Dryer Model
To lower the MC of HSR from 0.6 to 0.1 kg/kg or less, the outlet temperature for the flue gas dryer is set to 100 °C. For the super-heated steam dryers, the outlet temperature is 5 °C higher than the saturation point. The energy balance is shown by Song et al. [10] in equations (3) - (6), and the results for this model show good agreement with the reference [24]:
,
(
, ,)
,(
, ,);
out
in
t
f in f in f out d b out t w w out w in
m
h
h
E
m
Cpdt
m h
h
(3) , ,;
b in b out wm
m
m
(4)(1
)
;
oven wCp
Cp
MC
Cp MC
(5)1.114 0.00485 ;
ovenCp
t
(6) , f inm
: mass flow rate of incoming drying medium, kg/s;f
h
: enthalpy of flue gas, kJ/kg;d
E
: drying efficiency;b
m
: mass flow rate of biomass (HSR), kg/s;Cp
: specific heat capacity of wet biomass (wet HSR), kJ/kg·K;w
m
: mass flow rate of moisture evaporated into steam, kg/s;w
h
: enthalpy of water, kJ/kg;oven
Cp
: specific heat capacity of oven-dry biomass, kJ/kg·K;MC
: moisture content in wet biomass, kg/kg;w
Cp
: specific heat capacity of water, assumed as a constant of 4.2 kJ/kg·K;t
: temperature, °C;4.4 Input Data Assumptions
The process flow sheet diagram of the biorefinery is illustrated in Fig. 2. The CHP plant is assumed to be able to handle extraction for bioethanol production and the drying process.
The feedstock of wheat straw in the Mälardalen region with a MC of 0.45 kg/kg is chosen for this simulation. The HSR from bioethanol production have the MC of 0.6 kg/kg and are dried to 0.1 kg/kg for pellet production [26]. The effective heating values (EHV) of all biomass are calculated as follows:
1 2 3 4 5 6 7 8 9 10 11 12 13 14 15 16 17 18 19 20 21 22 23 24 25 26 27 28 29 30 31 32 33 34 35 36 37 38 39 40 41 42 43 44 45 46 47 48 49 50 51 52 53 54 55 56 57 58 59 60 61 7
=
1
2.447
2.447
9.01 1
100
100
100
100
w
w
h
w
EHV HHV
[MJ/kg, w.b.] (7)w
: MC of the biomass in wt% (w.b.);h
: hydrogen content of biomass in wt% (oven-dry basis);The Higher Heating Value (HHV) is expressed as:
0.349
C1.1783
H0.1005
N0.0151
S0.1034
O0.0211
AshHHV
X
X
X
X
X
X
[MJ/kg, oven-dry basis] (8) i
X
: weight percentage of element in biomass, wt% (oven-dry basis);The energy loss of the drying process in the flue gas dryer is assumed to be 9.44 % [24, 27], including radiation, leakage and other losses. However, the super-heated steam dryer is more complex, and even a small leakage is devastating to its energy efficiency. Thus, an energy loss of 7.08% in the steam dryer is assumed to be without loss associated with the leakages [24]. Auxiliary power in the bioethanol production, such as power for pumps and blenders, is not considered in the simulation; however, it is included in the working costs in the economic calculation. All the input data for the biorefinery system are summarized in Table 2.
4.5 Resource Availability of Straws for the Biorefinery System
The city of Sala is located in the center of the Mälardalen region, one of the most important agricultural districts of Sweden, for which how to develop a fossil-free energy system has been studied [29]. The crop-to-residue ratio is from the reference [8]. The total amount of straws produced in the Västmanland county in Mälardalen is 215 kt (kiloton) per year, estimated from the Sweden Statistics [30].
The composition of wheat straw is selected as a representative of all of the residual straw to be used as feedstock for the CHP plant and bioethanol production. The composition of wheat straw in the references [11, 12] has been used for the simulation in this paper.
5. Economic Evaluation Criteria
To give a clear understanding of how the bioethanol selling price (BSP) influences the economic performance of the biorefinery system and the production costs distribution, an economic analysis method is used under the assumption that the new plants for bioethanol and pellet productions are built for integration with an existing CHP plant.
5.1 Total Project Investment Calculation
To simplify the calculation, all kinds of wheat straws used in this study are assumed to have the same compositions and physical properties. Equipment sizing follows from the process simulation models (heat exchangers, columns) and from literature data of US DOE [31]. From the process
1 2 3 4 5 6 7 8 9 10 11 12 13 14 15 16 17 18 19 20 21 22 23 24 25 26 27 28 29 30 31 32 33 34 35 36 37 38 39 40 41 42 43 44 45 46 47 48 49 50 51 52 53 54 55 56 57 58 59 60 61
design shown in Fig. 2, the equipment purchasing and installation costs are obtained from related literature and vendor quotations when possible. The installation investment costs for separate units are added up. A simplified investment method [32] is used to estimate the total project investment (TPI), expressed by Equation 9:
others
TPI
TEC
TIC
Cost
; (9)TPI
: total project investment;TEC
: total equipment cost;TIC
: total installation cost;others
Cost
: other costs.All the costs reflect the case study based on the simulated process design. If processing changes are made and equipment sizes change, the equipment costs do not need to be re-totaled in detail; instead, the following exponential scaling expression with a factor exp = 0.7 is used [32]:
exp new new original original
Size
Cost
Cost
Size
(10)Primary estimated costs for bioethanol and pellet plants are reported in Table 3.
5.2 Income and Payback Analysis
5.2.1 Assumption and Production Costs Analysis
The economic analysis is carried out with the following assumptions: – interest rate: 5 %;
– load: 300 days/year;
– investment path: 100 % in first year; – working cost: 10 % of TPIs [19];
– corporate income tax rate in Sweden: 26.3 % [34].
The analysis is presented in terms of an internal rate of return (IRR) and a net present value (NPV). Once the capital and operation costs for the plant are established, a discounted cash flow analysis is performed to determine the project IRR and NPV using the costs of bioethanol and pellet production (Table 4). The bioethanol production cost is also compared with the conventional cogeneration plants without integration with the existing CHP plants. Income is generated from selling pellets, heat for DH and bioethanol; the former two can be found in Table 5. The analysis of the BSP’s influence on the biorefinery system economic performance is also shown.
5.2.2 Payback Time
Two cases have been investigated based on the calculations and assumptions above. The first one (PB10) considers a technical plant life of 15 years and a depreciation time and payback time of 10 years. The second one (PB5) assumes a plant life of 10 years and 5 years for both the
1 2 3 4 5 6 7 8 9 10 11 12 13 14 15 16 17 18 19 20 21 22 23 24 25 26 27 28 29 30 31 32 33 34 35 36 37 38 39 40 41 42 43 44 45 46 47 48 49 50 51 52 53 54 55 56 57 58 59 60 61 9
depreciation and payback times. The BSP is varied and plotted with IRR and NPV, while the feedstock price is plotted with BSP for two cases.
6. Results and Discussions
The results of the economic analysis are summarized as follows: 1. The influence of BSP on NPV for a given or required IRR;
2. The influence of BSP on IRR under the assumption that the NPV is zero at the end of the payback time;
3. The influence of feedstock price on BSP when an IRR of 10 % is given and the NPV is zero at the end of the payback time;
4. Bioethanol production cost distribution before tax for the two cases of payback time.
When a given IRR of 10 % is considered for the case of PB10, the present market BSP must be higher than 7.69 SEK/l to get a positive NPV. For the case of PB5, a minimum BSP of 13.45 SEK/l is needed to ensure a positive NPV at the end of payback time, as shown in Fig. 3. Although, for the case of PB5, the 13.45 SEK/l is relatively high compared to the present market price of 5.6 SEK/l [36], it has great potential to be acceptable if the prices on fossil fuels may rise by over 50% (over 850 SEK/barrel for crude oil), as estimated by [37]. If a longer payback time is assumed, a lower market BSP can be obtained to get a positive NPV for a 10 % IRR. If the NPV is considered to be zero at the end of the payback time, the BSP needs to be at or above 8.76 SEK/l to ensure a positive IRR for the case of PB5 (Fig.3 ). However, in the case of PB10, a spot-price of 5.6 SEK/l in Europe for the BSP with an IRR of 5.76 % represents a very possible case that may approach a real-market situation (Fig. 4). In practical operations, payback times of longer than 10 years or an expected IRR lower than 5.76 % are reasonable to reach economic feasibilities for the simulated biorefinery system (Fig. 4).
In the studied biorefinery system, the feedstock cost covers more than 50 % of the operation cost and are one of the key parameters that influence on the BSP. For the cases of PB10 and PB5, the BSP has to be over 7.69 SEK/l and 13.45 SEK/l (Fig.3), respectively, to obtain a positive NPV at the end of the payback time if the present market price of feedstock, 0.48 SEK/kg, is applied. If the feedstock price can be reduced by 41.7 %, from 0.48 to 0.28 SEK/kg, a near-to-market BSP of 5.6 SEK/l could possibly be realized for the case of PB10 in this system with 10 % of IRR and zero NPV at the end of payback time (Fig. 5).
The production cost is calculated through conversion of income, operation and capital costs. The only cost difference for the two cases is the depreciation of assets because of different payback times, which results in final bioethanol production costs of 2.56 SEK/l and 7.72 SEK/l for PB10 and PB5 before tax, respectively (Fig. 6). Compared with the conventional cogeneration plants without CHP plant integration, whose production costs are 5.49 SEK/l, 5.45 SEK/l, 4.37 SEK/l [11] and 4.54 SEK/l, 4.25 SEK/l, 4.15 SEK/l [12] for feedstock of Salix, Corn Stover and Spruce respectively, the case of PB10 is more competitive because of the greater than 30 % reduction in
1 2 3 4 5 6 7 8 9 10 11 12 13 14 15 16 17 18 19 20 21 22 23 24 25 26 27 28 29 30 31 32 33 34 35 36 37 38 39 40 41 42 43 44 45 46 47 48 49 50 51 52 53 54 55 56 57 58 59 60 61
production costs. For this study, Figs. 4 and 5 show that a payback time longer than 10 years is more reasonable for the present technical and economic situation. The income from co-products is also very important for reducing the cost of bioethanol production from straw, contributing to a reduction of costs with 85 % for PB10 and 66 % for PB5.
The simulation results show that the annual consumption of straw for the biorefinery system is over 154 kt per year; the overall capacity and efficiency of the studied system for this operation point is shown in Table 6. However, the estimated value is approximately 103 kt per year when considering the load variation during a year. The nearest sub-region of Västmanland can produce 215 kt of straw per year. From an ecological and sustainable point of view, 57 % of the total produced amount of agricultural residues can be considered available for energy production [38]. In addition, if the consumption of bioethanol can be located around the production site areas, the logistical cost for feedstock and bioethanol fuel can be reduced significantly, which can make bioethanol more competitive with traditional fossil fuels and imported ethanol. In further research on the performance of the biorefinery system during an entire year, the fact that more power can be produced during low-heat-load time and that the operation time during a year can be extended for the CHP plant should be considered. Whether this system can make significantly more profits to reduce the production cost of bioethanol despite the lack of income from heating during warm periods is of interest for future studies.
7. Conclusions
The ten-year payback (PB10) has a bioethanol selling price (BSP) of 7.69 SEK/l for a 10 % internal rate of return (IRR) and zero net present values. If a lower IRR of 5.76 % can be accepted for the PB10, the BSP can be further reduced to a European spot-price of 5.6 SEK/l, which could also be realized by reducing the feedstock price to 0.28 SEK/kg. The PB10, with a production cost of 2.56 SEK/l, is considered a feasible economic configuration under present situations, compared with conventional cogeneration plants of bioethanol and solid fuels without integration with existing CHP plants.
Acknowledgements
The Swedish Energy Agency, ENA Energi in Enköping, Sala Heby Energi, China Scholarship Council, and Mälardalen University are acknowledged for their funding. This study is also part-funded by the European Union (European Regional Development Fund) through the project of Regional Mobilizing of Sustainable Waste-to-Energy Production (REMOWE), which is a part of the Baltic Sea Region program.
References
[1]Binod P, Sindu R, Singhania R.R, Vikram S, Devi L, Nagalakshmi S, Kurien N, Sukumaran R.K, Pandey A. Bioethanol production from rice straw: An overview. Bioresour Technol 2010;101: 4767–4774.
[2]Kim S, Dale B.E. Global potential bioethanol production from wasted crops and crop residues. Biomass Bioenergy 2004; 26: 361–375.
1 2 3 4 5 6 7 8 9 10 11 12 13 14 15 16 17 18 19 20 21 22 23 24 25 26 27 28 29 30 31 32 33 34 35 36 37 38 39 40 41 42 43 44 45 46 47 48 49 50 51 52 53 54 55 56 57 58 59 60 61 11
wheat straw and SSF with low yeast and enzyme loadings for bioethanol production. Biomass Bioenergy 2008; 32: 326 – 332.
[4]Roberto I.C, Solange I. Mussatto S.I, Rodrigues R.C.L.B. Dilute-acid hydrolysis for optimization of xylose recovery from rice straw in a semi-pilot reactor. Ind Crops Prod 2003;7: 171–176. [5]Sun Y, Cheng J.J. Dilute acid pre-treatment of rye straw and Bermuda grass for ethanol
production. Bioresour Technol 2005; 96: 1599–1606.
[6]Starfelt F, Daianova L, Yan J, Thorin E, Dotzauer E. Increased renewable electricity production in combined heat power plants by introducing ethanol production. The First International Conference on Applied Energy (ICAE09), Hong Kong, 2009.
[7]Pfeffer M, Wukovits W, Georg B, Anton F. Analysis and decrease of the energy demand of bioethanol-production by process integration. Appl Therm Eng 2007; 27:2657–2664.
[8]Reith J.H, Veenkamp J.M, Ree R.V. Co-production of bio-ethanol, electricity and heat from biomass wastes. The First European Conference on Agriculture & Renewable Energy, RAI, Amsterdam, The Netherlands, 2001.
[9]Starfelt F, Thorin E, Dotzauer E, Yan J. Performance evaluation of adding ethanol production into an existing combined heat and power plant. Bioresour Technol 2010;101: 613–618. [10]Song H, Starfelt F, Daianova L, Yan J. Influence of Drying process on the biomass-based
polygeneration system of bioethanol, power and heat. Appl Energy 2011; in press.
[11]Wingren A, Galbe M, Zacchi G. Techno-economic evaluation of producing ethanol from softwood: comparison of SSF and SHF and identification of bottlenecks. Biotechnol Progr 2003;19:1109-1117.
[12]Sassner P, Galbe M, Zacchi G. Techno-economic evaluation of bioethanol production from three different lignocellulosic materials. Biomass Bioenergy 2008;32:422 – 430.
[13]Ge Y.T, Tassou S.A, Chaer I, Suguartha N. Performance evaluation of a tri-generation system with simulation and experiment. Appl Energy 2009; 86: 2317–2326.
[14]Fumo N, Mago P.J, Chamra L.M. Emission operational strategy for combined cooling, heating, and power systems. Appl Energy 2009; 86;2344–2350.
[15]Eriksson G, Kjellströb B. Assessment of combined heat and power (CHP) integrated with wood-based ethanol production. Appl Energy 2010; 87:3632–3641.
[16]Wahlund B, Yan J, Westermark M. A total energy system of fuel upgrading by drying biomass feedstock for cogeneration: a case study of Skellefteå bioenergy combine. Biomass Bioenergy 2002; 23:271–281.
[17]Sassner P, Mårtensson C.G, Galbe M, Zacchi G. Steam pre-treatment of H2SO4-impregnated
Salix for the production of bioethanol. Bioresour Technol 2008;99: 137–145.
[18]Giaccone L, Canova A. Economical comparison of CHP systems for industrial user with large steam demand. Appl Energy 2009; 86: 904–914.
[19]Wooley R, Ruth M, Sheehan J, Ibsen K, Majdeski H, Galvez A. Lignocellulosic biomass to ethanol—Process design and economics utilizing co-current dilute acid prehydrolysis and enzymatic hyrolysis—Current and futuristic scenarios, Report No. TP-580-26157. National Reneawable Energy Laboratory. Golden Colorade USA, 1999.
[20]Söderström J, Pilcher L, Galbe M, Zacchi G. Two-step steam pre-treatment of softwood by dilute H2SO4 impregnation for ethanol production. Biomass Bioenergy 2003; 24:475–486.
[21]Aden A, Wooley R, Yancey M. Oregon Biomass-to-Ethanol Project: Pre-feasibility study and modeling results. National Renewable Energy Laboratory, 2000.
1 2 3 4 5 6 7 8 9 10 11 12 13 14 15 16 17 18 19 20 21 22 23 24 25 26 27 28 29 30 31 32 33 34 35 36 37 38 39 40 41 42 43 44 45 46 47 48 49 50 51 52 53 54 55 56 57 58 59 60 61
[22]Callander I.J, Clark T.A, McFarlane P.N, Mackie K.L. Anaerobic digestion of stillage from a pilot scale wood-to-ethanol process. II.Laboratory-scale digestion studies. Environ Technol Letters 1986;7:397-412.
[23]Wingren A, Galbe M, Zacchi G. Energy considerations for a SSF-based softwood ethanol plant. Bioresour Technol 2008; 99;2121–2131
[24]Meza J, Gil C.A, Gonzalez A. Drying costs of woody biomass in a semi-industrial experimental rotary dryer. 16th European Conference & Exhibition on Biomass for Energy, Biomass Resources, Valencia, Spain, 2008.
[25]SEKAB, Official website. http://www.sekab.com, 2010.
[26]Thek G, Obernberger I. Wood pellet production costs under Austrian and in comparison to Swedish framework conditions. Biomass Bioenergy 2004; 27: 671–693.
[27]Roland W. Recent advances in biofuel drying. Chem Eng Process 1999;38: 441–447.
[28]Enweremadu C.C, Rutto H.L. Investigation of heat loss in ethanol-water distillation column with direct vapour recompression heat pump. World Academy Sci Eng Technol 2010; 69: 128-135.
[29]Dahlquist E, Thorin E, Yan J. Alternative pathways to a fossil-fuel free energy system in the Mälardalen region of Sweden. Int J Energy Res 2007; 31: 1226-1236.
[30]Swedish Statistics, official website. http://www.scb.se, 2009.
[31]US DOE. Advanced bioethanol technology—website: http://www.ott.doe.gov/ biofuels/. US Department of Energy, Office of Energy Efficiency and Renewable Energy, Office of Transportation Technologies. Washington DC USA, 2003.
[32]Douglas J. Conceptual design of chemical processes. McGraw-Hill Book Co., New York, 1988. [33]God power Ltd. Personal contact.
[34]Skatteverket, official website. http://www.skatteverket.se, 2009.
[35]Forest products annual market review 2007-2008. United Nations, New York and Geneva, 2008.
[36]Kingsman Group, official website. http://www.kingsman.com, 2010.
[37]Morimoto S. Evaluation of crude oil production forecast studies using statistical Analysis. National Institute of Advanced Industrial Science and Technology, 2009.
[38]Johansson J, Lundqvist U. Estimating Swedish biomass energy supply. Biomass Bioenergy 1999;17: 85-93.
D
is
tr
ic
t
H
ea
tin
g
Bioethanol H P S te am F lu e G as Biomass Feedstock Biomass Feedstock Flue Gas Power Condensation Heat Heat Recovery Dried Solids PelletsCHP
Bioethanol Production
Dryer
Pelletizer
L P S te am Condensation Heat W et S o li d sP
o
w
er
LP S te amFluidized bed combustion De-aerator Pre-heater Pre-treatment Dis-tillation Filter Cellulose Hydrolysis Hemi-hydrolysis C6 Fer-mentation Bioethanol HP Dryer Heater Heater Drum Heater Water Steam Turbines Flue Gas Dryer F Combustion air Super heater Economizer Fresh Water Straw Pellets Biomass fuel Pellets District Heating Pellets Generator LP Dryer Condenser 1 Condenser 2
5 6 7 8 9 10 11 12 13 14 15 16 -100 -75 -50 -25 0 25 50 75 100 (7.69,0) N PV (MSE K ) BSP (SEK/l) (13.45,0)
Fig. 3 NPV changes with BSP
5 6 7 8 9 10 11 12 13 14 15 16 0 4 8 12 16 20 (8.76,0) (5.6,5.76) (13.45,10) IR R (%) BSP (SEK/l) (7.69,10)
Fig. 4 IRR changes with BSP
6 8 10 12 14 16 0.2 0.3 0.4 0.5 0.6 0.7 (5.6,0.28) (7.69,0.48) Fee d sto ck Pri ce( SEK/ kg) BSP (SEK/l) PB10,IRR=10%,NPV=0 PB5,IRR=10%,NPV=0 (13.45,0.48)
Fig. 5 Feedstock price changes with BSP
- - - - F eeds t oc k Wor k i ng Capi t alDepr ec i at i on I nt er es t Pr oduc t i on Cos t -10 -8 -6 -4 -2 0 2 4 6 8 10 production cost interest depreciation working capatial feedstock -9.85 -5.04 10.32 5.16 2.58 4.69 5.01 7.72 Capital Cost Operation Cost heating C o st (SEK/ l)
Production Cost Composition
PB10 PB5
pellets
Income
2.56
Table 1 Validation data for the CHP plant modeling
Number Position Measured Simulated Unit
1 Pressure after feed water tank 11.1 11.1 bar
2 Temperature after feed water tank 184.0 184.4 °C
3 Oxygen in flue gas 5.0 5.3 %
4 Electricity production 9.0 9.0 MW
5 Temperature after super-heater 1 391.0 389.0 °C
6 Temperature after super-heater 2 437.0 437.0 °C
7 Steam flow 12.8 12.6 kg/s
8 Pressure to feedwater tank 11.6 11.4 bar
9 Pressure to pre-heater 3.5 3.4 bar
10 Pressure to condenser 1 0.37 0.37 bar
11 Pressure to condenser 2 0.69 0.69 bar
Input combustion air temperature 40 °C Air intake in boiler room Radiation losses in boiler walls
(percentage of total input to boiler) 2 % Standard for biomass boilers MC of raw material of straw 0.45kg/kg Average values from the plant Straw’s EHV 8812 kJ/kg Calculated with Eq. 7
Flue gas temperature 142 °C At full load1 Water pressure drop in boiler 8 bar 2
Circulation ratio 1 Circulation ratio in the boiler drum Steam data 480 °C/80 bar Steam to turbine
Turbine mechanical efficiency 0.98 Assumed Pump mechanical efficiency 0.98 Assumed Generator mechanical efficiency 0.98 Assumed Generator electrical efficiency 0.98 Assumed District heating mass flow 158.5 kg/s At full load1, 2 District heating return temperature 47.5 °C 2
District heating supply temperature 86 °C 2 District heating water pressure 8.5 bar 2 Yield of cellulose converted to hexose
in hemi-hydrolysis 0.1
3
Yield of cellulose to hexose in
hydrolysis 0.9
3
Steam use for hemi-hydrolysis 4 bar Assumed 158 °C
Steam use for hydrolysis 15-20 bar 1,3 Energy efficiency of distillation 0.9 4
HSR separation yield 0.95 Assumed
MC of separated HSR 0.6 kg/kg Assumed Productivity of anhydrous bioethanol 0.15 kg/s Assumed
Ambient temperature 20 °C Assumed
HP dryer pressure 15-20 bar At full load1
LP dryer pressure 4 bar Assumed
Drying efficiency of LP and HP dryer 0.9 Assumed Outlet of flue gas dryer 100 °C Assumed
1
Input data varies with heat load.
2
Data collected at the CHP plant.
3
[21].
4
costs (MSEK) Bioethanol plant Pre-treatment 6.99 1.2 8.38 3 Hydrolysis 1 24.97 1.7 42.44 Calc. 4 Hydrolysis 2 Fermentation section 8.76 1.2 10.51 3,5
Filter and distillation 20.31 1.2 24.37 3,5
Wastewater treatment 3.07 1.2 3.69 3,5
Warehouse and site
development 7.08
Indirect costs1 25.99 3
Total of TEC 97.17 Total of TIC 89.39
Other cost (Startup etc.) 16.68 3,5
TPI (MSEK) 203.24
Pellets plant
Flue gas dyer 0.52 1.2 0.62 2,6
HP dryer
7.99 1.7 13.58 5,7
LP dryer
Pelletizer 2.39 1.2 2.87 7
Total of TEC 10.90 Total of TIC 17.07
TPI (MSEK) 27.978
1
Indirect costs include field expenses, office and construction fee, etc.
2
Installation cost is calculated by equipment cost multiplied by Multiplier and super-heated steam and flue gas dryers are assumed as pressure vessel and heat exchanger, respectively to determine the multiplier.
3
[19].
4
Calc. means calculation from other data.
5 [32]. 6 [33]. 7 [26]. 8
Feedrate to bioethanol plant (t/day, MC=0.45 kg/kg)
102.18 1
Feedstock price (SEK/t) 482.26 1
Feedstock cost for bioethanol plant (MSEK/year)
14.78 Calc. 2
Extra feedrate (t/day) 68.58 3,Calc. 2
Extra feedstock cost for CHP plant (MSEK/year)
9.92 Calc. 2
Total feedstock cost (MSEK/year) 24.7 Calc. 2 Total of TPI for two plants (MSEK/year) 231.19 Calc. 2
Working cost (MSEK/year) 23.12 4
Total operation cost (MSEK/year) 47.82 Calc. 2
1
Data collected at the CHP plant.
2
Calc. means calculation from simulation results.
3
Load increases due to steam extraction for bioethanol and pellets plants.
4
Pellets productivity (kt/year) 18.95 Calc. 1 Pellets selling price (SEK/kg) MC=0.1 kg/kg 2.56 2 Income of pellets (MSEK/year) 48.51 Calc.
DH (MW) 5.37 Calc.
DH selling price (SEK/MWh) 642.87 3
Income from DH (MSEK/year) 24.85 Calc.
Total income (MSEK/year) 73.36 Calc.
1
Calc. means calculation from simulation results.
2
[35].
3
Straw feedrate to CHP plant (MC=0.45 kg/kg) kg/s 4.73 Straw feedrate to bioethanol plant (MC=0.8 kg/kg) kg/s 3.25
Total straw feedrate to biorefinery system (MC=0.45 kg/kg) kg/s 5.91
EHV of straws (MC=0.45 kg/kg) MJ/kg 8.81
EHV of pellets (MC=0.1 kg/kg) MJ/kg 16.9
EHV of bioethanol MJ/kg 26.74
Power MW 9.00
Heat for DH (CHP plant; before integration) MW 22.46 Heat for DH (biorefinery system; after integration) MW 27.83
Bioethanol kg/s 0.15
Pellets (MC=0.1 kg/kg) kg/s 0.73