Hydrology Days 2018
Estimation of Soil Erosion Risk of the Euphrates River Watershed Using
RUSLE Model, Remote Sensing and GIS Techniques
Saleh Issa Khassaf and Ali Hussein Jaber Al Rammahi University of Basrah /College of Engineering /Civil Department salehissakh@gmail.com and alih.jaber@gmail.com
Abstract. The average annual soil erosion is the main problem of natural water resources and the
agriculture, the most dominant factor that effect on the soil erosion is water. The aim of this study was estimated the average annual soil erosion by using RUSLE model and the ArcGIS software of the Euphrates river watershed, this model was based on five factors for calculation soil erosion map of the watershed. The rainfall-runoff erosivity (R) factor map was computed for precipitation data that content from thirty-one stations scattered within and outside the watershed area to assist in the interpolation estimation. The soil erodibilty (K) factor map of topsoil was derived based on data that provided from UN-FAO (Food and Agriculture Organization of the United Nations). The topographic factor map can be depended mainly on the raw images of the Digital Elevation Model (DEM) of the watershed which DEM of Euphrates watershed consisted of sixteen images with a spatial cell size 30m*30m. The cover/crop management (C) factor map can be calculated based on the NDVI (Normalized Difference Vegetation Index) map of the Euphrates basin, the NDVI map can be derived based on remote sensing of the data available in the United State Geological Survey (USGS) for multi-images of the study area. The support practice factor (P) can be assumed equal to 1 because the bare land area occupied about 92% of the total area for computational years 2013 and 2017. The average annual soil loss for the year 2017 was ranged from 0 to 2995.614 tons/ha/year, 99.69% of the watershed area had the slight soil erosion loss while 0.17% of the watershed was represented the soil erosion of the slight to moderate type. For the year 2013, the soil loss estimated from 0 to 2610.47 tons/ha/year, 99.7% of watershed had the slight soil erosion loss while 0.16% of the watershed was classified into the slight to moderate soil loss type. Furthermore, the other soil loss types such as moderate to extremely high were found in the riverbed of the Euphrates. The sediment delivery ratio can be computed for upstream of Al Shamia barrage based on the field value of sediment yield for the year 2013. The observation value equaled to 25.62% while it’s equal to 26.12% based on the Renfro equation.
Keywords: Erosion, RUSLE, Remote Sensing, NDVI, Euphrates Basin
1- Introduction
The reasons to remove the soil surface particles are water and wind, the soil surface
removal is called the soil erosion risk (Kirkby and Morgan 1980). The most dominant factor that effects on the soil erosion are water which includes separation, transportation, and deposition of soil particles by rain impact energy (Foster and Meyer 1977; Wischmeier and Smith 1978; Julien 2002). The major problems of soil erosion in the natural resources management and the agriculture, these problems are included to reduce the soil
productivity, streams pollution and fills the reservoirs such as dams, regulators, barrage and so on (Fangmeier et al. 2006). There are many factors that effect to increase the soil
2002). The sheet erosion or interrill erosion process begins when the separation particles are laterally transported to the rills by a thin overland flow (Foster and Meyer 1977). The rills have carried the flow with most downslope sediment transport. Furthermore, the water from sheet erosion combines to form concentrated small channel that process is called rill erosion (Fangmeier et al. 2006). The stream channel erosion results from two sediment sources, the first source is concentrated water forms from rills and gullies, and the second source is contained sediment removal from stream banks and streambed of a channel (Foster and Meyer 1977; Fangmeier et al. 2006).
The Universal Soil Loss Equation (USLE) and the Revised Universal Soil Loss
Equation (RUSLE) are empirical models to estimate the soil erosion risk of identifying the watershed area (Fistikoglu and Harmancioglu, 2002). The upgraded version of USLE model is the RUSLE model (Renard et al. 1997). The RUSLE model has included the improvement in many of the factors estimations such as the new method to compute cover factor, algorithms to reflect rill to interrill erosion in the slope length and the steepness factors. The annual erosion losses of specify watershed can be estimated by RUSLE equation as shown below:
A=R.K.LS.C.P ……… (1) Where,
• A is the average annul of soil erosion loss per unit area (tons.acre-1.year-1 or tons.ha-1.year-1).
• R is the factor of the rainfall-runoff erosivity, the rainfall-runoff erosivity factor is the quantity factor to reflect the effect of the raindrop impact (Renard et al. 1997). The R factor is directly depended on the annual precipitation data for various parts of the world (Stocking and Elwell, 1976; Rose, 1977; Arnoldus, 1977; Bollinne et al., 1980; Smithen and Schulze, 1982; Lo et al., 1985, Bertoni and Lombardi Neto, 1990; Renard and
Freimund, 1994; Yu and Rosewell, 1996; Mikhailova et al., 1997; Torri et al., 2006). The present study can be depended on the equation of the Renard and Freimund’s method (1994) as shown below; which had the annual precipitation data between (67mm-1640mm) to compute the R factor. The study area has precipitation values within these ranges. The raw rainfall data are recommended at least 20 years to capture the natural climatic variation (Wischmeier and Smith, 1978).
𝑅 = 0.0483 × 𝑃*.+* 𝑃 < 850 𝑚𝑚 ……..… (2) 𝑅 = 587.7 − 1.219 × 𝑃 + 0.004105𝑃6 𝑃 ≥ 850 𝑚𝑚 …...…. (3) Where:
P: is the annual precipitation (mm),
R: is the annual rainfall erosivity (Mj.mm.ha-1.h-1.year-1).
It’s important to change the R factor unit from SI units to US units to compute the soil erosion of the watershed with tons/acre/year units as below (Cooper K, 2011).
* 89∗;; <=∗<> ∗ ? @+A.BA CD.DEF 89 G ∗ ? * <HFI>JI CD.DEF *KK CD.DEFL G ∗ ? * MF 6N.O ;;G ∗ ? * <= 6.OB* =P>JG = 0.05876 ∗ (<HFI>JI CD.DEF.MF=P>J∗<> )
Estimation of Soil Erosion Risk of the Euphrates River Watershed Using RUSLE Model, Remote Sensing and GIS Techniques
• K is the soil erodibilty factor, the K factor is the soil resistance to the erosion of rainfall and runoff (Haan et al. 1994). To find the experimental of soil erodibility factor that measurement on a unit plot the rate of soil loss per rainfall erosion index unit for a specific soil, furthermore, the K factor is computed as being 72.6 ft (22.1 m) long, with a width of 6 ft (1.3 m), 9% slope, and continuously clean-tilled fallow state with tillage performed up and downslope (Wischmeier and Smith 1978). The present study is used the multi-equation that are depended on the topsoil content to estimate the soil erodibility factor (Sharpley & Williams; 1990, Williams; 1995 and Neitsch et al; 2000) as below: 𝐾HLUJ = 𝑓PL=FI× 𝑓PUWLM× 𝑓E>XP × 𝑓<ML=FI ……… (4)
𝐾YHLUJ = 𝐾 factor = 𝐾HLUJ× 0.1317 ……….… (5) Where:
𝐾HLUJ : USLE model soil erodibility factor
𝑓PL=FI = `0.2 + 0.3 × 𝑒𝑥𝑝 d−0.256 × 𝑚L× ?1 −;efgh *KKGij ……… (6) 𝑓PUWLM = ? ;efgh ;kl;efghG K.@ ………... (7) 𝑓E>XP = ?1 −E>XmlJno[@.BNW6.qN×E>Xm]K.6N×E>Xm G ………. (8) 𝑓<ML=FI = s1 − K.B×?*WuvvteG
?*WuvvteGlJno`WN.N*l66.q×?*WuvvteGjw ………... (9)
ms : the percentage of sand fration content (0.5-2 mm particale diameter) [%]
msilt : the percentage of silt fration content (0.002-0.05 mm particale diameter) [%]
mc : the percentage of clay fration content (<0.002 mm particale diameter) [%]
orgC : the percentage of orgaic carbon fration content) [%]
• LS is the topographic factor (L slope length factor & S slope steepness factor). The slope length factor L is the horizontal distance of the surface land flow from the original to point where either the slope gradient decreases enough that runoff becomes concentrated or deposition begins in a specific channel (Wischmeier and Smith 1978), also, the L factor is the ratio of soil loss of site slope length to soil loss from a 72.6 ft long plot under specific
conditions. The slope steepness factor is the ratio of soil loss from the site slope gradient to soil loss from 9% slope under otherwise matching condition (Renard et al. 1997). The present study was adopted the equation below to estimate the topographic factor LS in ArcGIS based on the raw images of the Digital Elevation Model (DEM) (Moore and Burch 1985)
𝐿𝑆 = ( {e 66.*@) ;× ( |}~ • K.KAq+) F ……… (10) Where:
As: is the identify catchment area, in ArcGIS, the As is computed the function of the hydrology – spatial Analyst Tool “flow accumulation” multiply by the cell size.
The equation (10) is applied by many researcher like Moore & Wilson; 1992, Moore et al; 1993, Jain & Kothyari; 2000, Van der Knijff et al; 2000 and other. The exponent value m can be taken that 0.4 while the value of n can be taken equal to 1.3 (Moore et al; 1993, Jain & Kothyari; 2000 and Van der Knijff et al; 2000).
• C is the cover/crop management factor, the C factor represents the effect of vegetation and other land covers. There are many methods to compute the C factor, Normalized Difference Vegetation Index (NDVI) is the best method to estimate the C factor for soil loss assessment with RUSLE model (De Jong 1994; De Jong et al., 1999; De Jong and Riezebos, 1997; Wang et al., 2002; Lin et al. 2002). The NDVI values are the indicator of the vegetation vigor is used with following formula to estimate the C factor map (Zhou et al., 2008; Kouli et al., 2009)
𝐶 = exp(−𝛼ŠW†‡ˆ‰†‡ˆ‰ ) ………. (11)
Where α and β are a dimensionless parameter that depended on the shape of the curve relationship between the NDVI and the C factor. The scaling approach gave better results to assume a linear relationship, the value of α is equal to 2 while the value of β is equal to 1 (Van der Knijff et al. 2000). The equation (11) was succeeded application for estimation the C factor of the watershed area with similar terrain and climatic conditions
(Prasannakumar et al., 2011a, b).P is the support practice factor, P factor is the ratio of soil loss with a specific support practice to upslope and downslope tillage of corresponding soil loss. The practices are affected of the erosion by regulating the flow pattern, steepness, or direction of land surface runoff and by reduction the amount and rate of runoff (Reynard and Foster 1983).
2- Study Area
Iraq is a country consisting of eighteen provinces and it is a West Asian country,
Tigris and Euphrates are the main rivers in the country of Iraq. The Euphrates River is one of the longest historical rivers in Western Asia. The river flows from Turkey and runs through Syria and this country to meet the Tigris River in the Shatt al-Arab in southern Iraq. The Euphrates basin consists of eight governorates, the watershed of the study area was included the following seven governorates Najaf, Karbala, Al-Qadisiyyah, Babylon, Al Muthanna, Dhi Qar and Basrah as shown in Fig. (1). The total watershed area of the study is about 131722 km2 and 30% of the total area of Iraq.
Estimation of Soil Erosion Risk of the Euphrates River Watershed Using RUSLE Model, Remote Sensing and GIS Techniques
Figure 1. Study area of watershed location map
3- Calculation the factors by GIS software
All factors of Euphrates watershed map can be calculated using the ArcMap 10.2
software as below:
3-1 Calculation the rainfall-runoff erosivity factor R
Precipitation data is required to apply equations 2&3 to estimate the factor R of Euphrates watershed. Precipitation data were taken from thirty-one stations scattered within and outside the watershed area to give the interpolation estimation. The number of gauge stations for precipitation data in Iraq was twenty-six while in Saudi Arabia were four gauge station and in Kuwait country was one station as shown in the Table (1) and Fig. (2) below. All gauge stations have measured data greater than twenty years ago.
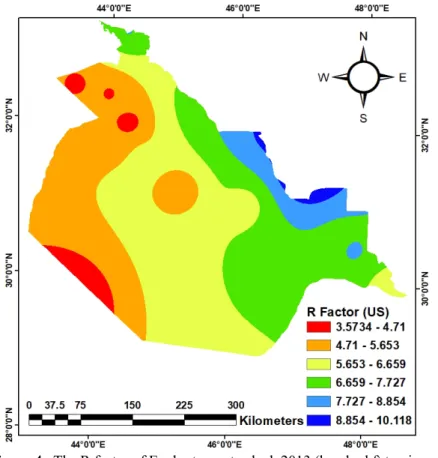
All precipitation data of gauges station were less than 850 mm, so the equation 2 will be applied to compute the R factor for years 2017 and 2013 in the figures (3) and (4)
respectively. Two maps of R factor derived from data until to specify year, the resolution image was 30m*30m by using the Inverse Distance Weighting method (IDW). The IDW is the best mathematical (deterministic) method and it’s a commonly used deterministic interpolation method.
Table 1. Rainfall gauge stations in the Euphrates river basin (Iraqi Meteorological Organization and Seismology and General Authority for Statistics of Saudi Arabia & Kuwait)
Station
Location Observation Station Precipitation
mm/year
Longitude Latitude Begin Data End Data Country
BAGHDAD 44.24 33.2 1938 2017 Iraq 136.004 NASIRIYA 46.14 31.01 1940 2017 Iraq 118.326 BASRA 47.78 30.5 1937 2017 Iraq 138.934 AL_HAI 46.03 32.1 1941 2017 Iraq 136.680 KIRKUK 44.24 35.28 1924 2017 Iraq 367.666 RUTBA 40.17 33.02 1928 2016 Iraq 113.219 DIWANIYA 44.59 31.59 1929 2016 Iraq 113.416 MOSUL 43.09 36.19 1936 2016 Iraq 372.575 FAO 48.41 29.97 1941 2016 Iraq 143.125 BASRA_AIRPORT 47.67 30.55 1991 2017 Iraq 123.136 NAJAF 44.32 32.03 1961 2017 Iraq 94.037 NUKHAIB 42.27 32.03 1939 2016 Iraq 70.358 SAMAWA 45.16 31.18 1941 2016 Iraq 101.802 HILLA 44.26 32.29 1935 2017 Iraq 108.346 KUT 45.45 32.3 1941 2016 Iraq 136.068 AZIZYIA 45.06 32.91 1992 2016 Iraq 116.082 AIN_ALTAMUR 43.48 32.48 1978 2016 Iraq 97.801 KERBALA 44.01 32.37 1935 2017 Iraq 99.956 HADITHA 42.22 34.04 1937 2014 Iraq 128.085 AMARA 47.1 31.51 1935 2017 Iraq 175.761 ALI_ELGHARBI 46.41 32.28 1940 2016 Iraq 197.137 BADRA 45.98 33.09 1994 2016 Iraq 198.749 AL_KHALIS 44.53 33.84 1966 2017 Iraq 155.057 SAMARRA 43.9 34.11 1941 2013 Iraq 148.165 RAMADI 43.2 33.45 1923 2017 Iraq 97.461 HEET 42.83 33.64 1951 2016 Iraq 104.862 KUWAIT_AIRPORT 47.97 29.24 1992 2015 Kuwait 123.274
TURAIF 38.73 31.69 1983 2015 Saudi Arabia 68.163
ARAR 41.14 30.9 1983 2015 Saudi Arabia 50.316
RAFHA 43.49 29.63 1983 2015 Saudi Arabia 69.797
Estimation of Soil Erosion Risk of the Euphrates River Watershed Using RUSLE Model, Remote Sensing and GIS Techniques
Figure 2. Location of gauge stations for precipitation data
Figure 4. The R factor of Euphrates watershed, 2013 (hundred ft.ton.in.acre-1.h-1.year-1)
3-2 Calculation the soil erodibilty factor K
The K factor depends directly on the topsoil content of ground surface. Topsoil from ground surface can be derived based on UN-FAO (Food and Agriculture Organization of the United Nations 2007) as shown in Table (2). These data can be used to predict the K factor map for two years 2017 and 2013 because the data at these years were not available. The K factor map with cell size 30m*30m of Euphrates watershed can be estimated by application the equations 4, 5,6,7,8 and 9 as the Fig. (5).
Table 2. the percentage of the type of topsoil (UN-FAO)
Soil unit symbol Sand % topsoil ms Silt % topsoil msilt Clay % topsoil mc Organic Carbon % topsoil orgC Jc 39.35 39.54 20.46 0.65 Yk 63.38 17.78 18.58 0.26 Yy 48.96 10.68 40.23 0.13 Zo 43 24.43 32.17 0.4 Vc 22.2 24.3 52.81 0.69 Rc 63.25 18.9 17.09 0.76 Qa 92.34 3.27 3.52 0.87
Estimation of Soil Erosion Risk of the Euphrates River Watershed Using RUSLE Model, Remote Sensing and GIS Techniques
Figure 5. K factor values of the Euphrates basin
3-3 Calculation the topographic factor LS
The LS factor depends mainly on raw images of the Digital Elevation Model (DEM) of the watershed. The DEM of Euphrates watershed consisted of sixteen images with a spatial cell size 30m*30m. The raw DEM is available from Shuttle Radar Topography Mission (SRTM) 1 Arc-Second Global of USGS (United State Geological Survey) in September 2014, the DEM at the year 2014 can be used to estimate the LS factor at 2017 and 2013. After processing the raw DEM of Euphrates watershed by fills skins in surface raster to remove small imperfections in the raw sixteen images. The functions in ArcToolbox of ArcMap 10.2 software can be used to merge multi-images by the new raster of Euphrates watershed as shown in Fig. (6). The equation (10) can be applied after calculation the “flow accumulation” and “slope” by ArcToolbox of ArcGIS to estimate the topographic factor LS as shown in Fig. (7). The number of cells size of LS factor for every ten categories can be computed. Actually, 99.985% of the watershed area had the LS factor values from 0 to 100 and other areas about 0.015% was ranged the LS values from 100 to 8010.61.
Figure 6. DEM map of Euphrates watershed
Figure 7. Topographic factor LS map of Euphrates watershed
3-4 Calculation the cover/crop management factor C
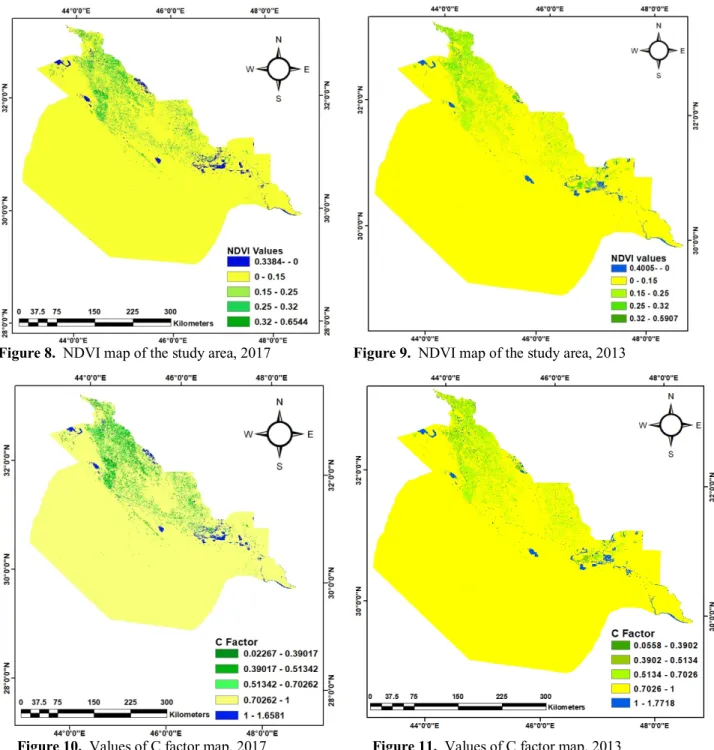
The equation (11) can be applied to estimate the C factor of watershed after computation the NDVI map of Euphrates basin. The NDVI map can be derived based on the data available in the United State Geological Survey (USGS) for multi-images of the study
Estimation of Soil Erosion Risk of the Euphrates River Watershed Using RUSLE Model, Remote Sensing and GIS Techniques
area, the date of images Landsat 8 OLI (Operational Land Imager) and TIRS (Thermal Infrared Sensor) February 2017 and April 2013. The images number are fifteen for each band to occupy the watershed study. By remote sensing (Image Analysis) of ArcMap 10.2 software to assemble and the process of multi-images, the values of NDVI map ranged from -0.338 to 0.654 in the Fig. (8) for 2017 while it ranged from -0.4005 to 0.5907 in the Fig. (9) for 2013. The C factor map of Euphrates watershed was ranged from (0.02267) to (1.658) for 2017 as exposed in the Fig. (10), this factor has values from (0.0558) to (1.7718) as shown in the Fig. (11). The bare land for values NDVI from 0 to 0.15 represented about 92% of the whole area of the watershed.
3-5 Calculation the support practice factor P
The P factor is ranged from 0 to 1. This factor is equal 1 when the land surface is plowed with upslope and downslope, and less than 1 when the soil erosion is reduced by adopting support practices of the above mentioned. The main common and effective of support practices on the site level are terracing and contouring. For the above mention of NDVI map of the watershed, the bare land (0 – 0.15) is represented the large of basin area about 92%. of the total watershed area. So the P factor of Euphrates river basin can be assumed no support practices implemented in the basin that equal to 1.
4- The Results and Discussion
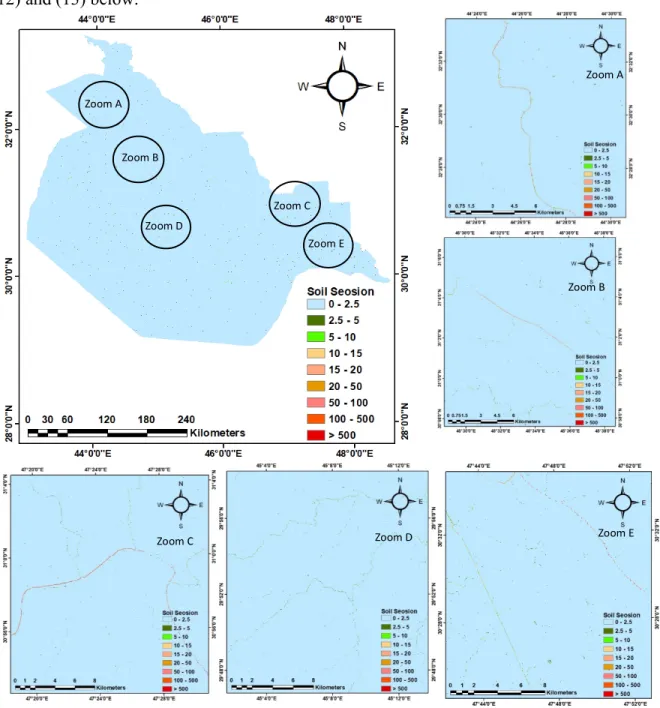
The average annual soil erosion loss of the Euphrates watershed can be estimated for two different years 2017 and 2013 by using the RUSLE equation (1) as shown in the figure (12) and (13) below.
Figure 12. Average annual soil loss rate map of the Euphrates basin (ton/ha/year) 2017 Zoom E Zoom A Zoom A Zoom B Zoom C Zoom C Zoom D Zoom D Zoom B Zoom E
Estimation of Soil Erosion Risk of the Euphrates River Watershed Using RUSLE Model, Remote Sensing and GIS Techniques
Figure 13. Average annual soil loss rate map of the Euphrates basin (ton/ha/year) 2013
The soil loss of two years can be classified two the categories in the tables (3) and (4) to explain the types of erosion. The average annual soil loss for the year 2017 was ranged from 0 to 2995.614 tons/ha/year, 99.69% of the watershed area had the slight soil erosion loss while 0.17% of the watershed was represented the soil erosion of the slight to
moderate type. For the year 2013, the soil loss estimated from 0 to 2610.47 tons/ha/year, 99.7% of watershed had the slight soil erosion loss while 0.16% of the watershed was classified into the slight to moderate soil loss type. Furthermore, the other soil loss types
Zoom D Zoom A Zoom B Zoom C Zoom B Zoom C Zoom D Zoom A Zoom E Zoom E
Table 3. Intervals of the soil losses and the areas of each classification (2017)
Soil loss intervals (ton/ha/year)
Soil loss types Cells
number Area (Km2) Area %
0 - 2.5 Slight 145910123 131319.1 99.6941 2.5 – 5 Slight to Moderate 245622 221.0598 0.1678 5 – 10 Moderate 108507 97.6563 0.0741 10 – 15 Moderate to High 33916 30.5244 0.0232 15 – 20 High 16219 14.5971 0.0111 20 – 50 Very High 27989 25.1901 0.0191 50 – 100 Extremely 8460 7.614 0.0058 100 – 500 Extremely High 6267 5.6403 0.0043 > 500 742 0.6678 0.0005
Table 4. Intervals of the soil losses and the areas of each classification (2013)
Soil loss intervals (ton/ha/year)
Soil loss types Cells
number Area (Km2) Area %
0 - 2.5 Slight 145923465 131331.119 99.7032 2.5 - 5 Slight to Moderate 237783 214.005 0.1625 5 - 10 Moderate 105844 95.260 0.0723 10 - 15 Moderate to High 33021 29.719 0.0226 15 - 20 High 15800 14.220 0.0108 20 - 50 Very High 27276 24.548 0.0186 50 - 100 Extremely 8284 7.456 0.0057 100 - 500 Extremely High 5712 5.141 0.0039 > 500 661 0.595 0.0005
The sediment delivery ratio can be computed based on the field data of sediment yield. The field sediment yield at the riverbed of Euphrates measured in 2013 at upstream of Al Shamia barrage as exposed the location in the Fig. (14). The field sediment yield equaled 96184.8 ton/year (Sadiq 2014). The watershed analysis can be used to compute the sub-basin of this point (barrage) by using HEC-GeoHMS (Hydrologic Engineering Center's Hydrologic Modeling System) which provided on the toolbox of ArcGIS as shown in the Fig. (15).
The soil loss value of this basin of RUSLE equation can be computed by the extract of the whole map of Euphrates watershed as exposed in the Fig. (16). The area of Al Ahamia basin found equal to 449.7 km2 and the soil loss at upstream of barrage equaled to 3.378 ton.acre-1.year-1. So the soil loss of this point is 375383.635 ton/year. The observation sediment delivery ratio of the sub-watershed is 25.62%. Renfro (1975) suggested the equation to calculate the sediment delivery ratio field area as following equation (12). The sediment delivery ratio by Renfro equal to 26.12%.
log (SDR)=1.7935 − 0.14191 log(A) ……….. (12) Where A is the drainage area in km2 and S
Estimation of Soil Erosion Risk of the Euphrates River Watershed Using RUSLE Model, Remote Sensing and GIS Techniques
Figure 15. Al Shamia sub-watershed basin
5- Conclusion
The average annual soil loss of the Euphrates watershed of Iraq for the year 2017 was ranged from 0 to 2995.614 tons/ha/year, 99.69% of the basin area had the slight soil erosion loss while 0.17% of the watershed was represented the soil erosion of the slight to moderate type. For the year 2013, the soil loss estimated from 0 to 2610.47 tons/ha/year, 99.7% of watershed had the slight soil erosion loss while 0.16% of the watershed was classified into the slight to moderate soil loss type. Furthermore, the other soil loss types such as moderate to extremely high were found in the riverbed of the Euphrates. The sediment delivery ratio can be computed for upstream of Al Shamia barrage based on the field value of sediment yield for the year 2013. The observation value equaled to 25.62% while it’s equal to 26.12% based on the Renfro equation.
Estimation of Soil Erosion Risk of the Euphrates River Watershed Using RUSLE Model, Remote Sensing and GIS Techniques
References
Arnoldus, H.M.J., (1977). Methodology used to determine the maximum potential average annual soil loss due to sheet and rill erosion in Morocco. FAO Soils Bull., 34:39 51.
Bertoni, J., Lombardi Neto, F., (1990). Conservação do solo Ícone Editora. São Paulo, Brazil 355 pp. Brazilian Institute for Geography and Statistic (IBGE)
Bollinne, A., Laurant, A., Rosseau, P., Pauwels, J.M., Gabriels, D. and Aelterman, J., (1980). Provisional rain erosivity map of Belgium. In: M. DeBoodt and D. Gabriels (Editors), Assessment of Erosion. John Wiley & Sons, Chichester, pp. I 11-120.
Cooper K. (2011). “Evaluation of the Relationsip Between the RUSLE R-factor and Mean Annul Precipitation ” http://www.engr.colostate.edu/~pierre/ce_old/Projects/linkfiles/Cooper%20R-factor-Final.pdf
De Jong, S. M. (1994). “Application of Reflective Remote Sensing for Land Degradation Studies in a Mediterranean Environment.” (Utrecht: Netherlands Geographical Studies, University of Utrecht)
De Jong, S.M., Paracchini, M.L., Bertolo, F., Folving, S., Megier, J., De Roo, A.P.J. (1999). “Regional assessment of soil erosion using the distributed model SEMMED and remotely sensed data.” Catena 37 (3–4), 291–308
De Jong, S.M., Riezebos, H.T.(1997). “SEMMED: a distributed approach to soil erosion modelling. In: Spiteri, A. (Ed.), Remote Sensing 96: Integrated Applications for Risk Assessment and Disaster Prevention for the Mediterranean.” Balkema, Rotterdam, pp. 199–204
Fangmeier, D.D. Elliot, W. J. Workman, S. R. Huffman, R. L. Schwab, G. O. (2006). Soil erosion by water. Soil and Water Conservation Engineering, 5th ed. Thomson Delmar Learning, New York. 134-158
Fistikoglu, O. and Harmancioglu, N.B. (2002). “Integration of GIS with USLE in Assessment of Soil Erosion.” Water Resources Management 16, 447–467
Foster, G. R. and Meyer, L. D. (1977). Soil erosion and sedimentation by water- an overview. Procs. National Symposium on Soil Erosion and Sedimentation by Water, Am. Soc. Of. Agr. Eng., St. Joseph, Mechigan, 1-13.
General Authority for Statistics of Kuwait, (2015). Four gauge stations of precipitation data. https://www.csb.gov.kw/
General Authority for Statistics of Saudi Arabia, (2015). Four gauge stations of precipitation data. https://www.stats.gov.sa
Haan, C.T., Barfield, B.J., and Hayes, J.C. (1994). Design Hydrology and Sedimentology for Small Catchments, Academic Press, San Diego, California.
Iraqi Meteorological Organization and Seismology, (from the establishing date of gauge stations to 2017). Precipitation data for each twenty six gauge stations of Iraq country
Jain Manoj K. and Kothyari Umesh C. (2000). “Estimation of soil erosion and sediment yield using GIS” Hydrological Sciences Journal 45:5, 771-786
Julien, P. Y. (2002). “River Mechanics.” Cambridge University Press, New York, pp. 31-78. Julien, P.Y. (2010). Erosion and Sedimentation. 2nd ed. Cambridge University Press, Cambridge. Kirkby, M. J and Morgan. R.P.C. (1980).Soil erosion. Chichester, New York. Bridsbane, Toronto,
John Wiley & Sons Publications.
Kouli, M., Soupios, P., Vallianatos, F. (2008). “Soil erosion prediction using the Revised Universal Soil Loss Equation (RUSLE) in a GIS framework, Chania, Northwestern Crete, Greece.” Environmental Geology 57 (3), 483-497
Lin, C.-Y., Lin, W.-T., Chou, W.-C. (2002). “Soil erosion prediction and sediment yield estimation: the Taiwan experience.” Soil and Tillage Research 68 (2), 143–152
Lo, A., El-Swaify, S.A., Dangler, E.W. and Shinshiro, L., (1985). Effectiveness of El30 as an erosivity index in Hawaii. In: S.A. E1-Swaify, W.C. Moldenhauer and A. Lo (Editors), Soil Erosion and Conservation. Soil Conservation Society of America, Ankeny, pp. 384 392.
Estimation of Soil Erosion Risk of the Euphrates River Watershed Using RUSLE Model, Remote Sensing and GIS Techniques
Mikhailova, E.A., Bryant, R.B., Schwager, S.J., Smith, S.D. (1997). Predicting Rainfall Erosivity in Honduras. Soil Science Society of America journal 61: pp 273-279.
Moore Ian D. and Wilson John P. (1992). “Length-slope factors for the Revised Universal Soil Loss Equation: Simplified method of estimation”. Journal of Soil and Water Conservation Society. 47, 423-428.
Moore, I.D., Turner, A.K., Wilson, J.P., Jenson, S.K. & Band, L.E. (1993). GIS and land-surface-subsurface process modeling. In: Goodchild, M.FR., Parks, B.O. & Steyaert, L.T. (eds): Environmental modeling with GIS, p. 196-230.
Moore, LD., and Burch, G.J. (1985). Physical Basis of the Length-slope Factor in the Universal Soil Loss Equation. Soil Sci. Soc. Am. J. 50: 1294-1298.
Neitsch S.L., Arnold J.G., Kiniry J.R., Williams J.R. (2000) “Erosion Soil and Water”. Assessment Tool Theoretical Documentation Texas Agricultural Eksperiment Station. pp. 625.
Prasannakumar, V., Shiny, R., Geetha, N., Vijith, H. (2011a). “Spatial prediction of soil erosion risk by remote sensing. GIS and RUSLE approach: a case study of Siruvani river watershed in Attapady valley, Kerala, India. ” Environmental Earth Sciences 64 (4), 965-972
Prasannakumar, V., Vijith, H., Geetha, N., Shiny, R., (2011b). “Regional scale erosion assessment of a sub-tropical highland segment in the Western Ghats of Kerala, South India.” Water Resources Management 25, 3715-3727
Renard K.G. and Freimund, J.R. (1994). “Using monthly precipitation data to estimate the R factor in the revised USLE.” J Hydrol 157, 287–306
Renard, K., Foster, G., Weesies, G., McDool, D., and Yoder, D. (1997). Predicting Soil Erosion by Water: A Guide to Conservation Planning with the Revised Universal Soil Loss Equation (RUSLE). Agricultural Handbook 703, USDA-ARS.
Renard, K.G., and Foster, G.R. (1983). Soil conservation: Principles of erosion by water. Dryland Agriculture, pp. 155-176. Agronomy Monogr. 23, Am. Soc. Agron., Crop Sci. Soc. Am., and Soil Sci. Soc. Am., Madison, Wisconsin.
Rose, E., (1977). Erosion et Ruissellement en Afrique de l'ouest--vingt années de mesures en petites parcelles expérimentales. Travaux et Documents de I'ORSTOM No. 78, ORSTOM, Paris Sadiq M. Nasseem (2014). “Estimation of Sediment Transport Upstream of Al-Shamia Barrage.”
Master thesis of hydraulic structure at University of Kufa
Sharpley, A. N. & Williams, J. R. Epic “Erosion/Productivity Impact Calculator: 1. Model
Documentation” (1990). U.S. Department of Agriculture Technical Bulletin, v. 1768, p. 235 pp. Smithen A.A. and Schulze, R.E., (1982). The spatial distribution in Southern Africa of rainfall
erosivity for use in the universal soil loss equation. Water S. Afr., 8(2): 74-78.
Stocking, M,A. and Elwell, H.A., (1976). Erosivity determinations for seven rainfall stations in Rhodesia. Research Bull. No. 21, Department of Conservation and Extension, Salisbury. Torri, D., Borselli, L., Guzzetti, F., Calzolari, C., Bazzoffi, P., Ungaro, F., Bartolini D, Sanchis MP.
(2006). Soil erosion in Italy: an overview. In Soil Erosion in Europe, Boardman J, Poesen J. eds .Wiley: New York; pp 245-261.
UN-FAO (2007). This website is designed as a source of soil data and knowledge on the different components and parts of soils, http://www.fao.org/soils-portal/en/
USGS, United State Geological Survey Shuttle Radar Topography Mission (SRTM) 1 Arc-Second Global (2014) https://earthexplorer.usgs.gov/
USGS, United State Geological Survey, Landsat 8 OLI (Operational Land Imager) and TIRS (Thermal Infrared Sensor) (2017) Multi-images bands of Iraq zone.
Wang, G.,Wente, S., Gertner, G.Z., Anderson, A. (2002). “Improvement in mapping vegetation cover factor for the universal soil loss equation by geostatistical methods with Landsat Thematic Mapper images.” International Journal of Remote Sensing 23 (18), 3649–3667
Williams J.R. Chapter 25: The EPIC model. In V.P. Singh (ed.) (1995) Computer models of watershed hydrology. Water Resources Publications. p. 909-1000.
Wischmeier, W. H., and Smith, D.D., (1978). Predicting Rainfall Erosion Losses- A Guide to Consrvation Planning. U.S. Department of Agriculture Handbook No.537.
Yu, B., Rosewell, C.J., (1996). Technical Notes: A Robust Estimator of the R-Factor for the Universal Soil Loss Equation. Transactions of the ASAE: 1996 American Society of Agricultural Engineers, Vol.39: pp 559-561.
Zhou, P., Luukkanen, T., Tokola, T., Nieminen, J. (2008). “Effect of vegetation cover on soil erosion in a mountainous watershed.” CATENA An Interdisciplinary Journal of Soil Science - Hydrology - Geomorphology focusing on Geoecology and Landscape Evolution 75 (3), 319-325