David Snällfot & Lukas Svensson
Transport behaviour of
future generations:
Plane or train between Malmö and Stockholm?
Transportbeteende av framtida generationer:
Flyg eller tåg mellan Malmö och Stockholm?
Environmental Science Supervisor: Per Lindquist Spring term: 2012
Abstract
This thesis investigated what influenced student at Malmö Högskola in their choice of train or plane travel between Malmö and Stockholm. The thesis proposed four hypotheses that were investigated: maximization of leisure time, substitute goods, comfort and environmental concern. Data was collected by manufacturing and distributing a questionnaire to 248 students which was analyzed statistically. Environmental concern was found to have less of an influence on the choice of travel means than the other investigated factors, a result consistent with previous research. Cost was found to be the most important factor. Train travel was more common among the sampled population than in the Swedish population. The results were associated with some uncertainty as the population was likely to change their choice of travel means after graduation. The thesis aimed to carry out an initial measurement of the above variables to allow the resulting material to be used in future studies with a generational replacement approach.
Keywords: Environment, transport, plane travel, train travel, carbon emission, speed, cost, environmental concern,
comfort, Stockholm, Malmö, generational replacement theory.
Sammandrag
Denna uppsats undersökte vad som påverkade Malmö högskolas studenter i sina val av tåg- eller flygresor mellan Malmö och Stockholm. Uppsatsen föreslog fyra hypoteser som undersöktes maximering av fritid, ersättningsvaror, komfort samt miljöhänsyn. Data samlades in genom att utforma och dela ut en enkät till 248 elever som analyserades statistiskt. Miljöhänsyn visade sig ha mindre inflytande på valet av resesätt än de andra undersökta faktorerna, ett resultat i linje med tidigare forskning. Kostnaden visade sig vara den viktigaste faktorn. Tågresande var mer vanligt bland den undersökta populationen än i den svenska befolkningen. Resultaten var associerade med osäkerhet eftersom populationen var troliga att ändra resesätt efter avslutade studier. Syftet med uppsatsen var att göra en initial mätning av ovanstående variabler som kan användas i framtida studier med fokus på generationsskifte.
Nyckelord: Miljö, transport, resor, flygresor, tågresor, koldioxidutsläpp, hastighet, kostnad, miljöhänsyn, komfort,
Contents
Abstract/Sammandrag 2
Chapter 1 – Introduction 4
1.1 Train or plane travel a choice made by young people 4
1.2 Purpose and problematization 5
1.3 Disposition 5
Chapter 2 - Theory, previous research and hypotheses 6
2.1 Generational Replacement Theory 6 2.2 Effect of specific events relevant to the period of measurement 7
2.3 Environmental concern in previous generational replacement studies 7 2.4 Elaborating on the distribution and significance of the choice of travel means 9
2.5 Limitation of the thesis: Four hypotheses 11 Chapter 3 – Method and material 14
3.1 Questionnaire 14
3.2 Sampling 14
3.3 Data entry 15
3.4 Descriptive statistics 16 3.5 Assessing the normality of the sampled population 16 3.6 Statistical analyses - Cross tabulations 17 Chapter 4 - Descriptive statistics of the sampled population 18 4.1 Background of the sampled population 18 4.2 Frequency and distribution of answers in the sampled population 20 Chapter 5 - Results and Analyses 30 5.1 Hypothesis 1: Maximization of leisure time 30 5.2 Hypothesis 2: Substitute goods 33 5.3 Hypothesis 3: Comfort and service disruptions 40 5.4 Hypothesis 4: Environmental concern 44
Chapter 6 - Conclusions 49
6.1 The distribution of travel choice among the entire sampled population 49 6.2 Hypothesis 1: Maximization of leisure time 51 6.3 Hypothesis 2: Substitute goods 51 6.4 Hypothesis 3: Comfort and service disruption 52 6.5 Hypothesis 4: Environmental concern 53
Chapter 7 - Discussion 55
References 57
Attachment 1: The Questionnaire 59 Attachment 2: Statistical tests used 61 Attachment 3: Cross tabulations and results 63
Chapter 1 – Introduction
1.1 Train or plane travel a choice made by young people
Failure to abate heat trapping gas emissions from the transport sector could be detrimental to global mitigation efforts aimed at alleviating adverse climate change (PBL/JRC 2011, p. 23, 28). Success in reducing emissions from the transport sector depends to a significant degree on the choices made by ordinary citizens, in addition to top-down policy measures made by politicians and business leaders aimed at achieving such reductions. This thesis’s concern is with the choices made by ordinary citizens, represented by the demographic group young people, to travel by either train or plane. Young people are represented in this thesis by students at Malmö Högskola of which 73 % are between 19 to less than 30 years of age (Swedish National Agency for Higher Education 2011). Train being a low emission travel choice, reconcilable with efforts to reduce transport sector emissions, while plane travel is a high emission travel choice, aggravating emission reduction efforts.
Changes in the distribution of choices and attitudes over time can be traced back to have two sources of origin: effects of events specific to the period of measurement and that of generational replacement (Hellevik 2002, p. 14). This thesis favors the generational replacement theory approach, which argues that the attitudes of young people can be viewed as important markers of long-term social change (Wray-Lake et al. 2010, 62-63). However, long-term social change in this sense may only occur if the changed distribution of attitudes is sustained over time from the point of measurement (Hellevik 2002, p. 16). This thesis aims to perform one measurement on the distribution of choices and attitudes of the sampled population concerning train and plane travel. More specifically the ambition is to gain knowledge on the process of what may influence the sampled populations choice between train and plane travel. Since no time series of similar measurements with this particular construction exists, the thesis is limited to its singular measurement for conclusions. The thesis is therefore encouraging the use of its findings in future generational replacement attitude studies with similar a construction. This will allow future inferential comparisons of the measurements on generational attitudes and choices as distributed over time.
In reducing the ambitions of the thesis to feasibility, limitations and constraints had naturally to be made. To collect quantitative data for the measurement, a questionnaire was manufactured, distributed and analyzed. The following limitations were applied to extract the sample: Young people were limited to 248 completed questionnaires by students at Malmö Högskola. The choice between train and plane travel was constrained to Malmö - Stockholm. Determinant factors investigated for their influence on the process of choosing means of travel were limited to: cost, speed, comfort and environmental concern.
1.2 Purpose and problematization
The purpose of this study is to determine what factors affect the sampled population when they choose between train and plane travel. Investigated factors were limited to cost, speed, comfort and environmental concern. The choice of the sampled population and the attitudes that helped spawn them can in turn affect the environment as train travel is here defined as a low carbon emission choice and plane travel a high carbon emission choice. The aim of this thesis is to begin initial measurements of these choices and attitudes among young people, represented by students at Malmö Högskola, with the goal of enabling future generational replacement studies on this topic.
1.3 Disposition
To facilitate for the reader this thesis has been divided into 7 chapters. Charts and tables are present throughout the thesis while complementary material, such as the questionnaire, are available as attachments.
Chapter 1: Introduction and purpose.
Chapter 2: Theory, previous research and hypotheses. Chapter 3: Method and Material.
Chapter 4: Descriptive statistics of the sampled population. Chapter 5: Results and Analyses.
Chapter 6: Conclusions. Chapter 7: Discussion.
Chapter 2 - Theory, previous research and hypotheses.
2.1 Generational replacement theory
Political scientist Michael X. Delli Carpini (1989) succinctly describes the necessary axiom of generational replacement theory in the following words:
There is no more fundamental transfer of power, and therefore no more fundamental potential for change, than that which occurs between generations. This is so because, unlike any other type of change, it is inevitable, it is all-inclusive, and it is untested. (Delli Carpini 1989, p. 11). Original italics.
Generational replacement is thus the inevitable consequence of mortality (Ibid, p. 12). The overturn rate of a generation is approximately 30 years (Ibid). Generational replacement theory suggests the processes from which a particular age demographic within the population is marked by to be attributable to the combination of social forces and individual life-cycle stages (Ibid, p. 18). These parallel processes do differ from the processes that enacts on entire cultures, in the sense that they stem from the interaction between age and experiences. In this way the
“socialization” of the generation is less general than that of an entire culture, but more general than the experiences of any one individual (Ibid). Furthermore, the generations that replace their predecessors are not completely free from biases as they are molded by their experiences in a reality that was shaped by their predecessors (Ibid, p.13).
Generational replacement is recommended to be conducted in small units of time, in order to maximize its visibility and to filter out historical and life-cycle forces (Ibid, p. 30). The
recommendation for empirical studies is to begin with a particular age group (Ibid). In this thesis the demographic group sampled is represented by students at Malmö Högskola of which 73 % are between 19 to less than 30 years of age (Swedish National Agency for Higher Education 2011). Furthermore, it is recommended to consider key factors that may be enacting on the chosen age group in shaping their personality (Delli Carpini 1989, p.30). This thesis considers and limits its investigation to the effect of four hypotheses factors: maximization of leisure time, substitute goods, deprivation of comforts and environmental concern as enacting on the sampled
population and shapes the expression (choice and attitude) of their personality in terms of train or plane travel. As this thesis aims to create an initial measurement on which future generational replacement theorists can use the results in the construction of their own studies a larger group of individuals needed to be sampled than what could be accomplished by interviewing. To facilitate this process, the investigated factors were limited to the four factors mentioned above in order to be applicable to a larger amount of respondents.
However, it is important to point out that the selections that were made in this thesis involves tradeoffs for both the level of analysis and the generalizability of the results for this and other thesis (Ibid, p. 34). For this reason the results of this thesis is considered applicable to the sampled population exclusively.
2.2 Effect of specific events relevant to the period of measurement
Changes in the distribution of choices and attitudes over time can be traced back to two origins: effects of events specific to the period of measurement and that of generational replacement (Hellevik 2002, p. 14). This thesis focuses primarily on collecting data to map out where the choices and attitudes of the sampled population’s generation lay at the time of the measurement. However, an attempt has been made by the authors to attribute a change in choices and attitudes to the effect of two events considered relevant to the period of measurement. These events are here proposed to be the particularly severe winters of 2009/2010 and 2010/2011, which were both anomalous in terms of their large snowfalls as well as their subsequent perturbation of train travel (Government Offices of Sweden 2011). In the questionnaire this aspect has been attempted to be captured in the question on the influence of service disruptions on the choice of travel means (see Attachment 1).
2.3 Environmental concern in previous generational replacement studies
The perspective of young people has been largely neglected in studies of public opinion since the inception of the environmental movement (Wray-Lake et al 2010, p. 62). It is this premise that Wray-Lake et al (2010) sets out to rectify with their multi-decadal (1976-2005) generational replacement study of young people’s attitudes, beliefs and behaviour towards the environment in the USA. They found environmental concern to be declining steadily across a wide range of
indicators since the beginning of the period of measurement until the end of the time period of measurements (Wray-Lake 2010, p. 82-83). A brief increase in the level of environmental concern was detected in the early 1990s which subsided shortly afterwards to join the overall downward trend (Ibid). In particular personal responsibility for the state of the environment among young people is declining and that the current trend is suggesting young people to assign this responsibility to the government and consumers (Ibid). Wray-Lake et al (2010, p. 83)
conclude that young people’s perspective is in need of a renewed focus and better environmental education as well as governmental leadership is needed.
Similar conclusions are drawn from a Norwegian generational replacement study covering the period 1991-2001 (Hellevik 2002, p. 18). The study finds the over time the general Norwegian population is worrying less about environmental problems, has experienced declines in their pro-environmental attitudes as well as in their pro-environmentally friendly behaviour (Ibid). Young people are modestly more aware about environmental problems and are more likely to give political priority to these concerns, however “The young apparently lag far behind their parents and grandparents when it comes to personal sacrifices for the sake of the environment” (Hellevik 2002, p. 18). Hellevik (2002) attributes this generational replacement trend to rising prosperity, particularly from the late 1980s onwards, when it is proposed that affluence lead to immediate gratification of desires which in turn lead to environmental concerns to slip into the background (Ibid, p. 18). This detected trend Hellevik (2002, p. 18) suggests, signifies increasing barriers for preventing environmental deterioration in the future (Ibid).
Turning now to Sweden, although technically not a generational replacement study, Harring et al (2011) is relevant to this thesis as their study attempts to explain the measured fluctuations in environmental concern that has been expressed over time by the general Swedish population in the period 1987-2010. The fluctuations of environmental concern were viewed through the influence of economic cycles, media coverage and ecological modernization (Harring et al 2011, p. 390-393). Their findings suggests the influence of economic cycles on environmental concern to be diminishing overall, although still remaining detectable; an economic downturn can be expected to be associated with a downturn in environmental concern (Ibid, p. 398). The amount of media coverage was also found to have an influence, where more coverage could be expected
to be associated with increasing environmental concern (Ibid). Ecological modernization, a discourse stating economic growth to be reconcilable with environmental concern, was proposed as explaining the diminishing influence of economic cycles on environmental concern (Ibid).
From these three examples of environmental concern, it is possible to conclude that
environmental concern has experienced a decline among young people in the USA (Wray-Lake et al 2010) and Norway (Hellevik 2002). From Sweden (Harring et al 2011) it is possible to conclude that ecological modernization has been having a negative influence on the linkage between economic cycles and environmental concern in the general population. The findings of these studies lend both credence and urgency to this thesis’s aim of commencing initial
measurements of the choices of young people, as represented by students at Malmö Högskola, to travel with either train or plane. The ultimate goal is then for this thesis to help enable future generational replacement studies on this topic. In accordance with this ambition it is imperative to first determine how the distribution of the choice of travel means lay in Sweden.
2.4 Elaborating on the distribution and significance of the choice of travel
means
It is possible to determine how the contemporary choices of means of travel are distributed in the Swedish population. This distribution is available in the nationwide communications survey from 2007, which was carried out by the Swedish Institute for Transport and Communications
Analysis and covered the years 2005-2006 (SIKA 2007, p. 3). The SIKA (2007) survey was conducted to provide information for future policy decisions on topic as far ranging as national and regional transport policy, development of infrastructure, transport services, traffic safety and research and development (Ibid, p. 9).
The SIKA (2007) survey found the primary choice of travel means by the Swedish population to be the car, which was preferred in 70 % of all undertaken journeys (SIKA 2007, p. 8). In line with the findings of SIKA (2007) heat trapping gas emissions associated with car travel and more generically, road transports, are being addressed through policy measures by the Swedish Government (Ministry of the Environment 2009, p. 47-50). For this reason road transports were excluded from this thesis. Furthermore, since emissions from road transports are being addressed
with policy measures, the focus of this thesis was instead turned to the segments of the transport sector that currently lacks similarly stringent policy measures: train and plane travel.
For journeys of >100 km, about 12% of the population chose train travel and roughly 7% plane travel (SIKA 2007, p. 36-37). This division between train and plane travel is important to the findings of this thesis. When car and other means of travel are excluded, two thirds of the Swedish population choose train travel while about a third choose plane travel. If the findings of this thesis detect a different distribution of the preferred choice of travel than that of the Swedish population as a whole, this would be considered a significant initial finding on which future generational replacement studies could elaborate on.
In 2010, domestic plane travel in its totality contributed five times the emissions of heat trapping gases as compared to the totality of contributions from domestic train travel (Swedish
Environmental Protection Agency 2012, p. 72). It is in consequence of these numbers that this thesis classifies train travel as a low emission travel choice and plane travel as a high emission travel choice.
The Swedish Government refers the lack of policy measures aimed at reducing emissions from in particular plane travel, to the assumption it has included in the projections of future travel
patterns of the population; the popularity of domestic plane travel is projected to decline with time as travelers increasingly will migrate to domestic train travel instead (Ministry of the Environment 2009, p. 47-50). However, the validity of this assumption has recently begun to be tested as observational data disagrees with its premise. The growth of domestic passenger travel by train has been stagnating since 2009 (Transport Analysis 2011a, p. 27, 50). On the other hand, domestic passenger travel by plane has been growing by 3 % during the same time period, both in terms of absolute passenger numbers but also in total kilometers travelled per passenger (Transport Analysis 2011b, p. 7, 9, 11, 21). The implication of these tentative figures further underlines this thesis’s interest in focusing on the process of choosing between train and plane travel.
2.5 Limitation of the thesis: Four hypotheses
In order for this thesis to better achieve its goal of commencing an initial measurement on which future generational replacement studies expand and build on, four hypotheses have been
proposed, targeted and measured with the questionnaire.
To construct the four hypotheses of this thesis, the perspective as articulated by Lindén (1994) on lifestyle choices, acted as starting point. Lindén (1994, p.26) distinguishes between an
individual's way of life, ideal lifestyle and realized lifestyle. According to Lindén (Ibid) the individual’s ideal lifestyle arises as a reaction to the way of life that is possible for the individual within the hierarchical structure of society which uphold its promoted way of life through laws, norms and recommendations. The individual’s way of life is constantly shaped by striving to achieve his or hers ideal lifestyle. In this sense the individual has a constant yearning to incorporate as many facets from the ideal lifestyle to his or her actual way of life in order to moves toward what Lindén (Ibid) names: the realized lifestyle. The origin of the hypotheses are constructed with this model in mind. The ideal lifestyle is proposed to influence the choice of travel means by the respondents in terms of speed, cost, comfort and environmental concern.
Furthermore, the concept of cognitive dissonance as introduced by Festinger (1957) has been included in the hypothesis. Cognitive dissonance argues that people desire to behave consistently and this has been showed to be present in their lifestyle choices (Thøgersen 2004, p. 100).
Concluding this chapter is a rundown of the hypothesis that have been investigated for their effect on the choice between train and plane travel from Malmö to Stockholm.
2.5.1 Hypothesis 1: Maximization of leisure time
Hupkes (1982 p.38) describe time as a scarce resource. He points out that when an individual gets more return on his work the value of his leisure time increases as it will be longer. If the individual can achieve the same amount of work or other obligatory activity in less time, he will have more leisure time. Travel is an obligatory activity if the individual is to reach his
destination. When travelling frequently the potential increase in leisure time by traveling faster will be greater. Hupkes (1982 p.38) points out that two major strategies for maximizing leisure time exist, to do more than one thing at the same time and to do the same work in less time by
allocating less time to the activity. To travel faster would be to allocate less time for the same activity.
The questionnaire attempts to circle in factors related to maximizing of leisure time by asking how frequently the population travels, what opinions they have regarding what is the fastest means of travel and whether faster travel time is a factor when they choose means of travel. The first part of the hypothesis is that frequent travelers will be more inclined to travel fast as it will increase their leisure time and thus increase the value of their total leisure time. The second part of the hypothesis is that respondents who care about the speed of travel will be more inclined to choose the fastest means of travel as it will require less time to be allocated to travelling.
2.5.2 Hypothesis 2: Substitute goods
Economic goods or services can have a price relationship with other goods or services so that changes in the price point on one affects the price point of the other (Mankiw 2011, p.70). This type of relationship exist when goods or services are close enough to replace one another. Mankiw uses the term “substitute goods” to describes the type of goods that exist in a
relationship like this. Travel by train and plane are substitute goods to one another since they both have the same task of taking the traveler to his or her destination. The price relationship that exist between such substitute goods is that when the price of one drops, the other must follow or risk losing its consumers. Mankiw (2011, p.70) also describes how goods can be normal or inferior. Normal goods increase in demand when the consumer has more money while inferior goods do the opposite. Inferior goods in terms of travel is a cheaper, but less desirable means of travel that the consumer chose when he or she has less money.
The thesis thus states that there is a competition between the two substitute goods of traveling by plane or train and that one is less desirable (an inferior good) because it doesn’t offer the
consumer all that he or she wants from the travel. This type of inferiority could be due to slower speed, lower cost, less comfortable or less environmentally friendly. If this thesis is to be true, then the consumer will be more willing to compromise when he or she has less income and those consumers that concern themselves greatly with price will be more willing to compromise on other aspects of the traveling than those who concern themselves less with the travel cost.
2.5.3 Hypothesis 3: Deprivation of comforts
Classical psychological theory states that people have a series of basic wants or drives that need to be satisfied (McFadden 1974, p.304). If these wants or drives are not satisfied it leads to increased activity, which in turn increases the level of deprivation from these wants and drives. The questionnaire makes an attempt to circle in potential wants and drives the sampled
population may have and in addition allows the respondents to answer from a pre-populated list what they consider important comforts (see Attachment 1). Examples include: the ability to purchase food onboard the vehicle, access to internet or a low noise level. Furthermore, the questionnaire asks for the opinions of the sampled population on the comfort level in train and plane travel as well as the influence of service disruptions (e.g. cancelled flights due to weather) and if it affects their travel choice.
The hypothesis states that individuals who travel often will be more inclined to decrease the deprivation of their wants and drives because these grow in significance the more they travel. Because of this, the list of comforts has been estimated from what the traveler would have had when not traveling (e.g. toilet and internet). What correlation comfort has to the other factors in choosing means of travel will be investigated in order to determine how important role it has.
2.5.4 Hypothesis 4: Environmental concern
Individuals with high environmental concern are expected to choose travel means accordingly. These individuals have a constant yearning to incorporate many facets from the ideal lifestyle of concern for the environment to their way of life and consequently move toward a realized lifestyle (Lindén 1994 p.26). Pro-environmental attitudes can to some extent affect travel behaviour (Nilsson & Küller 2000, p. 228). For pro-environment attitudes to translate into behaviour, this thesis expects those that nurture these types of attitudes to always or most often travel by train. Environmental friendliness should be the most important determinant factor when choosing means of travel for these respondents and their opinion should be that train is most environmentally friendly means of travel. Acknowledging heat trapping gas emissions as
significant when choosing means of travel should also be present and the means of travel should not change after graduation if the respondent travelled most often or always by train.
Chapter 3 - Method and Material
3.1 Questionnaire
This thesis collected its empirical data with a questionnaire consisting of 14 questions (see Attachment 1). The targeted population was students at Malmö Högskola. In total 254 people were asked to fill in the questionnaire of which 248 did so, giving this thesis a participatory answering rate of 98 % which is much higher than the Swedish average of 75-80 % (Esaiasson et al 2007, p. 210-211). Before handing out the questionnaire, the potential respondents were asked if they had in fact travelled between Malmö and Stockholm and if they were students at Malmö Högskola. The four introductory questions of the questionnaire target the background details of the respondent: age, gender, study pace and income level, while the remainder of the questions targets the respondents current travel behaviour, opinion and choice of either train or plane while travelling between Malmö and Stockholm. The questionnaire then ends with a question about the respondents estimated future travel behaviour as well as their view on their personal choice of means of travel and its significance in terms of carbon footprints.
3.2 Sampling
In order to be able to generalize the results to a broader segment of the general population, Esaiasson et al (2007, p.195-196), emphasises random sampling as the preferred and superior method to be used on theory testing or descriptive surveys. However, he also points out that when testing theories it is sometimes better to target a larger sample of respondents by using nonrandom sampling than getting a possibly smaller sample of respondents by sticking to a strict random sampling. During the initial attempt of completing this thesis there was an attempt to use true random selection although it yielded too few respondents.
The thesis alternated its targeted population to include all students on Malmö Högskola who has ever travelled the distance between Malmö and Stockholm without changing the questions in the questionnaire. Esaiasson et al (2007, p.95) explains how the best types of selections are complete selection and true-random sampling. All the students of Malmö Högskola represent the total sample of the group being tested, but there existed no feasible way of giving the questionnaire to
all of them. Esaiasson et al (2007 p.95) points out that it is beneficial to borrow components from a true random sampling to strengthen lesser means of sampling.
In order to strengthen the non random sampling used in this thesis it was collected during two different times of the day on two different days. On the first day, Thuesday 10th of April, respondents were asked to fill in the questionnaire from 12:00 and 16:00. On the second day, Wednesday 11th of April, respondents were asked to fill in the questionnaire from 8:00 and 12:00. These two time intervals represent a full day that students could have classes on. The aim was for the sampled population to reflect the gender and age distribution of the total population of students at Malmö Högskola, figures from 2010 puts the distribution of the genders as constituted by 67 % women and 73 % of the students being less than 30 years old (Swedish National Agency for Higher Education 2011). The distribution of the sampled population in this thesis was 65 % women and 83 % were under 30 years of age. To accomplish this all but the working staff at Malmö Högskola’s library “Orkanen” were asked to fill in the questionnaire on both occasions. Unavoidably excluded from the sample population were all students who did not frequent Orkanen at the time of the sampling as it was not possible to locate those individuals.
3.3 Data entry
The three types of data that were collected in the questionnaire was interval, ordinal and nominal. Scale are variables that shares the same absolute distance to one another, examples given: age, income (Esaiasson et al 2007 p.395-396). 20 years is 5 years from 25 years and 25 years is 5 years from 30 years. The ordinal scale is variables that can be arranged on a scale, but have no absolute distance to one another, used mostly when measuring attitudes. Example given: to say something is “very important” has no absolute distance to saying something “not very important”. Nominal is a variable that is categorising and cannot be arranged in any way, example given: gender. In order to investigate the data, the results of the questionnaire was added to a statistical program. In order to be able to make use of a greater number of statistical test types certain data was added twice as different data types. Scale variables in cases where scale variables needed to be cross tabulated with ordinal variables, the scale variable had to be divided into ranked groups to effectively become an ordinal variable (Pallant 2004, p. 81-84). This was done, for example, for the variable frequency of travel, which was divided into three
groups, below average, average and above average travel frequency. The division was done according to the percentile cut off point of the scores, with below average being from 0 and up to the 33.33 percentile value, the average being between 33.33 and the 66.66 percentile value and consequently the above average travel frequency group were above this value (Ibid).
3.4 Descriptive statistics
Descriptive statistic methods were used on all variables to determine the characteristics of the sampled population and to assess the magnitude of missing data (Pallant 2004, p. 51).
3.4.1 Frequencies
Frequencies of answers was extracted in order to determine how common certain answers on the nominal variables were and how many missing responses had been received (Pallant 2004, p. 51-52).
3.4.2 Continuous variables
For continuous variables, on the both scale and ordinal variables, descriptive statistics with summary values was used to determine the mean, standard deviation, minimum, maximum, skewness and kurtosis of the values (Pallant 2004, p. 52-54). Decimals to the variables have been rounded off to even numbers where possible. This caused the percentage count to exceed one hundred in isolated cases.
3.5 Assessing the normality of the sampled population
As a non random sampling method was used to collect the data an assessment of the normality of the sampled population was done. Analysing collected data can be conducted by opting for one out of two statistical techniques: parametric or nonparametric. The techniques differs in the sense that they make fundamentally different assumptions about the collected data (Pallant 2004, p. 255). The parametric technique makes an assumption about the shape of the data and assumes the sampled population to be normally distributed, in line with what a theoretical total population would be, while the nonparametric technique makes no such assumption about the data (Ibid). In addition, nonparametric tests tend to be less sensitive than their parametric counterparts when it
comes to detecting correlations between variables, as the former might not find one where the latter might have had (Ibid, p. 255).
Performing a test of normality on the whole sample permitted the determination of which
statistical technique to use (Ibid, p. 54). A Kolmogorov-Smirnov test was conducted to determine normality (Ibid, p. 58). The test showed the collected data on all variables to not be normally distributed as the resulting values were less than the threshold value of 0.05 (see Attachment 2) and thus lead to the conclusion that the nonparametric statistical technique should be used (Pallant 2004, p. 58, 78). Additional outputs from that tests also showed positive values for both skewness and kurtosis. A positive skew indicates the scores to be more clustered on the left side of the mean value and for the tail of the distribution to be longer on the right side than on the left side of the mean (Ibid, p. 53-54). A positive kurtosis indicates that the shape of the distribution is relatively peaked around a center value and tends to have long thin tails stemming from this center (Ibid).
For the sampled population not to be normally distributed was an expected characteristics of the collected data since it necessarily had to reflect the underlying nature of the construction of the sample (Ibid, p. 59). Not normally distributed data samples tend to be quite common in social science research and measurements (Ibid, p. 59, 172). It is therefore strongly recommended to enlarge the sample size above at least 30 respondents (Ibid). An important caveat to the results of this thesis: the data collected from the sampled population and its accompanied analyses are not appropriate to extrapolate on a total population, as the results cannot be considered to be
representative beyond the sample itself. Put in another way: generalization is suitable only within the sample itself.
3.6 Statistical analyses - cross tabulations
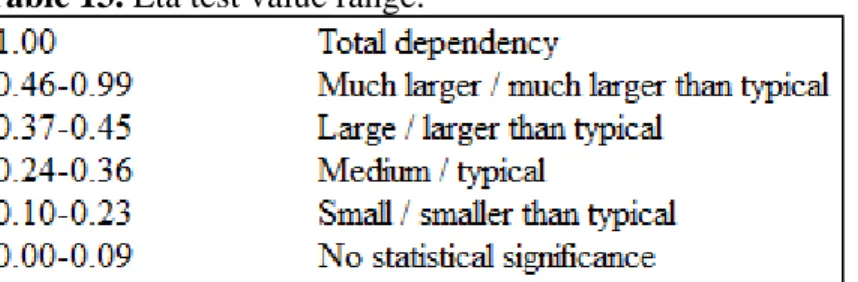
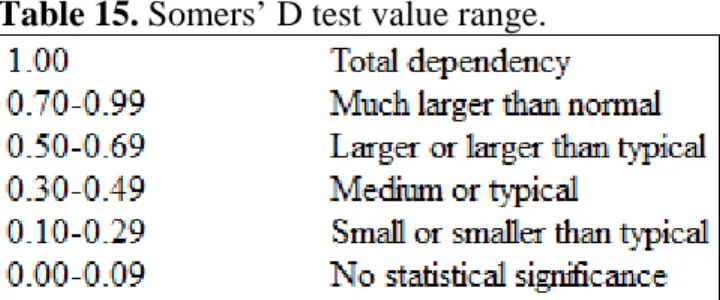
To determine correlation between factors cross tabulations between data was used. Cross tabulations compares one or more variables to one or more other variables. Only test types suitable for nonparametric data was used in order to produce usable results (see discussion in chapter 3.2 and 3.3). Eta test, somer’s d test and Chi-square test was being used (see Attachment 2).
Chapter 4 - Descriptive statistics of the sampled population
4.1 Background of the sampled population
The background of the sampled population is presented through frequencies of answers to questions regarding their backgrounds. The frequencies of responses show that the population’s background is close to what we would expect students at Malmö Högskola to be.
4.1.1 Age
The majority (73 %) of the students at Malmö Högskola are less than 30 years old (Swedish National Agency for Higher Education 2011). In the sampled population 83 % were under 30 years of age. See results from our sampled population below in chart 1.
Chart 1. Age distribution of the sample. Standard deviation is illustrated with the symbol ±. Mode and median age was 25 while the mean age was 26.
4.1.2 Gender
Statistics presented by the National Agency for Higher Education show that 67 % of the students at Malmö Högskola are women (Swedish National Agency for Higher Education 2011). Of the respondents participating in this thesis: 64 % of the population were women, only 3 % difference
from the total population at Malmö Högskola. See results from our sampled population in chart 2.
Chart 2. Gender distribution of the sample. 64 % were women and 36 % men.
4.1.3 Study pace
The study pace of the sampled population can be seen in chart 3. No data could be collected for the study pace of the total population at Malmö Högskola as no such data were available.
Chart 3. Distribution of part-time and time students. The vast majority (94 %) were full-time students. A speculative explaination to this distribution might be that part-full-time students are less often at Orkanen than full-time students and as a result they could not be targeted.
4.1.4 Monthly income level
The monthly income level of the sampled population is presented through its calculated mean, median and mode values that can be seen in chart 4 below. The sampled population’s income level range allows for the statistically inferred conclusion that the majority of the population is receiving financial aid for their studies from the Swedish Government authority body CSN in
charge of such aid. The current level of financial aid from CSN is 8920 SEK a month (CSN 2012).
Chart 4. Monthly income levels. Standard deviation is illustrated with the symbol ±. It was inferred from the distribution of income levels that the majority of the sampled received financial aid from CSN.
4.2 Frequency and distribution of answers in the sampled population
How common specific answers is among the sampled population is presented through frequencies of answers to questions regarding their attitude and behaviour towards train and plane travel.
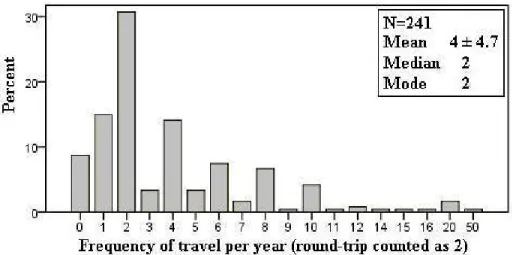
4.2.1 Frequency of travel per year
The yearly frequency of travel among the sampled population is presented through its calculated mean, median and mode values that can be seen in chart 5 below. The sum total of yearly
Chart 5. How often do you travel between Malmö to Stockholm on a yearly basis? Standard deviation is illustrated with the symbol ±.
4.2.2 Purpose of travel
The purpose of travelling between Malmö and Stockholm among the sampled population is presented in table 1. The respondents had the possibility to choose more than one alternative as their stated purpose of travel.
Table 1. What is usually the purpose of your travel? Multiple answers possible.
The most common purposes given by the sampled population were to visit friends and family and to make a pleasure trip as reasons for travelling between Malmö and Stockholm.
4.2.3 Most commonly used means of travel
Of the sampled population 37 % travelled always by train, 30 % most often by train, 15 % equally by each, 12 % most often by plane and 6 % always by plane. The most commonly used means of travel from Malmö to Stockholm is presented in chart 6.
Chart 6. Which means of travel do you use most often? Train travel was the most commonly used means of travel for more than two thirds of the sampled population. This is a deviation from the general Swedish population were slightly less than two thirds travel by train on a comparable distance (SIKA 2007, p. 36-37).
4.2.4 Opinions about train and plane travel
Opinions about which means of travel the sampled population considered to be the fastest, cheapest, most environmentally friendly and had the highest comfort level are presented in charts 7.
Chart 7. Opinions about the fastest, cheapest, most environmentally friendly and the highest comfort means of travel. The majority of the sampled population considered plane the fastest and train to be the most environmentally friendly means of travel. A slight majority considered train travel to be both cheaper and more comfortable.
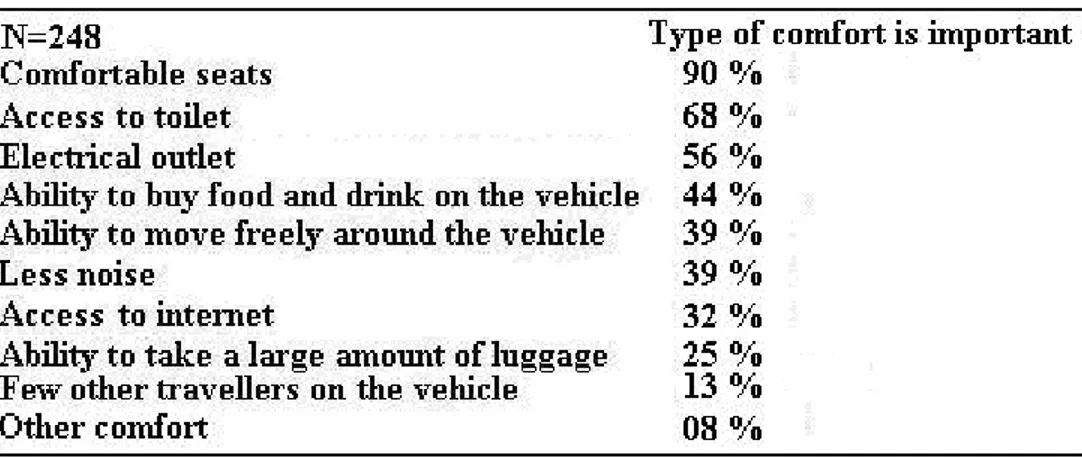
4.2.5 Comfort factors
The sampled population were asked to specify from a pre-populated list of comfort alternatives, which comfort aspects they considered important when travelling. The results are presented in table 2.
Table 2. Which comfort factors are important? Multiple answers possible.
The bare necessities: comfortable seats, access to toilets and electrical outlets were listed as important comforts by over half of the sampled population. Secondary comforts listed as important by a third of the sampled population consisted of food and drinks, to be able to move freely around the vehicle, a low noise level and access to internet.
4.2.6 Ranking of determinant factors
The sampled population was asked to rank four factors according how determinant each factor was on the choice of means of travel between Malmö - Stockholm (see Attachment 1). The ranking contained: not at all, partially, largely and completely. Of the respondents in descending order of importance: cost was considered completely or largely important by 80 %, speed was considered largely or partially largely important by 80 %, comfort was considered largely or partially important by 82 % while environmental concern was considered not at all important by 36 %, partially by 35 % and largely by 22 %. Italics were used here to signify the most important findings. The results are presented in chart 8.
Chart 8. How would you rank these determinant factors on the choice of your means of travel? Price had the strongest influence on the choice of means of travel, followed by speed then comfort and lastly by environmental concern. This finding is consistent with Nilsson & Küller’s
(2000) study that finds environmental concern to have a subordinate position in travel behaviour.
4.2.7 Influence of service disruptions
The sampled population were asked to answer if service disruptions affect their choice of travel between Malmö - Stockholm by train or plane. Available alternatives were: no effect, opts out of travelling by plane and opts out of travelling by train. The results are presented in chart 9.
Chart 9. Does service disruptions have an effect on the choice of your means of travel? Most respondents were not affected by service disruptions. However, respondents stating they were affected were more likely to opt out of travelling by train.
4.2.8 Ranking of influence from external factors
The sampled population were asked to rank how frequently promotions from airline companies and train companies influenced their means of travel between Malmö - Stockholm. They were also asked to rank how frequently claims about the train’s environmentally friendliness
influences their choice of means of travel. Finally they were also asked how frequently a desire to reduce their personal carbon footprint influenced their choice of means of travel. The results are presented in chart 10.
Chart 10. Does travel promotions and/or environmental concerns affect your choice of means of travel? Half or more than half of the respondents stated to be rarely affected by any of purposed variables. About a third of the respondents stated to be sometimes affected by promotions and/or environmental concern while between 10-20 % stated to be often affected by the same.
Environmental concern had a slight higher level of respondents who stated it to be often influential on their choice of travel means.
4.2.9 Keeping means of travel after graduation
The sampled population were asked to answer if, after their graduation, they will still keep the same means of travel between Malmö to Stockholm. The results are presented in chart 11.
Chart 11. Do you keep your travel behaviour after graduation? Over half of the sampled
population stated that they will keep their used means of travel after graduating. However, over a third was not sure if they would change means of travel and 9 % said that they would change. This introduces an uncertainty to the results and conclusion of this thesis and suggests that a time-series with similar measurements over time would be needed to reduce this uncertainty.
4.2.10 The personal choice of means of travel and the carbon footprint
The sampled population were asked if they considered their personal choice of means of travel between Malmö to Stockholm to be significant in terms of carbon footprints. The results are presented in chart 12. Available alternatives were, no, my personal contribution is not significant (presented as insignificant in the chart), yes, all small contributions count (presented as
Chart 12. Do you consider your personal choice of means of travel to be significant as a contributor to the greenhouse effect? The majority of the sampled population considered their personal choice of travel means to be a significant contributor of heat trapping gas emissions.
Chapter 5 - Results and Analyses
5.1 Hypothesis 1: Maximization of leisure time
Cross tabulations were done in order to determine how much leisure time an individual have and if anything is done to increase it.
5.1.1 Most used means of travel and its impact on determinant factor speed
To determine whether a potential correlation could be made between the independent variable most commonly used means of travel and the dependent variable determinant factor speed a somers’ d test was conducted. The result gave a value of 0.44 which indicates a medium correlation (see Attachment 2). In other words, it was found to be more common among travellers who always or most often travel by plane to rate the determinant factor speed as important.
5.1.2 Frequency of travel and its impact on determinant factor speed
To attempt to seek out a correlation between the independent variable frequency of travel and the dependant variable determinant factor speed. To be more manageable the variable frequency of travel was divided into three ranked groups to create an ordinal scale variable (Pallant 2004, p. 81-84). This new ordinal variable was then tested with somers’ d. The three groups of the frequency of travel variable is presented in table 3.
Table 3. The respondents were divided into groups according to their stated frequency of travel.
The correlation between these three groups ranking of importance for the determinant factor speed was then investigated through a somers’ d cross tabulation. No correlation could be found as the resulting value (0.07) failed to reach the detectable effect size level of 0.1 (see Attachment 2).
5.1.3 Opinions about fastest means of travel and its impact on most commonly used means of travel
A chi-square test was done to determine a correlation between the independent variable opinion about the fastest means of travel and the dependent variable most commonly used means of travel. The chi-square test gave a value below 0.001 which indicates a statistically significant correlation (see Attachment 2). Respondents who considered plane travel to be the fastest means of travel also travelled by plane most often (see chart 13).
Chart 13. Opinion about the fastest travel means and its correlation to the most commonly used means of travel. A curious split: train travellers considered train the fastest while plane travellers considered plane the fastest. In the chart it can be seen that no one who mostly, or always travel by plane consider train the fastest means of travel.
5.1.4 Frequency of travel and its impact on the opinion about the fastest means of travel In order to determine if frequent travelling had an impact on opinions on what means of travel was the fastest an Eta test was conducted. Three groups of frequency of travel was constructed and used for this test (see table 3 in 5.1.2).The test gave an Eta value of 0.25, which is a moderate effect. Eta squared was 0.06 which is a moderate effect. The average number of trips was close to equal in both categories of opinion. However, none of the respondents who took more than 12 trips a year considered the train to be faster, which tilted the correlation between higher frequency of travel per year and the opinion that planes are faster. The conclusion drawn from this is that there is a vertex of 12 yearly trips after which travelers cease to consider train travel as being faster than plane travel. The values can be seen in chart 14.
Chart 14. How frequency of travel affects the opinion about the fastest means of travel. Frequent travellers were found to be more likely to consider plane travel to be faster.
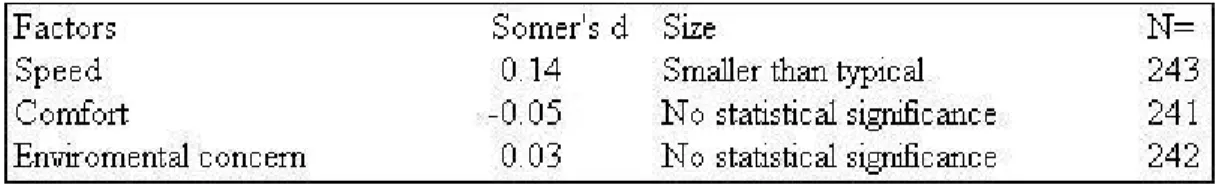
5.1.5 Determinant factor speed and its impact on other determinant factors
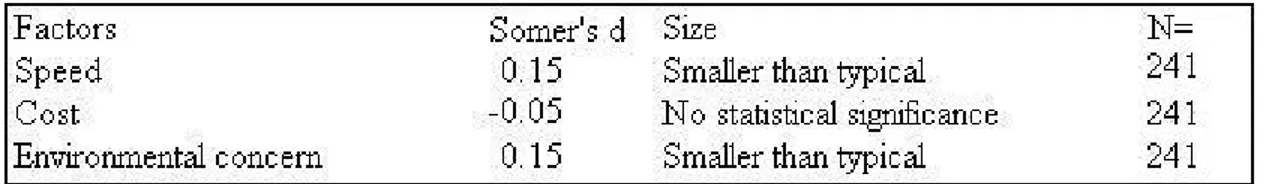
Three somer’s d tests were done to determine correlation between speed as determining factor in choosing means of travel and other determining factors. Speed was the independent variable
being tested against the other 3 factors. A negative value means that the respondents who though speed was important did not consider the negative factor was important. See results in table 4
Table 4. Speed and its correlation to the other investigated determinant factors.
.
Respondents who ranked speed as highly important were also likely to rank both cost and comfort highly. These respondents were less likely to rank environmental concern as important.
series of cross tabulations have been made to test whether train and plane travel are substitute
used means of travel and its impact on cost as determinant factor o determine whether the independent variable most commonly used means of travel could be
d.
o determine whether the independent variable frequency of travel could be correlated with the el a somers’ d test was
5.2 Hypothesis 2: Substitute goods
A
goods to one another.
5.2.1 Most commonly T
correlated with the dependent variable determinant factor price a somers’ d test was conducte The test value was 0.04 and is not statistically significant (See Attachment 2).
5.2.2 Frequency of travel and its impact on determinant factor cost T
dependent variable cost as determined variable in choosing means of trav
done. The somer’s d value was 0.1 which is indicative of small correlation. Above average frequent travellers were more likely to rate the importance of cost as largely and completely determinant on their choice of means of travel (see chart 15).
Chart 15. Frequency of travel and determinant factor cost. Respondents who travelled more frequently were more influenced by cost. Determinant factor cost was ranked as the highest influencing factor of the four factors investigated by the sampled population (see chart 8).
5.2.3 Opinions about cheapest means of travel and its impact on most commonly used means of travel
To determine whether the independent variable opinion about the cheapest means of travel could be correlated with the dependent variable most commonly used means of travel a chi-square test was conducted. The resulting value was less than 0.001 which indicates a statistically significant correlation. Respondents who considered plane travel to be the cheapest alternative also travelled by plane most often and the opposite was also true for train travellers (see chart 16).
Chart 16. Opinions about the cheapest travel means and the most commonly used means of travel. A curious split: train travellers considered train cheapest while plane travellers considered plane cheapest.
5.2.4 Frequency of travel and its impact on the opinion about the cheapest means of travel To determine whether the independent variable frequency of travel could be correlated with the dependent variable opinion about the cheapest means of travel an eta test was conducted. The eta test value was 0.29 which indicates a moderate correlation. The eta squared value was 0.08 which is also a moderate effect size. Frequent travellers were more likely to consider plane as cheapest means of travel, while the less frequent travellers considered train as cheaper.
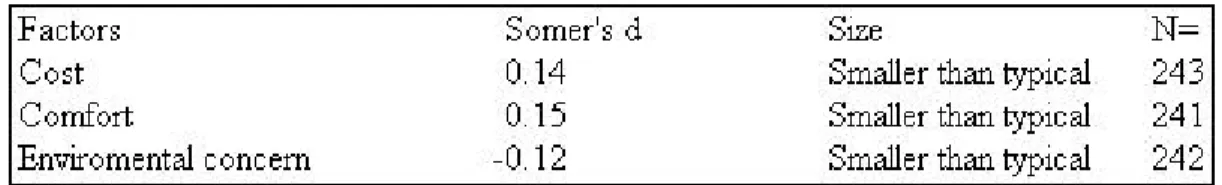
5.2.5 Determinant factor cost and its impact on other determinant factors
Three somers’ d tests were conducted to determine whether a correlation could be found between the independent variable determinant factor price and the dependent variables speed, comfort and environmental concern (see table 5).
Table 5. Cost and its correlation to the other investigated determinant factors.
Respondents ranking cost as highly important were also more likely to rank speed as highly important.
5.2.6 Promotions on travel by train and plane
A somer’s d test were done to determine if the same respondents who were affected by promotions from airline companies also were affected by promotions from train companies. Among the respondents who was affected by plane travel promotions, how many was also affected by promotions on train travel? The somer’s d gave a positive value of 0.52, which is a larger than typical statistical significance. The reversed test, how many among those affected by promotions on train travel were also affected by promotions on plane travel, gave a positive value of 0.5, which is a larger than typical statistical significance. This indicated that train and plane travel can be considered to be substitute goods to one another and thus are competing for the same consumers with their promotions.
5.2.7 Income level and its effect on determinant factors
To attempt to seek out a correlation between income level and its effect on determinant factors. The income level needed to be divided into three ranked groups to create an ordinal scale variable (Pallant 2004, p. 81-84). The new ordinal variable is then usable for analysing with somers’ D. Income level was divided into three ranked groups presented in table 6.
Four somers’ d tests were then conducted to seek out a correlation between the effect of income level on the determinant factors. No statistically supported significant results could be found for any of the four tests as the values were too low. See table 7 and Attachment 2.
Table 7. Effect of income on determinate factors
Income level could not be found to have a correlation with any of the determinant factors. It is possible that the uneven distribution of the respondents income levels could have been a contributing factor to this result.
5.2.8 Effect of income on comforts
Cross tabulations were done to determine how income affects the importance of comforts. Positive results means that the higher income the respondent had, the higher is the probability that he or she cares about the listed comfort. Negative results means that the higher income the respondent had, the lower is he or she cares about the listed comfort. See table 8 for results.
Table 8. Income level and important comforts.
These values show that the higher income the respondent had, the less he or she cares about the various types of comforts. This goes against our thesis that individuals with less income will be more willing to compromise on other aspects of travelling. However, it is possible that the
uneven distribution of the respondents income levels could have been a contributing factor to this result.
5.2.9 Effect of income level on the opinion about the cheapest means of travel
An eta test was conducted to determine whether income level had an effect on the opinion about the cheapest means of travel. The eta test produced a value of -0.46 which indicates a much larger than normal association between the variables. The eta squared value is -0.21 which is a large effect size and suggests that income level explains 21 % of the variance of the variable opinion about the cheapest means of travel. Respondents with medium and low income were more likely to consider train as the cheaper means of travel.
5.2.10 Effect of income level on the opinion about the most comfortable means of travel An eta test was conducted to determine whether income level had any effect on the opinion about the most comfortable means of travel. The eta test produced a value of -0.43 which indicated a large association the variables. The eta squared value is -0.19, a large effect size which explains 19 % of the variance of the comfort variables. Positive results means that the more income the respondents has, the higher the probability that respondent hold the opinion that plane travel is more comfortable, while negative values indicates that the less income the respondent has, the higher the probability is that he or she hold the opinion that train travel is more comfortable. Therefore, the results show that lower income levels can be associated with the opinion that train travel is more comfortable. Missing responses for these variables attained 11.6 %.
5.2.11 Income level and its effect on travel promotions by train or plane
Two somers’ d tests were conducted to determine whether the income level affected the influence posed by promotions on train or plane travel. The test yielded no statistically significant association between income level and promotions on train travel, which gave the value 0.05 and neither on income level and promotions of plane travel, which gave the value 0.03.
5.2.12 Income level and the most commonly used means of travel
To determine whether income level could be associated with the most commonly used means of travel an eta test was performed. The eta value 0.15 indicates a small correlation. Eta squared was 0.02 which also indicates a small effect on the variance. Broken down according to income level, the results show that train was the most common means of travel for all three income levels. Plane travel was most common within the high income group, but also within the low income group. The medium income group were less likely to travel by plane (see chart 17).
Chart 17. Income level and the most commonly used means of travel. Both high and low income earners were more likely to be plane travellers.
5.3 Hypothesis 3: Comfort
Cross tabulations have been done in order to test if a higher frequency of travelling has an impact on demand for comforts.
5.3.1 Most commonly used means of travel and its impact on the determinant factor comfort
To determine whether the independent variable most commonly used means of travel could be correlated with the dependent variable determinant factor comfort a somers’ d test was
performed. The resulting value was 0.02 (N=236) which does not indicate a statistically significant correlation.
5.3.2 Frequency of travel and its impact on the determinant factor comfort
To determine whether the independent variable frequency of travel could be correlated with the dependent variable determinant factor comfort a somers’ d test was performed. The resulting value was 0.04 (N=235) which does not indicate a statistically significant correlation.
Respondents who travelled above average were more likely than other travellers to rank the determinant factor comfort as being a partially important when choosing means of travel.
5.3.3 Opinion about most comfortable and impact on most common means of travel To determine whether the independent variable opinion about the most comfortable means of travel could be correlated with the dependent variable most commonly used means of travel a chi-square test was conducted. The resulting probability value of less than 0.01, indicates a statistically significant association. Those who thought plane travel was most comfortable also traveled by plane more often (see chart 18). Those who thought train travel was most
comfortable also traveled by train more often. This shows that comfort does have a large amount of influence on decision regarding what means of travel to use.
Chart 18. Opinion about highest comfort and the most commonly used means of travel. A curious split: train travelers considered train to be more comfortable while plane travelers considered plane travel as the most comfortable of the two.
5.3.4 Frequency of travel and its impact on the opinion about the most comfortable means of travel
An eta test was conducted to determine whether the independent variable frequency of travel had any effect on the dependent variable opinion about the most comfortable means of travel. The eta test produced a value of -0.24 (N=231) which indicated a medium effect. The eta squared value is -0.06, a moderate effect size which explains 6 % of the variance of the dependent variable. Positive results means that the less frequent the travellers is the higher the probability that the respondent thinks train travel is the most comfortable, while negative values indicates that the more frequent the travel is the higher the probability that the respondent considers plane travel to be the more comfortable. Therefore, the results show that frequent travellers can be associated with the opinion that plane travel is more comfortable.
5.3.5 Determinant factor comfort and its impact on other determinant factors
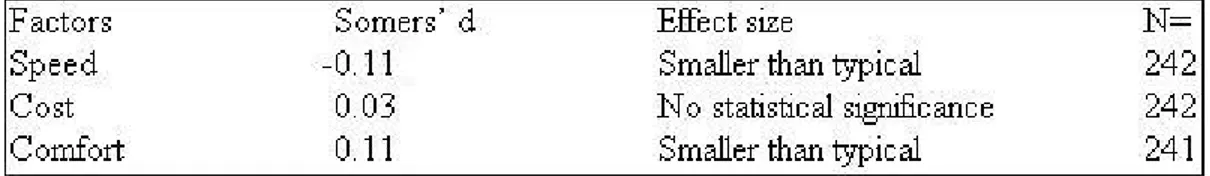
To determine whether the independent variable determinant factor comfort could be correlated with the ranking of the dependent variables speed, cost and environmental concern, three somers’ d tests were performed. Negative results means that respondents who consider comfort important does not consider the dependent variable important. See table 9 for results.
Table 9. Comfort and its correlation to the other investigated determinant factors.
Respondents who ranked comfort as important were also more likely to rank environmental concern and speed as important determinant factors.
5.3.6 Most commonly used means of travel and its impact on the importance of comforts To determine whether the independent variable most commonly used means of travel could be correlated with the dependent variable importance of comforts (see table 2 for a list of these comfort types), chi-square tests were performed. The resulting chi-square values indicated that either the distribution was not sufficiently distributed or the level of chance was too high to be useful for most of the listed comforts.
However, a correlation could be found between most commonly used means of travel and the ability to move freely around the vehicle and the access to electrical outlets as the resulting values were 0.03 and 0.02 (N=241), respectively which indicates a statistical significance. In both cases respondents travelling most often or always by train were more likely to list these comforts as important.
5.3.7 Frequency of travel and its impact on the importance of comforts
Cross tabulations were done to determine how the independent variable frequency of travel effects the dependent variable importance of comforts. Positive results means that the higher frequency of travel, the higher is the probability that he or she cares about the comfort listed.
Negative results means that the higher the frequency of travel, the lower is the probability that he or she cares about the comfort listed. See table 10 for results.
Table 10. Frequency of travel and comforts.
The results of these Eta tests show that contrary to our thesis the less the respondents travel the higher demand for comforts they have.
5.3.8 Most commonly used means of travel and its impact on the influence of service disruptions
A chi-square test was conducted to seek out a correlation between the independent variable most commonly used means of travel and the dependent variable service disruptions. The test yielded no statistically significant results since the distribution was not sufficiently distributed between the different groups. However, it was possible to infer from the resulting percentage of the distribution that respondent’s travelling most often or always by plane were more likely to opt out from travelling by train when considering the influence of service disruptions to their choice of means of travel.
5.3.9 Frequency of travel and its impact on the influence of service disruptions
In order to determine if the independent variable frequency of travel could be correlated with the dependent variable influence of service disruptions on the choice of travel means, an Eta test was performed. The eta test gave a value of 0.33 which is considered to be medium or typical. The eta squared value is 0.11 which is a moderate effect and indicates that 11 % of the variance can
be explained by the frequency of travel. The mean values of trips taken per year for the three possible responses are listed seen in table 11.
Table 11. Service disruptions and how frequently respondents travel.
The majority of the sampled population stated that they were not influenced in their choice travel means (see 4.2.7). The results indicate that frequent travellers are more inclined to opt out from choosing train travel due to service disruptions.
5.3.10 Determinant factors and their impact on the influence of service disruptions To determine whether the independent variables determinant factor comfort, speed, cost and environmental concern could be correlated with the dependent variable influence of service disruptions, four chi-square tests were conducted. The resulting chi-square values indicated that either the distribution was not sufficiently distributed or the level of chance was too high to be useful as indicators of statistical significance.
5.4 Hypothesis 4: Environmental concern
In order to test if any of the pro-environmental attitudes held by the respondents could be shown to have a statistically significant association with the most commonly used means of transport three somers’ d tests were conducted.
5.4.1 Most commonly means of travel and its impact on determinant factor environmental concern
The first test sought an association with a somers’ d test between the independent variable determinant factor environmental concern and the dependent variable most commonly used means of travel. A somers’ d test value was -0.29, which is indicative of a small effect size. Respondents who stated environmental concern as determining factor are more likely to travel by train.
5.4.2 Frequency of travel and its impact on determinant factor environmental concern To determine whether a correlation could be made between the independent variable frequency of travel and the dependent variable environmental concern, a somers’ d test was conducted. No statistically significant correlation could be made as the resulting value of 0.09 (N=236) was too low.
5.4.3 Opinion about most environmentally friendly means of travel and most used means of travel
To determine whether a correlation could be made between the independent variable opinion about the most environmentally friendly means of travel and the dependent variable most
commonly used means of travel a chi-square test was performed. The test yielded no statistically significant results since the distribution was not sufficiently distributed between the different groups and the influence of chance alone were too high.
5.4.4 Frequency of travel and its impact on opinion about most environmentally friendly means of travel
In order to see if the independent variable frequency of travel had any impact on opinion of what means of travel is considered most environmentally friendly an Eta test was done. The value was 0.24 which is considered a typical value. The more the respondents travelled, the more likely they were to consider plane travel to be the most environmentally friendly.
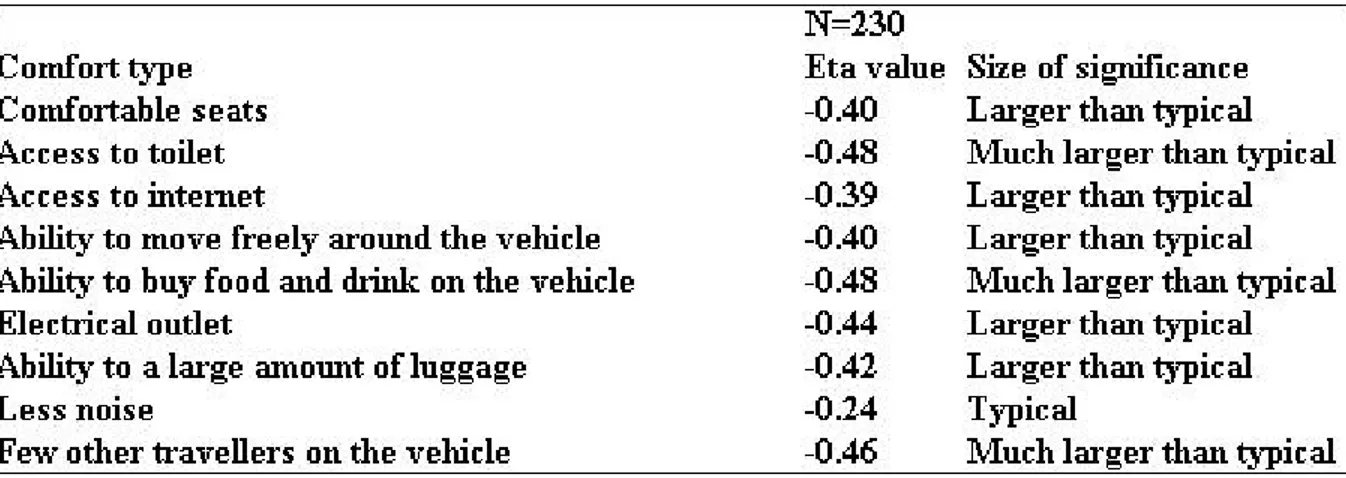
5.4.5 Determinant factor environmental concern and its impact on the other determinant factors
To determine whether the independent variable determinant factor environmental concern could be correlated with the ranking of the dependent variables, the other determinant factors: speed, cost and comfort, three somers’ d tests were performed. See table 12.