Fakulteten f¨or teknik och samh¨alle Datavetenskap
Examensarbete 15 h¨ogskolepo¨ang, grundniv˚a
Controllable Procedural Game Map Generation using
Software Agents and Mixed Initiative
Kontrollerbar procedurell generering av spel-kartor med hj¨alp av mjukvaruagenter och blandat initiativ
Oskar Aderum
Jonathan ˚
Akerlund
Examen: Kandidatexamen 180 hp Huvudomr˚ade: Datavetenskap Program: Spelutveckling
Datum f¨or slutseminarium: 2016-05-31
Handledare: Steve Dahlskog Andrabed¨omare: Bengt J. Nilsson
Abstract
The process of creating content for digital games by hand is a costly and time consuming one. As the game industry expands, the need to reduce costs becomes ever more pressing. One solution to this problem being research today is procedural generation of content. In short, this means that an algorithm does the labor rather than a designer. In this thesis we present such a method for automating the process of creating maps in digital games. Our method uses controllable software agents and mixed initiative (i.e. allowing the designer and algorithm to take turns) to create geometry. We use stochastic agents to create variation and deterministic agents to ensure playability. To control these agents we use a set of input parameters which can be manipulated. Furthermore, the designer has access to a number of tools including the ability to lock existing geometry, convert geometry to other types, add geometry manually, as well as the ability to use agents on specific areas of the map. We look at the game mode Battle in the digital game Mario Kart 64 and show how our method can be used to create such maps. We conducted a user study on the output of the method and the results show that the quality is generally favorable.
Resum´
e
Processen att skapa inneh˚all till digitala spel f¨or hand ¨ar kostsamt och tidskr¨avande. All-teftersom spelindustrin expanderar ¨okar behovet av att minska produktionskostnaderna. En l¨osning p˚a detta problem som det forskas om idag ¨ar procedurell generering av spelin-neh˚all. Kortfattat inneb¨ar detta att en algoritm g¨or det manuella arbetet ist¨allet f¨or en designer. I denna uppsats presenterar vi en s˚adan metod f¨or att automatisera processen att skapa kartor i digitala spel. V˚ar metod anv¨ander kontrollerbara agenter med blandade initiativ (dvs. designern och algoritmen turas om) f¨or att skapa geometri. Vi anv¨ander stokastiska agenter f¨or att skapa variation och deterministiska agenter f¨or att garantera spelbarhet. F¨or att kontrollera dessa agenter anv¨ander vi en upps¨attning parametrar som kan manipuleras. D¨ar¨over har designern tillg˚ang till ett antal verktyg inklusive m¨ojligheten att l˚asa befintlig geometri, konvertera geometri till andra typer, l¨agga till geometri manuellt, och ¨aven m¨ojligheten att anv¨anda agenter p˚a specifika omr˚aden p˚a kartan. Vi tittar p˚a spell¨aget Battle i det digitala spelet Mario Kart 64 och visar hur v˚ar metod kan anv¨andas f¨or att skapa s˚adana kartor. Vi utf¨orde en anv¨andarstudie p˚a outputen fr˚an metoden och resultatet visar att kvaliteten ¨ar i allm¨anhet gynnsam.
Contents
1 Introduction 1
1.1 Taxonomy . . . 1
1.2 Related Research . . . 2
1.3 Purpose, Research Questions & Target Medium . . . 4
2 Method 5 2.1 How the Method was used during the Project . . . 6
2.2 Method Discussion . . . 7
3 Solution 8 3.1 The Software Agents . . . 10
3.2 Interface . . . 17
4 Demonstration & Evaluation 19 4.1 Preparatory Tests . . . 19 4.2 User Study . . . 19 5 Results 23 5.1 Preparatory Tests . . . 23 5.2 User Study . . . 25 6 Analysis 27 6.1 Analysis of Results . . . 27 6.2 Binominal Test . . . 28 6.3 Analysis of Users . . . 28 6.4 Analysis of Solution . . . 28 7 Discussion 30 7.1 Tester Preference Bias . . . 30
7.2 User Study Sets . . . 31
7.3 Solution Reasoning . . . 32
7.4 The User Study . . . 32
7.5 Ethical Considerations . . . 32
8 Conclusion & Suggestions for Further Research 33
Appendix 37
1
Introduction
The game industry is a massive industry. According to Fullerton [8, 9] the global game industry brought in $43 billion in 2007 and in 2013 the industry grew to $66 billion. The industry is expected to grow to $78 billion in 2017 [9]. Furthermore, Fullerton [8] states that 90% of American households have rented or owned video games. In [9] Fullerton then states that the percentage of American teenagers between 12-17 that play video games is 97%. As a local example, according to Dataspelsbranschen [3] the digital sales of games in Sweden increased by 34% between 2014 and 2015 to a total of 3.3 billion SEK.
However, the costs involved are increasing as well. The reason behind this is that in order to keep up with customer expectations you need to utilize newer hardware systems with higher capabilities [9]. Furthermore, producing content that feels fresh today may require as many as hundreds of people (artists, designers, programmers, audio engineers, etc.) [11]. As an example, the high end game Grand Theft Auto V [26] cost a grand total of $265 million to produce [9]. On a smaller scale, the indie game Journey [32] cost $5 million to produce [9]. An important point to keep in mind here is that in order for the consumer base to be able to afford the end product, the selling price must be kept low [11]. It’s easy to see how this is an issue today.
One of the potential solutions to this problem that is being researched today is Procedu-ral Content Generation (PCG). PCG leverages the increasing capabilities of the hardware available to us to do manual labor. Falling under the umbrella term Artificial Intelligence (AI), the designer sets up boundaries for a possibility space that an algorithm then works through and produces game content [33]. This can be anything from doing repetitive work by following simple rules, to creating novel content that can either stand on its own or spark inspiration for the designer. PCG can reduce production time and cost, increase content yield, and promote replayability in a game.
Examples of games that utilize PCG are Minecraft [19] by Mojang, Borderlands 2 [10] by Gearbox Software and The Witcher 3 [2] by CD Project Red. Minecraft [19] is a sandbox game where the world is made up out of voxels, which can be repositioned. The PCG part of the game creates the game world as the player traverses it. Borderlands 2 [10] is an action roleplaying, first-person shooter game. The developers utilized PCG to create, in their own words, 87 bazillion [27] guns for the player to find and use. The Witcher 3 [2] is an action roleplaying game. The game contains 35 hours of animated cut-scenes [7]. By itself that would be an extensive amount of work. To counteract this the developers made an algorithm that procedurally generated rough versions of the scenes [7]. The artists could then fix the scenes manually, or regenerate the scene for inspiration [7].
1.1 Taxonomy
◦ Mixed Initiative: For the definition of what mixed initiative is we borrow from Smith et al.’s [31] definition: A mixed initiative approach is an iterative process be-tween the human designer and the algorithm. Examples of benefits of this approach are that the PCG portion can be used to show the designer alternative choices, to regenerate parts of a level and to enforce the playability of the level [31]. It is im-portant to note that mixed initiative comes in two flavors: Computer-Aided Design (CAD) and Interactive Evolution [15]. CAD is when the designer has an idea and
the algorithm carries out that idea [15]. Interactive Evolution is when the algorithm produces something and the designer judges the quality of the output [15]. In this thesis we will focus on the CAD variety.
◦ Offline: We use this word to signify when the algorithm runs during the production phase of the game, i.e., before the game is shipped [35]. In other words, offline in the context of PCG, is when you want to produce and verify the content before the player sees it.
◦ Online: Contrary to Offline, we use this word to signify when the algorithm runs after the production phase of the game, i.e., after the product has been shipped [35]. In other words, online in the context of PCG, is when you want the player to be able to experience new content on a predefined basis.
◦ Software Agents: For the definition of what a software agent is we base our defini-tion on Russell et al.’s [28]: A software agent perceives its surrounding environment and decides an action to take based on the information it gathered.
1.2 Related Research
Landscape Generation An example where PCG is useful is the automatic generation of landscapes. Producing this content by hand yields a static landscape that requires manual editing. Obviously, this is costly and directly limits possibilities of play. There are several techniques out there that handle this kind of content.
Johnson et al. [13] use Cellular Automata (CA) to produce an infinite cave sys-tem. They produce five portions of the map at a time; the currently visible part of the map as well as the immediate areas in each cardinal direction. The base tech-nique they use is traditional CA with rules changing cells to either walls or empty spaces depending on the neighboring cells. An interesting feature is that to ensure connectivity between all parts of the map, tunnels are dug between them as neces-sary [13]. The map is stored using a random seed to recreate the same parts of the map as the player traverses it [13].
A common technique is to use fractals to produce natural terrain. Since frac-tals are based on self-likeness, they are suitable for certain types of natural terrain. Examples of this include: Meng et al. [17] use midpoint displacement to generate terrain for games and simulations, Miller [18] uses square-square subdivision to gen-erate terrain as well and Prusinkiewicz and Hammel [24] use fractals to produce mountains with rivers. Meng et al. [17] notes that buying scans of real terrain is costly and fractals are able to produce good-enough results fast.
Search-based PCG (SBPCG) uses a quantity of variations and a fitness evaluation to determine what variations are superior to others. The quantity is sorted and mixed over a number of generations. This is a common technique with examples including the following: Togelius et al. [34] generate complete StarCraft [1] maps, Valtchanov and Brown [37] evolve generic dungeon maps, Raffe et al. [25] evolve patches of terrain that they then fit together, Ong et al. [22] produce 3D terrain data sets, Ølsted et al. [39] evolve game maps for a first person shooter in an online context and Walsh and Gade [38] generate terrain according to user preference. Ong
et al. [22] also establish in their paper a set of characteristics that they use to define what a good general algorithm for terrain generation is. The terms are as follows: Adaptive, Innovative, Scalable and Intuitive.
Lechner et al. [14] use software agents to procedurally generate typical patterns of urban land use. The artist can draw features onto the map manually as well, as an example of mixed initiative. Lechner et al. call their agents developers. They have property developers and road developers. Property developers construct parks as well as residential, commercial, and industrial buildings. Road developers extend roads to undeveloped land, connect roads and ensure that residents can move through the city quickly. The developers conform to modern patterns of land use, though the process yields unique cities every time1.
Doran and Parberry [6] use software agents with various tasks to produce land-scapes. They have coastline agents, smoothing agents, beach agents, mountain agents as well as river agents. A key feature in their work is that the agents operate under constraints [6]. One of these constraints is that the agents are set loose in three distinct phases: coastline, landform and erosion. Another constraint is the use of parameters to control the agents [6]. Doran and Parberry are able to produce flat areas, areas with gently rolling hills, and mountainous regions with passes and valleys using their approach [6]. They also define a set of characteristics for proce-durally generated content: Novelty, Structure, Interest, Speed and Controllability [6].
Mixed Initiative A useful mindset to bring along when producing a designer tool is the use of Mixed initiative. If there is a desire to exert control over the PCG or it is uncertain what the ideal content looks like, it can be useful to allow some degree of intervention from a human.
Tanagra is a mixed initiative CAD tool made by Smith et al. [31]. In it, the designer can pick a rhythm and lock their favorite pieces of geometry to prevent the engine from overriding them [31]. Using the pace set by the rythm, the engine then generates remaining pieces [31]. This can be done in turns until the designer is satisfied with the result.
Sketchaworld is a mixed initiative CAD tool made by Smelik et al. [29]. In it, the designer paints on various 2D layers (earth, water, vegetation, road, city) and the tool then converts it to a complete 3D model [29]. The designer can affect these layers in any order to change the 3D model [29].
Sentient Sketchbook is a mixed initiative CAD tool made by Liapis et al. [16]. In it, the the designer paints tiles (passable, impassible, player base, resource) onto a 2D grid [16]. The tool examines if the map is playable and also provides different solutions to the designer [16].
1This information is based on a poster. The details were obtained from the unpublished article found at https://ccl.northwestern.edu/papers/2006/TR-2007-33.pdf [accessed 2016-05-10]
1.3 Purpose, Research Questions & Target Medium
Purpose The purpose of this thesis is to present a method to rapidly create viable game maps using low effort from the designer. For this purpose software agents and mixed initiative are used. The method generates complete maps using predetermined symbols that can be adapted to various types of games. The symbols are then used to generate coherent geometry. This thesis will present a proof of concept implementation that produces maps like those found in a target medium: Mario Kart 64 [20].
Questions This thesis will answer the following:
◦ How well can the presented PCG method produce Mario Kart 64 Battle-mode like maps?
◦ What degree of satisfaction can it reach?
Where we define a satisfactory degree to be a degree which is at least >20% but ideally ≥ 50% preference rate in a user study, in favor for the output of this method. This is based on the fact that the target medium contains four maps and as such we will produce four additional maps to compare them to. The aspiration is to par at least one original map while the other maps are not completely regarded as sub-par.
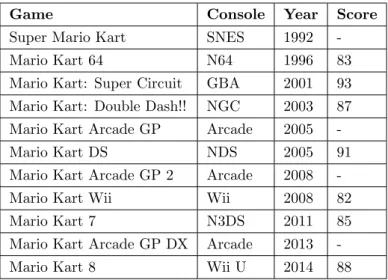
Target Medium As a point of reference, in this thesis we will look at a specific game mode in the game Mario Kart 64 [20] (MK64). The first game in the Mario Kart series was originally released on the Super Nintendo Entertainment System in 1992, and a new iteration has been released on nearly every Nintendo console from then on, including handheld devices. The games are well-known and liked, and consistently get a score of above 80 (see table 1). The game is a multiplayer go-kart racing game, but we will focus on the game mode Battle. In this mode, two to four players compete in an Arena-like environment to eliminate the other contenders using weapons and/or brute force.
In the latest iteration, Mario Kart 8 [21] (MK8), does not include the classic Arena-like environment for Battle-mode but rather rehashes the racing circuits for this purpose. This may be an example of content that has been cut for the sake of meeting deadlines and/or financial limits. To reduce the problem to a manageable timeframe, we will look at MK64’s [20] Battle-mode. This was the first game in the series to include actual 3D geometry.
Table 1: All the released iterations of Mario Kart. The release dates are the original release dates and do not account for international delays. The available scores are retrieved from the website Metacritic2, and range from 0 to 100.
Game Console Year Score
Super Mario Kart SNES 1992
-Mario Kart 64 N64 1996 83
Mario Kart: Super Circuit GBA 2001 93 Mario Kart: Double Dash!! NGC 2003 87 Mario Kart Arcade GP Arcade 2005
-Mario Kart DS NDS 2005 91
Mario Kart Arcade GP 2 Arcade 2008
-Mario Kart Wii Wii 2008 82
Mario Kart 7 N3DS 2011 85
Mario Kart Arcade GP DX Arcade 2013
-Mario Kart 8 Wii U 2014 88
2
Method
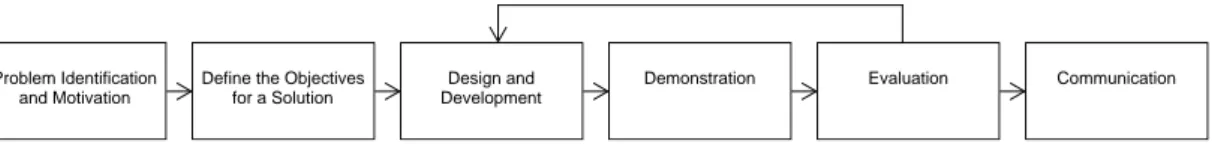
In order to prove the validity of a method it’s useful to have something tangible to evaluate. To ensure that an artifact is of good quality, it’s beneficial to adhere to a set of guiding principles. We will look at a prototype implementation of the solution, which was produced while adhering to the principles of design science. The following definition of the process is based mainly on Peffers et al.’s [23] work with some additional details from Hevner et al. [12]. See figure 1 for an overview of the steps. The details are as follows:
1. Problem Identification and Motivation: In the first step the specific research problem should be defined and it should justify the value of the solution [23]. Because the definition will be used as a base to develop the artifact, it may be useful to atomize the problem conceptually at this point so that the solution can capture its complexity [23].
2. Define the Objectives for a Solution: During this step Peffers et al. [23] states that the objectives of a solution should be inferred from the problem definition and knowledge of what is possible and feasible. The objectives can be quantitative, e.g. in terms of which a desirable solution would be better than the current ones [23]. The required resources at this stage include knowledge of the state of problems and current solutions [23].
3. Design and Development: During this step the artifact is created [23]. Hevner et al. [12] defined different categories of artifacts. These are as follows: Constructs
2The scores are retrieved from the aggregate website Metacritic.com. http://www.metacritic.com/ search/all/mario-kart/results [accessed 2016-05-10].
(vocabulary and symbols), Models (abstractions and representation), Methods (algo-rithms and practices), or Instantiations (implemented and prototype systems) [12].
4. Demonstration: In this step, demonstration of the use of the artifact to solve one or more instances of the problem should be conducted [23]. This could be done using experimentation, simulation, case studies, proofs, or other appropriate activities [23].
5. Evaluation: At this point, observations and measuring of how well the artifact sup-ports a solution to the problem should be performed [23]. This involves comparing the objectives of a solution to actual observed results from the use of the artifact in the demonstration [23]. Any empirical evidence or logical proof can be used at this stage [23]. It may be useful to either iterate back to point 3 after this stage to try to improve the effectiveness of the artifact or to continue on to communication and leave further improvement to subsequent projects [23].
6. Communication: Simply put, the relevant information should be relayed to the appropriate audiences at this stage [23].
Communication Evaluation
Demonstration Design and
Development Define the Objectives
for a Solution Problem Identification
and Motivation
Figure 1: Overview of the design science steps
2.1 How the Method was used during the Project
1. Problem Identification and Motivation: Due to the expensive nature of game development, it seems that some content that should be included instead gets left out. As an example, we found that in MK8 [21] there was a distinct lack of dedicated Battle-mode maps. Therefore we set out to streamline the process of creating such maps. Due to the complexity of the geometry found in MK8 [21], we decided to instead look at an earlier edition of the game, MK64 [20]. This was the first game in the series to have proper 3D models for the maps.
2. Define the Objectives for a Solution: We did a systematic literature review (see appendix A) where we immersed ourselves in the subject of PCG and AI. We found our literature in relevant online databases and books. We used the follow-ing keywords: Procedural, content, generation, software agent, game, terrain, map and controllable. We used these keywords in different combinations with database-specific syntaxes (+, *, parenthesis, quotation marks and the like). We read about the various types and their advantages and disadvantages. We found a lot of papers using SBPCG to solve similar problems to the one specified above. However, using the knowledge we had acquired from the systematic literature review we surmised that it would be efficient enough to use agents and mixed initiative as a method for the problem we had found.
3. Design and Development: We created an algorithm to solve the problem based on the method we had chosen. If we had stopped there our project would have produced a method artifact [12], but since games are an artistic medium we decided to build a simulation environment to visualize the output. As such, the artifact turned into an instantiation [12]. See section 3 for a walk-through of how the artifact works.
4. Demonstration: In order to verify the validity of our solution, we decided to do a numerical representation of the output, a Heuristics Evaluation for Playability (HEP) [4] study, as well as a user study of the output. This is because we thought it would yield the most direct and useful metrics for us.
We did the numerical representation as we wanted to be able to compare the different maps more accurately. The key components of each map were counted and compiled into data sets. See section 4.1 for how the metrics were gathered.
Heuristics are useful guidelines when designing an artifact. Desurvire et al. [4] wrote a paper on using heuristics specifically for games. In their paper they presented four major categories, each containing a number of heuristics to use when evaluating a game. These categories were: Game Play, Game Story, Game Mechanics and Game Usability. Because the game in and of itself is not the subject for study in this thesis, these categories were not directly applicable. As such, they were instead used as inspiration and a set of geometry-centric heuristics for MK64 [20] was established. See section 4.1 for the heuristics.
Finally, when conducting the user study, A/B tests were used. A/B tests compare two different versions of something to determine which of the two is superior by some metric [5]. It often involves an hypothesis [5]. In order to extract sensible information out of the test, a clearly measurable outcome must be determined before the testing begins [5]. The hypothesis was that the generated maps are generally equivalent or better when compared to the original maps. In the A/B test the generated maps were juxtapositioned against the original maps, which were recreated in the simulation environment. The order of the maps were randomized. Each set of maps were given two minutes per map in succession. 32 people participated in the test, with two people testing at a time. After each set the users were asked to answer one question; which one of the two maps they preferred. See section 4.2 for details.
5. Evaluation: At this stage the metrics gathered from the previous stage were con-solidated (see section 5). The results were analyzed and a binominal test were conducted on them. The users that partook in the study were analyzed in regard to their experience with MK64 [20] Battle-mode. The implementation was compared to previous research as well. See section 6 for the analysis.
6. Communication: In the final stage, the solution was documented and this paper was written to share the acquired knowledge.
2.2 Method Discussion
The project could have stopped at the algorithmic level and big O notation could have been used to calculate how fast the algorithm executes. However, this would not have said anything about playability or enjoyability, two vital attributes in a game.
Expressive range [30] analysis could have been performed. What this means, is that the variation a generator is capable of producing is visualized in a diagram. In order to do this, a measurement system with a number of metrics must be devised. Then, the generator must run for a number of generations and evaluate each generation using the predetermined metrics [30]. This would, however, only show the amount of variation that the algorithm produce. For the same reason as above, it was decided not to do this at this stage.
Instead of the simulation environment, the testers in the A/B test could have been asked to only look at the geometry and imagine how fun it would be to play the maps. However, this might have affected the outcome negatively as it is difficult to account for the emergent layer that is the root of the fun-factor in the game [9]. That is, the situations that occur when people are competing inside the game.
The tool could have been evaluated rather than the algorithm. Using something along the lines of a survey or interview. However, as we felt the algorithm was good enough as it was and we wanted to prove that it could work online, we decided to focus on the algorithm.
As we wanted to get a gist of the playability and enjoyability of the output, we felt we needed a tangible product to verify. As such, we used the principles of design science to guide us in our efforts to do so.
3
Solution
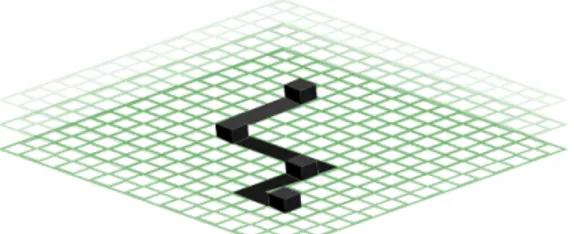
In our algorithm we call a game map a world. A world is a collection of 1. . . n planes positioned directly above each other (see figure 2). Each plane is divided into size2 spaces where size is an integer between 20 and 40. Various geometry types make up the compo-sition of each plane. Table 2 lists the geometry types found when inspecting MK64 [20] (see figure 3 for a graphic overview).
Figure 2: A Layered World – Each World consists of n planes of equal dimensions.
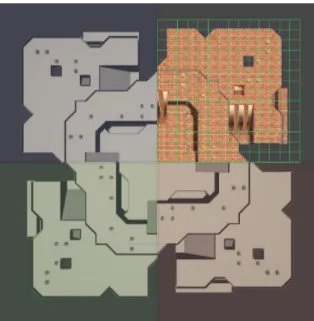
When producing multiplayer maps there is always the question of balance. We observe that in MK64 [20], this is achieved by giving each player equal starting conditions. Since there are a maximum of four players, each map is mirrored in both horizontal axes. In our algorithm we achieve equal starting conditions by working a single quarter of the world, and then mirroring the geometry to the remaining three quarters (see figure 4).
Table 2: Overview of Geometry Types. The listed types were found when looking at the original maps in MK64 [20]. Each type takes up a number of spaces in the grid.
Name Description Spaces
Floor A square. 1
Corner Floor A triangle 1
Block A cuboid that reaches halfway to the plane above it. 1 Pillar A cuboid that reaches the plane above it. 1 Ramp A right triangular prism that reaches the plane above
it.
3
Fence A rectangle that hinders the player from driving off a surface (0. . . 4 per space).
0
Item Box A cuboid that yields an item to the player when they collide with it.
1
Figure 4: A mirrored world. Working on one quarter (the one with a grid) of the world and propagating the changes to the remaining quarters ensures equal starting conditions. The blue, green and red sections are the mirrored sections.
While we do not put an emphasis on the execution speed, it may be interesting to note how fast the implementation runs on current hardware. The algorithm produces viable maps of the size 28 x 28 on the order of 0.3 seconds on a Intel Core i7 4900MQ 2.8GHz.
3.1 The Software Agents
We use two types of agents: stochastic and deterministic ones. Stochastic agents use tokens as a limit to their otherwise vast possibility space. This enables them to produce variety in a sensible amount of time. Deterministic agents do not use tokens, simply because the steps they need to go through are finite. They are used to achieve playability every time. See figure 5 for an overview of the various agents.
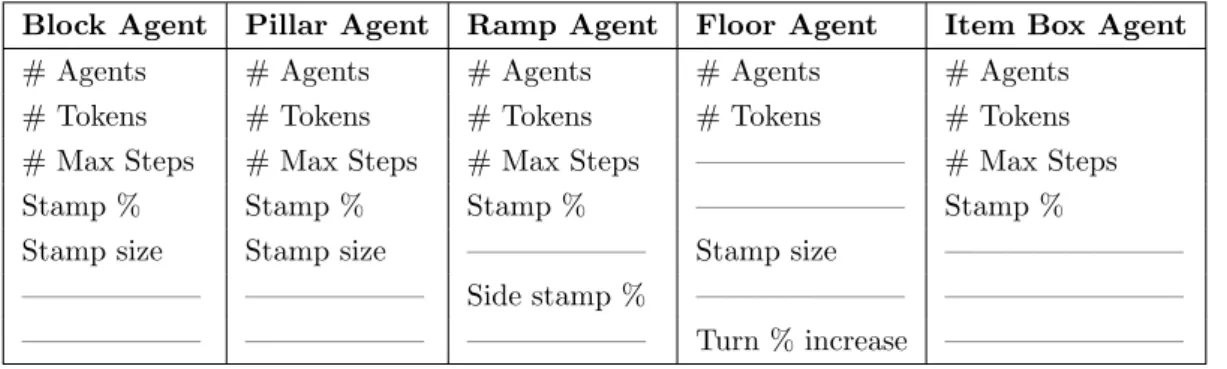
In order to bring control to the stochastic behavior, we have a number of input pa-rameters that we relay to the agents at runtime. The papa-rameters range from the number of agents to instantiate, how many tokens they should each start out with, how far they can go and so forth. See table 3 for the complete specification.
Deterministic
Stochastic
Fence Agent Smoothing Agent
Connector Agent
Start Position Agent Item Box Agent
Floor Agent Ramp Agent
Pillar Agent Block Agent
Agent
Figure 5: Agents Overview Diagram – All agents inherit from the same base type and are separated into two different categories: Deterministic and Stochastic.
Table 3: Dimensions of Control – the parameters that can be modified to assert control over the agents.
Block Agent Pillar Agent Ramp Agent Floor Agent Item Box Agent
# Agents # Agents # Agents # Agents # Agents
# Tokens # Tokens # Tokens # Tokens # Tokens
# Max Steps # Max Steps # Max Steps ——————— # Max Steps
Stamp % Stamp % Stamp % ——————— Stamp %
Stamp size Stamp size —————— Stamp size ————————
—————— —————— Side stamp % ——————— ————————
Figure 6: Movement Types – The two different movement patterns used when an agent exits the working quarter. The blue arrow represents normal mirroring, whereas the red arrow represents mirrored-axis movement.
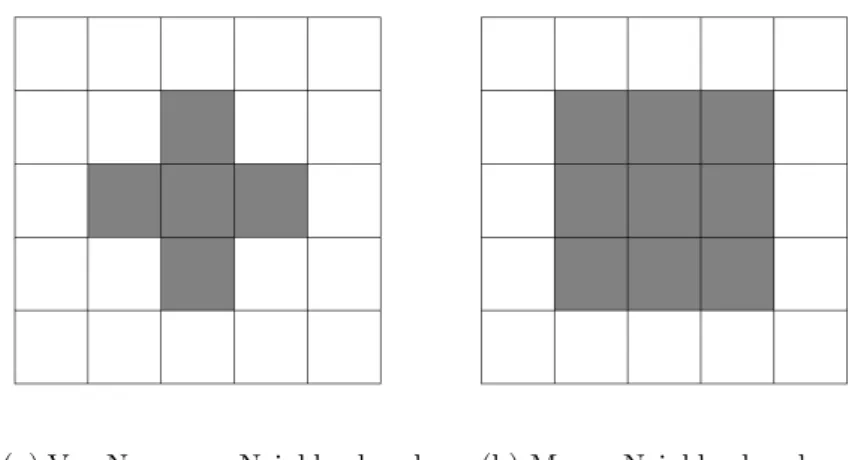
(a) Von Neumann Neighborhood (b) Moore Neighborhood
Figure 7: The two types of neighborhoods used in the algorithm.
Pseudo-code Overview The agent code was written in a polymorphic mindset where the untitled agent is the base code and each titled agent is a single-step derived class thereof. This allows for shared code across all agents but is by no means a necessity. A common attribute of all stochastic agents is that their procedures end if they run out of tokens. All variables in the pseudo-code are denoted by italics. There are two movement types utilized by the agents when traversing the world. The first type (denoted by the blue arrow in figure 6) simply wraps the agent to the opposite edge when it leaves the working area. The second type (denoted by red in figure 6) flips horizontal axis. E.g. x becomes y. The psuedo-code uses the following abbreviation: Random Number Generator (RNG). We also use two types of neighborhoods when addressing neighboring cells in the grid, see figure 7.
Movement for the Block, Pillar and Ramp Agents This type of movement sees the agent placed stochastically in the working quarter of the world. Using the tokens
they are dealt, the agent then traverses that portion of the world. If they leave the world or the working quarter, they are moved to the opposite side of the working quarter using movement type #1.
Algorithm 1 Movement for Block, Pillar, and Ramp Agents
1: procedure Move
2: direction ← random cardinal direction
3: steps ← Rng between 1. . . Max Steps 4: tokens ← tokens - steps
5: for i ← 0 to steps do
6: position ← position + direction
7: if W orld[position] = Ramp then
8: position ← traverse Ramp
9: if position is outside World then
10: position ← mirror position
The Block Agent See algorithm 1 for movement. After movement, this agent will try to stamp in a Moore neighborhood, with a size defined in the parameter list (see Stamp size in table 3). It will not override Ramps or Pillars.
Algorithm 2 Block Agent
1: procedure Run 2: goto Move
3: if Stamp Chance > Rng between 0. . . 100 then 4: goto Stamp
5:
6: procedure Stamp
7: for each position in Stamp size Moore Neighborhood do
8: if World [position] 6= Ramp or Pillar then
9: W orld[position] ← Block
10: tokens ← tokens - 1
The Pillar Agent See algorithm 1 for movement. After movement, this agent will try to stamp in a Moore neighborhood, with a size defined in the parameter list (see Stamp size in table 3). It will not override Ramps.
Algorithm 3 Pillar Agent
1: procedure Run 2: goto Move
3: if Stamp Chance > Rng between 0. . . 100 then 4: goto Stamp
5:
6: procedure Stamp
7: for each position in Stamp size Moore Neighborhood do
8: if World [position] 6= Ramp then
9: W orld[position] ←Pillar
The Ramp Agent See algorithm 1 for movement. After movement, this agent will try to stamp in its current direction if there are no conflicting ramps there. If a new ramp is stamped, the ramp agent will flag for either a new Floor Agent or a new Pillar Agent to start at the end of the ramp. This is to assure there is traversable space at the top of the ramp. For added width, the Ramp Agent also has the ability to stamp 0. . . 2 additional ramps to the side of the newly created ramp.
Algorithm 4 Ramp Agent
1: procedure Run 2: goto Move
3: direction ← random cardinal direction
4: if Stamp Chance > Rng between 0. . . 100 then 5: goto Stamp(position)
6: if Stamp Succeeded then
7: Create new Floor or Pillar Agent at position + direction * 3
8: if Side Stamp Chance > Rng between 0. . . 100 then 9: goto Stamp(position + Left)
10: if Side Stamp Chance > Rng between 0. . . 100 then 11: goto Stamp(position + Right)
12:
13: procedure Stamp(position)
14: if World [position] 6= Ramp then
15: W orld[position] ←Ramp
16: tokens ← tokens - 3
The Floor Agent This agent begins by stamping immediately where it starts. Then it loops between moving and stamping for each step. It has its own movement pattern, where it decides if it should turn or not, then it continues down its path. If the agent leaves the world, it will return using movement type #1. If it on the other hand enters a mirrored quarter, it will return using movement type #2. After movement, this agent will try to stamp on its location and to its sides, as defined by the Stamp size parameter (see table 3). This is only not possible if there is a Ramp in the way.
Algorithm 5 Floor Agent
1: procedure Run 2: goto Stamp 3: while tokens > 0 do 4: goto Move 5: goto Stamp 6: 7: procedure Stamp
8: for tempPosition ← position - Stamp size / 2 to position + Stamp size / 2 do
9: if World [tempPosition] 6= Ramp then
10: World[tempPosition] ←Floor
12: procedure Move
13: if Turn Probability > Rng between 0. . . 100 then 14: direction ← turn 90 degrees Left or Right
15: Turn Probability ← 0
16: for i ← 0 to width / 2 + 1: do
17: goto Stamp
18: position ← position + direction
19: tokens ← tokens - 1
20: if position is inside mirror quarter then
21: position ← mirror position 22: if World[position] = Ramp then
23: position ← traverse Ramp
24: return
25: else
26: position ← position + direction
27: tokens ← tokens - 1
28: Turn Probability ← Turn Probability + Turn Probability Increase
29: if position is inside mirror quarter then
30: position ← mirror position
31: if World[position] = Ramp then
32: position ← traverse Ramp
The Connector Agent This agent scans the world plane by plane and finds floors and spaces directly above pillars and defines the grouped ones as individual islands. We use a na¨ıve implementation of the breadth first search algorithm to accomplish this. It then stamps floors between the islands on each plane to ensure connectivity. For this, we use a na¨ıve implementation of the search algorithm A*.
Algorithm 6 Connector Agent
1: procedure Run
2: for each plane in World do
3: islands ← Find all isolated { Floor, spaces above Pillar }
4: Connect all islands on plane
The Smoothing Agent This agent scans the world and finds empty spaces next to floors and fills them according to two pre-defined rules. These are:
◦ If there are two floors and at most one other type of geometry then a corner floor should be stamped
◦ If there are three floors and at most one other type of geometry then a floor should be stamped
Algorithm 7 Smoothing Agent
1: procedure Run
2: for each empty space in World do
3: counter ← Count all occupied spaces in size 1 Von Neumann Neighborhood
4: otherCount ← Count all { Ramp, Block, Pillar } in
5: size 1 Von Neumann Neighborhood
6: if counter = 2 & otherCount ≤ 1 then
7: World [position] ← Floor Corner
8: else if counter = 3 & otherCount ≤ 1 then
9: World [position] ← Floor
The Item Box Agent This agent has its own movement pattern, where it tries to go a set number of steps in a given direction. If it is not possible to move in that direction, it will stop and try a new random direction until it has moved all steps. The agent moves only on floors and spaces above pillars. If it moves into a mirror quarter, it will return using movement pattern #2.
After movement it will stamp in a size 1 Moore Neighborhood. For each space in the neighborhood it has a chance as defined in the parameter list (see table 3) to place an item box.
Algorithm 8 Item Box Agent
1: procedure Run 2: while tokens > 0 do 3: goto Move 4: goto Stamp 5: 6: procedure Move
7: steps ← Rng between 1. . . Max Steps 8: tokens ← tokens − steps
9: while steps > 0 do
10: direction ← random cardinal direction
11: for i ← steps to 0 do
12: if position inside mirror quarter then
13: position ← attempt mirror position
14: if mirror position Succeeded then
15: steps ← steps - 1
16: else if World [position + direction] = Floor then
17: position ← position + direction
18: steps ← steps - 1
19: else
20: break
21:
22: procedure Stamp
23: for each position in size 1 Moore Neighborhood do
24: if World [position] = {Floor or space above Pillar} and
25: Stamp Chance > Rng between 0. . . 100 then 26: Add Item Box at position
Starting Position Agent This agent scans the world for Floors with other Floors or Floor Corners immediately surrounding to it. If there is no other type of geometry next to the position, it will be added to a list of potential starting positions. After all spaces have been scanned, one of the candidates will be picked at random.
Algorithm 9 Starting Position Agent
1: procedure Run
2: for each Floor in World do
3: OK ← true
4: for each position in Floor Agent Stamp size / 2 Moore Neighborhood do
5: if World [position] 6= { Floor, Floor Corner } then
6: OK ← false
7: break
8: if OK then
9: Add position to List
10: Pick random position in List
The Fence Agent This agent scans the world for occupied spaces. If the space is a Floor Corner, it will immediately stamp it with a Fence. For other geometry types it will look in all cardinal directions around it and place fences where the adjacent space is non-occupied.
Once all Fences are placed in the world, the agent traverses plane by plane and connect all groups of adjacent Fences.
Algorithm 10 Fence Agent
1: procedure Run
2: for each occupied position in World do
3: if World [position] = Floor Corner then
4: Create Fence using Floor Corner direction
5: else
6: for each cardinal direction do
7: if World [position + direction] 6= occupied space then
8: Create Fence in direction
9:
10: Connect all adjacent Fences
3.2 Interface
We use the game engine Unity 5 [36] in this project. This allows us to work both algo-rithmically and manually with the game world without having to write our own engine.
In order to control our algorithm we have an interface (see figure 8). The interface contains buttons to control the algorithm and sliders to control the agent parameters, as well as other options (see figure 9).
It is also possible to do manual changes to the game world inside the editor view panel and then propagate the changes to the mirror quarters by pressing the Save changes button. Any geometry outside the working area will be deleted. See figure 10 for an overview of the editor view panel.
Additional features include the ability to lock geometry to prevent the agents from overriding them as well as context menus to transform geometry to other types (see fig-ure 11). Furthermore, the designer can tilt the fences, set the graphical theme and change the scale of the map using the interface.
Figure 8: Interface panel in Unity [36]. The middle buttons expand alternatives for the various settings.
Figure 9: Example of parametric con-trol in the interface. The sliders can be moved to alter the agent parameters.
Figure 10: Editor View – This is how the world appears when designing a map. The colored section is the working quarter. The grayed-out area contains the three mirrored quarters.
Figure 11: Auxiliary functions inside the editor view. The designer can mark pieces of geometry and lock them in place, preventing the agents from over-riding them. They can also mark pieces and convert them to another type.
4
Demonstration & Evaluation
4.1 Preparatory TestsTo encode the maps and make them more comparable, a list of key components common across each original map in MK64 [20] was established (see table 4). We use the list to count the occurrences of each component in the maps. See section 5.1 for results of this numerical representation.
Table 4: The different key components found in all MK64 [20] Battle-mode maps.
Entity Description
Blocks A cuboid that reaches halfway to the plane above it. Pillars A cuboid that reaches the plane above it.
Ramps A right triangular prism that reaches the plane above it. Floors A square that can be driven across.
Fences Up A rectangle that stands on right angle to the plane going up. Fences Tilted A rectangle that stands on an angle away from the plane. Item Boxes A cuboid that yields an item to the player.
Non-occupied Spaces Spaces that contain no geometry.
Traversable Spaces Spaces that can be driven across normally.
Traversable Blocks Blocks that can be driven across, but requires a higher vantage point to reach.
Planes The number of planes in the map.
Nine heuristics that arguably have a large impact on the enjoyability of a MK64 [20] Battle-mode map, in regard to the geometry of the map, were established (see table 5). We put each recreated map and the four generated maps through this test. See section 5.1 for results.
4.2 User Study
A/B tests were performed on a set of 32 people. Each map set was played in succession. After each set, the testers were asked to pick their preferred map on their individual forms. The testers were discouraged to talk about the geometry throughout the test to prevent shifts in opinions. To facilitate the testing of the output the core mechanics of MK64 [20] were rebuilt. The scoring/winning condition was excluded and so was the mini-map overview as well. This was to ensure that each map was given the same amount of playtime and that the testers had to focus on the map geometry itself. See figure 12 for an example of the simulation environment. The simulation was run using a Windows 10 machine and two Xbox controllers.
Table 5: Our geometry heuristics, based on HEP [4].
ID Heuristic
Geometry 1 Player disorientation is minimized by starting opposite of the op-ponent.
2 Player excitement can be increased by giving them opportunities to feint the opponent by switching planes.
3 Player excitement can be increased by allowing them to jump across empty spaces.
4 Player excitement can be increased by introducing the risk of falling off the world.
5 Player excitement can be increased by giving them opportunities to use obstacles to shield themselves from attacks.
6 Using tilted fences can increase jump distance and therefore player excitement.
7 Using Blocks to break the floor pattern while retaining traversabil-ity can increase player interest.
8 Player fatigue is minimized by spacing out the item boxes. 9 Player fatigue is minimized by placing item boxes within reachable
distance.
Figure 12: Simulation Environment – This is how the world appears during play. Player 1 is on the top half of the figure, player 2 is on the bottom half.
Formalia for Recreating Maps The original maps in MK64 [20] were rebuilt to the degree that was possible within the time constraint. Some distances between geom-etry may differ and some texturing may not be accurate, but the general shape is the same as in the original maps (see figure 13).
Formalia for Generating Maps See figure 14 for an overview of the generated maps. To produce these, a rule set was established before the generation began. The rules were as follows:
◦ The maps need to be generated one after the other (to avoid cherry picking). ◦ No locking of geometry allowed (to allow the algorithm free reign).
◦ No manual alterations of the geometry allowed (only the interface buttons al-lowed), to showcase the algorithm.
◦ Every map is made initially by pressing the New button, with the same set of agents.
◦ The Continue button is allowed to be used at most 5 times, to limit the human input.
◦ Agent parameters are fixed during generation, but the quantity of agents are allowed to be changed throughout to meet specific needs.
◦ The agents’ starting point is allowed to be set after initial New button click if desired.
◦ Fences are allowed to be tilted on a per-plane basis arbitrarily. ◦ Scale is allowed to be set arbitrarily.
◦ Graphical theme is allowed to be set arbitrarily.
◦ Graphical elements not directly attached to the map itself are optional.
Formalia for Setting up the User Study The order of the tests were randomized. The order can be viewed in figure 15. Two forms were used, one containing the test levels in the order of A→B and the other in the reverse order (but still called A→B, see figure 15). This was to mitigate the possibility that a user may choose their preferred map on a chronological basis. The forms were alternated between tests.
Formalia for Conducting the User Study At the start of each test, the participants answered a pre-test question on their individual forms. The question was: which best describes your experience with Mario Kart 64 Battle-mode? The possible an-swers were: 0-10 hours playtime, 10-100 hours playtime and 100+ hours playtime. Then they were given the chance to familiarize themselves with the simulation envi-ronment, to learn the controls and eliminate any game-mechanic related confusion.
Four sets of maps were played in order. Each map was given 2 minutes of playtime. After each test set the participants were asked to answer which of the two maps they preferred on their individual forms.
(a) Big Donut (b) Block Fort
(c) Double Deck (d) Skyscraper
Figure 13: Overview of all the recreated original maps
(a) Map 1 (b) Map 2
(c) Map 3 (d) Map 4
Figure 14: Overview of all the generated maps
Figure 15: Order of the maps in the A/B test – Two alternate forms were used during the tests. The first form contained the order on the left, the second one contained the order on the right.
5
Results
5.1 Preparatory Tests
The results from the numerical study can be found in figures 16 & 17. They show the compiled statistics from the original maps (see figure 13) and the generated maps (see figure 14) respectively.
The compiled results from the HEP study can be found in table 6.
0 72 0 524 80 0 24 188 524 0 1 144 0 48 1472 712 0 40 2864 1616 144 4 0 0 0 664 0 220 24 360 664 0 1 0 384 12 528 112 0 32 1020 948 0 3 0 500 1000 1500 2000 2500 3000 Original maps
Big Donut Double Deck Skyscraper Block Fort
12 12 0 696 204 0 28 64 696 0 1 20 48 4 952 16 312 36 488 1012 20 2 52 36 16 1416 32 328 52 764 1500 44 3 64 20 8 780 0 224 36 660 824 64 2 0 500 1000 1500 2000 2500 3000 Generated maps
Map1 Map2 Map3 Map4
Figure 17: The numerical representation for all the generated maps.
Table 6: Geometric heuristics test results. Based on HEP [4].
ID Heuristic Map1 Map2 Map3 Map4 Big
Don ut Blo c k F ort Double Dec k Skyscrap er
1 Player disorientation is minimized by starting
op-posite of the opponent. 3 7 3 3 7 3 3 3
2
Player excitement can be increased by giving them opportunities to feint the opponent by switching planes.
7 3 3 3 7 3 3 7
3 Player excitement can be increased by allowing
them to jump across empty spaces. 7 3 3 3 7 7 7 3
4 Player excitement can be increased by introducing
the risk of falling off the world. 7 3 3 3 3 7 7 3
5
Player excitement can be increased by giving them opportunities to use obstacles to shield themselves from attacks.
3 3 3 3 3 3 3 7
6 Using tilted fences can increase jump distance and
therefore player excitement. 7 3 3 3 7 7 7 3
7 Using Blocks to break the floor pattern while
re-taining traversability can increase player interest. 7 3 3 3 7 7 3 7
8 Player fatigue is minimized by spacing out the
item boxes. 3 7 3 7 7 3 3 3
9 Player fatigue is minimized by placing item boxes
5.2 User Study
The following diagrams are compiled statistics on the results from the user study. In figure 18 each person had one vote per set. In figure 19 the diagrams are compiled statistics from all sets, divided by the experience groups. In this figure, each tester had four votes (one for each set). In figure 20 the diagram is compiled statistics from all sets. In this figure, each tester had four votes (one for each set).
15 17
Group 1
Recreated Generated
(a) Double Deck VS Map2
6 26
Group 2
Recreated Generated
(b) Big Donut VS Map4
16 16
Group 3
Recreated Generated
(c) Double Deck VS Map2
19 13
Group 4
Recreated Generated
(d) Big Donut VS Map4
24 48
0-10 Hours Group
Recreated Generated
(a) 0-10 Hours Group Results
28 20
10-100 Hours Group
Recreated Generated
(b) 10-100 Hours Group Results
4 4
100+ Hours Group
Recreated Generated
(c) 100+ Hours Group Results
Figure 19: Total results from each group from the user study.
56 72
Total
Recreated Generated
6
Analysis
6.1 Analysis of Results
As 32 people participated in the user study, the metrics gathered from it are enough to show an indication. The result of the tests indicate that the output of the algorithm is of generally equivalent quality, with a slight favor, as compared to the original maps found in MK64 [20].
Set 1: Double Deck VS Map2 The results from the user study (see figure 18a), Dou-ble Deck received 15 votes and Map2 received 17 votes. Comparing the numerical representations (see figures 16, 17), we find that Double Deck is an expansive map containing a lot of emptiness. Map2 on the other hand is more compact, while containing about two thirds of the traversable space found in Double Deck. A key point here is that they contain almost the same amount of item boxes. According to the HEP [4] study (see table 6), Map2 contains two flaws: it’s not possible to see the opponent from start and the item boxes are not adequately spaced out. Double Deck on the other hand, has four flaws: it’s not possible to jump across any empty spaces, there is no risk of falling off the world, there are no tilted fences to jump on and the item boxes are too spaced out.
Set 2: Big Donut VS Map4 The results from the user study (see figure 18b), Big Donut received 6 votes and Map4 received 26 votes. Comparing the numerical representations (see figures 16, 17), we find that Big Donut is minimalistic map con-taining not a whole lot of variation. Map4 on the other hand is more varied with the geometry types and double layer. According to the HEP [4] study (see table 6), Map4 contains one flaw: the item boxes are not adequately spaced out. Big Donut on the other hand, has six flaws: it’s not possible to see the opponent from start, it’s not possible to feint the opponent by switching planes, it’s not possible to jump across any empty spaces, there are no tilted fences to jump on, there are no traversable blocks and the item boxes are not adequately spaced out.
Set 3: Skyscraper VS Map3 The results from the user study (see figure 18c), Sky-scraper received 16 votes and Map3 received 16 votes. Comparing the numerical representations (see figures 16, 17), we find that Skyscraper is a minimalistic map containing not a whole lot of variation. Map3 on the other hand is very varied with the geometry types and tree planes. Both of them contain a relationship between occupied and non-occupied spaces in the range of 50%. According to the HEP [4] study (see table 6), Map3 contains one flaw: the item boxes are too spaced out. Skyscraper on the other hand, has three flaws: it’s not possible to feint the oppo-nent by switching planes, there are no obstacles to block attacks and there are no traversable blocks.
Set 4: Map1 VS Block Fort The results from the user study (see figure 18d), Map1 received 13 votes and Block Fort received 19 votes. Comparing the numerical repre-sentations (see figures 17, 16), we find that Map1 is a minimalistic map containing some variation with nearly no non-occupied spaces. Block Fort on the other hand
is somewhat varied with the geometry types and three planes. There is a lot of non-occupied space in the map. Both maps contain almost the same amount of Item Boxes, but Block Fort has thrice as many planes. According to the HEP [4] study (see table 6), Block Fort contains five flaws: there are no empty spaces to jump across, there is no risk of falling off the world, there are no tilted fences to jump on, there are no traversable blocks and the item boxes are too spaced out. Map1 on the other hand, has six flaws: it’s not possible to feint the opponent by switching planes, there are no empty spaces to jump across, there is no risk of falling off the world, there are no tilted fences to jump on, there are no traversable blocks and Item Boxes are too spaced out.
6.2 Binominal Test
As we can see in table 7, there is a significant difference in preference at the 99.9% confidence level for the map pair Map4 & Big Donut. The differences in the other pairs are not large enough to be significant.
Table 7: A binominal evaluation of the test groups. 3 denotes 99.9% confidence level, 7
denotes confidence below 80%, - denotes unknown confidence levels.
Name Big Don ut Blo c k F ort Double Dec k Skyscrap er Map1 - 7 - -Map2 - - 7 -Map3 - - - 7 Map4 3 - - -6.3 Analysis of Users
People who have played MK64 [20] Battle-mode less tend to favor the generated levels more. People who have played MK64 [20] Battle-mode more tend to favor the original levels. The domain experts are split down the middle as to whether the originals or the generated levels are superior.
6.4 Analysis of Solution
Landscape Generation Like Johnson et al. [13] we use stochastic variation in our maps. To ensure playability, we use a deterministic agent to connect unconnected areas with floor geometry. Johnson et al. [13] use a function to dig holes in the walls between map areas to ensure traversability.
Similarly to Togelius et al. [34] we generate complete playable maps for a game. Togelius et al. [34] use SBPCG to generate complete playable maps to the game
StarCraft [1]. We use different types of agents to generate complete playable maps to MK64 [20]. The difference between the approaches is that we use deterministic agents to ensure playability while Togelius et al. [34] runs their algorithm a number of generations until they reach playability, which is based on a number of predetermined objectives.
Like Lechner et al. [14] we use agents based on patterns. They divide their agents into two groups: Property Developers and Road Developers, each with their distinctive roles. Similarly, we divide our agents into stochastic and deterministic agents.
Doran and Parberry [6] use agents to generate islands. Like them, we use different types of agents to generate different types of geometry. They only use stochastic agents, albeit they have some degree of determinism based on effectors [6]. Unlike them, we utilize deterministic agents in combination with stochastic agents to ensure playability. They use a heightmap while we use a separate grid for every plane. Our method produces a map at around 0.3 seconds on average, while their method takes on the order of 20 seconds to produce their islands. Like Doran and Parberry [6] we use parameters to control the various agents. The output they produce is static, in contrast to how in our solution we permit alterations of the output as well as iterative runs of the algorithm.
Mixed Initiative Similar to Tanagra [31], Sketchaworld [29] and Sentient Sketchbook [16] our artifact uses mixed initiative as a staple feature. Like them, our tool is a CAD tool that lets the designer express their idea and the algorithm then acts on that idea.
In Tanagra the designer can pick a rhythm and lock their favorite pieces of ge-ometry to prevent the algorithm from overriding them when generating new geom-etry [31]. In our artifact we also enable the designer to lock their favorite geomgeom-etry. However, instead of using a rhythm we let the designer run the algorithm with as many agents of different types as they see fit.
In Sketchaworld the designer paints on various 2D layers and the tool then con-verts them to a single coherent 3D model of a world [29]. The designer can affect these in any order they want in order to change the 3D model. Unlike Smelik et al. [29] our tool lets the designer work with 3D geometry directly and our artifact does have the functionality to run the agents on any given plane. This means that the designer can run the algorithm without having to worry about the agents over-riding something that they want to preserve on another plane, similarly to how the designer in [29] doesn’t have to worry about erasing features due to the layered fragmentation.
In Sentient Sketchbook the designer paints on tiles in a 2D grid [16]. The tool then examines if the map is playable and also provides alternative solutions to the designer. We also let the designer work in a grid environment in our artifact, using any number of planes. In our solution the designer can place geometry manually. Similar to Liapis et al. [16] our artifact also ensures playable maps.
Definitions Ong et al. [22] defined a set of characteristics that they used to define what a good general algorithm for terrain generation is. Using them, our algorithm is:
◦ Adaptive: Our agents perform well within their constraints and if there is a need for another type of geometry, it is simple to write a new type of agent. ◦ Innovative: Relying on stochasm, varied constructs are produced.
◦ Scalable: The parameters scale well and perform equally on all resolutions. ◦ Intuitive: Using logical naming conventions ensures that our algorithm is easy
to understand.
Doran and Parberry [6] also defined a set of characteristics for a PCG algorithm. Using them, our algorithm has:
◦ Novelty: Our stochastic agents create variation.
◦ Structure: Our agents, even the stochastic ones, follow rules and as such, structures are formed.
◦ Interest: Using stochasm and determinism, our algorithm produces new and viable content.
◦ Speed: Our algorithm produces a viable map of the size 28 x 28 on the order of 0.3 seconds.
◦ Controllability: We use parameters to assert control over the agents.
7
Discussion
The method we have used seems to be a viable solution to the problem we identified. The algorithm, with minimal human input, produced MK64 [20] Battle-mode like maps with a satisfactory degree of 56.25% according to the user study (see section 5.2). Since our artifact has more options available, we surmise the potential of the method is even greater yet. The tool does have some level of complexity to it, as with all CAD tools. For a more aesthetically pleasing result, it is more suitable to use our method offline, as stochasm often produces jagged edges that the designer can manually smooth out. However, since we believe that there is potential here, we chose to focus our evaluation on the algorithm. Perhaps with a few tweaks to the rules the agents abide by, it would be possible to have aesthetically pleasing output consistently as well. Care must be taken here not to limit the stochastic factor too much, as this will dampen the variation greatly. Depending on the need for aesthetics, we believe the method can stand on its own already, perhaps if the interface is simplified, in an online context as well.
7.1 Tester Preference Bias
People who have not played, or spent a minimal amount of time playing, MK64 [20] Battle-mode seem to tend to favor the generated maps more. This may be because they are more open to judge fairly, based on the fact that they do not have a lot of experience with the original maps.
Conversely, people who have played MK64 [20] Battle-mode an average amount of time seem to tend to favor the original maps over the generated maps. This may be, in part, due to previous experiences with the original maps, making them less open to judge fairly.
While a spontaneous look at the 100+ hours group category might reveal an equal interest in both the original and the generated maps, there were simply too few people in this category to draw any real conclusions.
7.2 User Study Sets
Set 1: Double Deck VS Map2 Double Deck contains some of the longest stretches of traversable ground found in the original maps. This is simultaneously its advantage and disadvantage. It’s possible to shake a pursuer, but it’s difficult to attain new items, leaving the player highly vulnerable for long periods of time.
Map2 obscures starting positions, which is potentially confusing for new players. The item boxes are very plentiful and as such, causes the confrontations to lean towards item roulette reliance. The map contains two planes and there are some blocks that can be reached due to this property. This coupled with the possibility to jump at certain locations make for a varied map.
In this test set, it was pretty close. This may be because they are fun for different reasons. We surmise that being a more compact map, having tilted fences and inherent risk of falling off the world gives Map2 a slight advantage.
Set 2: Big Donut VS Map4 The self-similarity of Big Donut coupled with the fact that it discourages the player from traveling towards the center of the map makes this potentially the most confusing map of the originals. The layout encourages people to find each other and duke it out on just one quarter of the map. The danger of falling into the pit at the center adds to its charm.
Map4 contains some less-than-obvious routes. Jumps and traversable blocks makes this map interesting. The item boxes are not ideally distributed, however, making confrontations reliant on the item roulette.
We surmise that since Big Donut has many flaws according to our HEP [4] study (see section 5.1) it didn’t stand much of a chance when competing against Map4, which only contained one such flaw.
Set 3: Skyscraper VS Map3 Skyscraper is a very compact map with the added benefit that the item boxes are well spaced out. Furthermore, there are tilted fences that line the holes separating the outer rim from the central part. This leads to dramatic confrontations and daring tactical jumps. It is however, difficult to shake a pursuer as the map is flat.
Map3 contains a lot of paths between its three planes, giving the player many opportunities to shake their opponent. The open area at the top with traversable blocks is contrasted with the more confined space at the bottom, making the map varied. To its disadvantage, the item boxes are very spaced out, potentially leaving the player vulnerable for long periods of time.
This set ended in a tie. We surmise that they are equally fun for different reasons. Skyscraper has the most balanced placement of item boxes and Map3 is more varied with its three planes.
Set 4: Map1 VS Block Fort Map1 has a lot of opportunities to avoid attacks, as there are many obstacles. However, the item boxes are placed in the outer rim of the map,
leaving the center of the map highly exposed for players without advantageous items. There is only one plane and no holes to jump over in this map.
Block Fort is likely the most iconic map from the original game. To its advantage it has three traversable planes, which gives the players many options. The amount of air present in the level makes it very easy to quickly grasp the layout.
Both maps have overlapping flaws in the HEP [4] study (see section 5.1). Fur-thermore, Map1 also has the flaw that it contains only one plane, leaving the player with limited options. Its more difficult to grasp the layout in Map1 than it is in Block Fort, due to there being less empty spaces, which may be why Block Fort received more votes.
7.3 Solution Reasoning
Dividing the agents into atomic responsibilities (e.g. the Floor Agent only creates floors) gave us good control of what type of output was created. The only exception to this schema is the ramp agent which spawns a different agent upon placing its geometry in the world. This was to ensure connectivity between traversable spaces and ramps. This is the result of our observation that there are no ramps disconnected from traversable space in MK64 [20] Battle-mode.
We chose to use a Moore neighborhood when placing most types of geometry in the map. This allowed us to emulate patterns found in MK64 [20] Battle-mode maps while retaining the stochastic nature of our agents.
Our observations of the MK64 [20] Battle-mode maps’ geometries that yielded the seven types of geometry we used in our solution allowed us to reconstruct the original maps to a large extent. This also allowed us to generate maps that look and feel generally equivalent in the style to the original maps.
7.4 The User Study
Ideally, the user test could have been performed using the the original game directly. As we did not have access to the source code, or the knowledge of how to modify the game from the outside, we chose to simulate the game instead. We implemented as many patterns from the original game as we possibly could to give a MK64 [20] Battle-mode like experience to the testers. It seems that this was helpful in allowing them to judge the maps more fairly. We chose to remove the winning condition from the game. This was because we had testers of unequal skill level during our tests. This way we were able to avoid the situation where the dominant player would ruin the experience for the dominated player. The reverse situation naturally also avoided, where the dominant player would be bored due to the lack of challenge. The mini-map feature was also excluded, which forced the players to look at the actual map more carefully when trying to locate each other.
7.5 Ethical Considerations
The obvious conclusion with any sort of automation is there will be a reduction of jobs on the market. However, as previously stated, the problem in and of itself is not a lack of people per say, but rather a lack of time or money. PCG as such, allows designers to produce more content over the same time span. It is possible that this will lead to
a reduction of jobs in the future, however, at this point in time, we must overcome the increasing costs to produce digital games in order for it to not become too expensive for the consumer, and thus halting the industry.
8
Conclusion & Suggestions for Further Research
We consider this project to be a success. We created a proof of concept implementation and documented it in this paper. The research questions we posed were answered. We have proven that this concept is at least viable at the offline stage, that is, during the production of the game. We believe that it can be extended to the online stage, and we suggest that this should be researched further. Another interesting point of research would be to see exactly how the parameters affect the outcome. That is, what the optimal boundaries for the various settings are and how can they be made more intuitive. It would also be interesting to perform a larger study in which each generated map would be tested against each original map to see how they would rank overall. We would also like to see how well this method performs in a non-symmetrical game mode. This could be tested against another category of game, perhaps a first person shooter. It could also be interesting to perform user tests where other metrics are gathered. For instance how many left turns are taken, how many power-ups per minute are used, the average length of time a battle takes on the maps and so on. This to see if there is a discernible relationship between the geometry composition and the level of fun.
References
[1] Blizzard Entertainment. StarCraft, 1998. [Digital Game]. [2] CD Project Red. The Witcher 3, 2015. [Digital Game].
[3] Dataspelsbranchen. Digital spelf¨ors¨aljning i sverige 2013-2015. http: //www.dataspelsbranschen.se/media/153159/digital%20spelf%C3%B6rs% C3%A4ljning%202015.pdf, 2016. [Online; accessed 2016-04-10].
[4] Desurvire, H., Caplan, M., and Toth, J. A. Using heuristics to evaluate the playability of games. In CHI ’04 Extended Abstracts on Human Factors in Computing Systems (New York, NY, USA, 2004), CHI EA ’04, ACM, pp. 1509–1512.
[5] Desurvire, H., and El-Nasr, M. S. Methods for game user research: Studying player behavior to enhance game design. vol. 33. July 2013, pp. 82–87.
[6] Doran, J., and Parberry, I. Controlled procedural terrain generation using soft-ware agents. In IEEE Transactions on Computational Intelligence and AI in Games 2(2), 111-119. 2010.
[7] Fenlon, W. Most of The Witcher 3’s dialogue scenes were animated by an algorithm. http://www.pcgamer.com/ most-of-the-witcher-3s-dialogue-scenes-was-animated-by-an-algorithm/, 2016. [Online; accessed 2016-04-10].
[8] Fullerton, T. Game Design Workshop: A Playcentric Approach to Creating Inno-vative Games, 2nd ed. Taylor and Francis, Hoboken, 2008.
[9] Fullerton, T. Game Design Workshop: A Playcentric Approach to Creating Inno-vative Games, Third Edition, 3rd ed. CRC Press, 2014.
[10] Gearbox Software. Borderlands 2, 2012. [Digital Game].
[11] Hendrikx, M., Meijer, S., Van Der Velden, J., and Iosup, A. Procedural content generation for games: A survey. ACM Trans. Multimedia Comput. Commun. Appl. 9, 1 (Feb. 2013), 1:1–1:22.
[12] Hevner, A. R., March, S. T., Park, J., and Ram, S. Design science in infor-mation systems research. MIS Quarterly 28, 1 (2004), 75–105.
[13] Johnson, L., Yannakakis, G. N., and Togelius, J. Cellular automata for real-time generation of infinite cave levels. In Proceedings of the 2010 Workshop on Procedural Content Generation in Games (New York, NY, USA, 2010), PCGames ’10, ACM, pp. 10:1–10:4.
[14] Lechner, T., Ren, P., Watson, B., Brozefski, C., and Wilenski, U. Proce-dural modeling of urban land use. In ACM SIGGRAPH 2006 Research Posters (New York, NY, USA, 2006), SIGGRAPH ’06, ACM.
![Table 2: Overview of Geometry Types. The listed types were found when looking at the original maps in MK64 [20]](https://thumb-eu.123doks.com/thumbv2/5dokorg/3947681.71258/17.892.174.734.352.592/table-overview-geometry-types-listed-types-looking-original.webp)

![Table 4: The different key components found in all MK64 [20] Battle-mode maps.](https://thumb-eu.123doks.com/thumbv2/5dokorg/3947681.71258/27.892.149.757.412.711/table-different-key-components-mk-battle-mode-maps.webp)
![Table 5: Our geometry heuristics, based on HEP [4]. ID Heuristic](https://thumb-eu.123doks.com/thumbv2/5dokorg/3947681.71258/28.892.176.723.240.618/table-geometry-heuristics-based-hep-id-heuristic.webp)
