Department of Wildlife, Fish, and Environmental Studies
Using camera traps to identify the influence
of seasonal climate variations on the
passage rates of a multi-species ungulate
community in Öster Malma, Sweden
Using camera traps to identify the influence of seasonal climate
variations on the passage rates of a multi-species ungulate
community in Öster Malma, Sweden
Nicholas Varley
Supervisor: Tim Hofmeester, Swedish University of Agricultural Sciences, Department of Wildlife, Fish, and Environmental Studies
Assistant supervisor: Joris Cromsigt, Swedish University of Agricultural Sciences, Department of Wildlife, Fish, and Environmental Studies
Assistant supervisor: Sabine Pfeffer, Swedish University of Agricultural Sciences, Department of Wildlife, Fish, and Environmental Studies
Examiner: Wiebke Neumann, Swedish University of Agricultural Sciences, Department of Wildlife, Fish, and Environmental Studies
Credits: 30 credits
Level: Second cycle, A2E
Course title: Master Thesis in Environmental science, A2E –
Management of Fish and Wildlife Populations – Master’s Programme
Course code: EX0936
Course coordinating department: Department of Wildlife, Fish, and Environmental Studies
Place of publication: Umeå Year of publication: 2019
Cover picture: From camera traps
Title of series: Examensarbete/Master's thesis
Part number: 2019:18
Online publication: https://stud.epsilon.slu.se
Keywords: ungulates, passage rates, temperature, snow depth, camera trap
1 Introduction 7 1.1 Hypotheses 9 2 Methods 10 2.1 Study Area 10 2.2 Site Characteristics 11 2.3 Camera Traps 12 2.4 Image Classification 13 2.5 Climate Data 14 2.6 Data Analysis 15 3 Results 17 3.1 Climate Variations 17 3.2 Monthly Passage Rates per Species 17 3.3 Monthly Passage Rates per Species & Temperature 18 3.4 Monthly Passage Rates per Species & Snow Depth 20 3.5 Effect of Temperature on Seasonal Passage Rates 22
4 Discussion 25
4.1 Effect of Climate Variations on Ungulate Passage Rates 25
4.2 Limitations 27
5 Conclusion 29
References 30 Acknowledgements 35
Table of contents
Climate change projections have consistently shown that globally, surface temper-atures are expected to continue to rise with most observed warming trends being seasonal, the largest increases occurring in winter and spring (Jones et al., 2005). Europe is heading towards a future with much milder winters, hotter summers with less precipitation and an increase in the frequency and intensity of extreme weather events (Kelemen et al., 2009; IPCC, 2014). Flood risk is also predicted to increase due to snowmelt floods shifting from spring to winter as a result of a reduced snow season and less accumulation during winter months (Behrens et al., 2010).
The climate changes outlined in the latest IPCC report (IPCC, 2018) are set to have serious effects on the behaviour and distribution of a range of both flora and fauna. Studies into the relationship between climate change and ecology have shown that plant and animal species are facing changes to their current range due to new climate conditions, with many expected to shift poleward and to higher altitudes, in keeping with expanding climate boundaries (Walther et al., 2002). Native plant and tree spe-cies may also be threatened by competition with the range expanding non-native species that may be better adapted to the novel climatic conditions (Katona et al., 2013). Such changes in plant community may affect food availability for animals as climate change is causing an advance in phenology, whether that be the flowering of a plant or breeding of an animal (Visser and Both, 2005). The shift in phenology of a plant species, for example, could cause the whole ecological system to become mistimed, posing a serious threat to the fitness of other species within the system which may depend on it for their own survival and reproduction (Visser and Both, 2005).
Ungulate species are expanding throughout Europe due to a combination of factors. These include a greater focus on conservation, displacement or removal of compet-itors and predators, and hunting establishments introducing native and non-native species that may be more desirable to hunt (Apollonio et al., 2010). Land-use change is another important factor that has influenced ungulate populations in Europe as
changes to forestry practices has increased habitat size and quality, as well as more intense agriculture increasing high-quality crops (Kuiters et al., 1996; Cutini et al., 2015). Supplementary feeding of ungulates has also been used as a management tool to improve winter survival rates, reduce forest and crop damage and attempt to reduce human-animal conflict (Felton et al., 2017). With an increase in warmer win-ters in northern Europe, it is possible that ungulate species will expand further north as higher latitudes become more hospitable for more species (Büntgen et al., 2017). The expansion of multiple species would create a situation where native and non-native species would occupy the same habitat areas forming novel species-rich un-gulate communities. Where once there may have only been one or two unun-gulate species within a habitat range, one can increasingly find four to six species, increas-ing pressure on the system supportincreas-ing these species (Putman et al., 2011; Pfeffer et al., 2018). Such an increase in community size can have positive and negative im-pacts on the wider ecosystem. While in some cases it could lead to overexploitation of food sources, damage to the plant community and greater competition (Stewart et al., 2011; Bowyer et al., 2016; Lecomte et al., 2016) in others, ungulates can act as ‘ecosystem engineers’, altering their habitat through changes to plant, soil and water conditions as a result of grazing, trampling, urination and excretion (Baruzzi and Krofel., 2017).
The main threat to Sweden in terms of climate change might occur in the form of warmer summers, milder winters and an increase in extreme events. Scandinavia has seen the strongest warming in Europe, particularly in winter, since the 1980s and climate projections have shown temperatures could rise by up to 3 °C by 2100 (IPCC, 2014; Eklund et al., 2015). Currently, there is a gap in the knowledge of how changing climatic conditions such as variations in temperature and snow depth, af-fect the behaviour and movement of northern ungulates. Previous studies have fo-cused to understand the relationship between a changing climate and topics such as supplementary feeding of ungulates, the influence of hunting on habitat selection, and moose-vehicle collisions (Seiler, 2004; Felton et al., 2017; Niemi et al., 2017).
Understanding the impact climate has on ungulate behaviour is important for their survival as it allows identification of any ways in which ungulates might be affected by future climate change.
In this study, I have investigated the relationship between ungulate patch use and climate conditions over monthly and seasonal timescales in southern Sweden for a three year period from September 2015 to September 2018 using camera traps.
1.1 Hypotheses
I hypothesised that (I) as average monthly snow depth increases, monthly ungulate passage rates will decrease as snow limits movement of ungulates and covers ground forage. As well as this, I expect that (II) passage rates will decrease during hot months as ungulates choose to stay in shaded areas to maintain a lower body tem-perature than if they were moving through patches.
2.1 Study Area
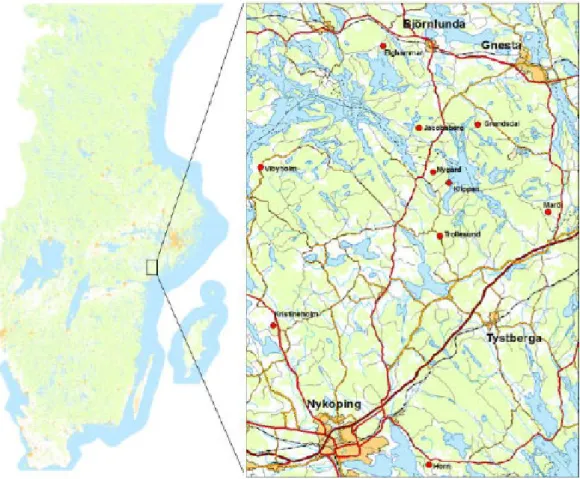
The study area ‘Öster Malma’ is located in the province of Södermanland, South-East Sweden, within the surrounding area of the city of Nyköping (Figure 1). The area has a temperate climate with average summer temperatures between 15.4 °C and 17.2 °C and mean winter temperatures between -0.6 °C and -2.6 °C (Climate-data.org, 2015). Precipitation varies (including rain and snow) with a minimum of 27 mm of precipitation in March and a maximum of 66 mm in August (Climate-data.org, 2015). There are five ungulate species present in the study area, which include moose, fallow deer, roe deer, red deer and wild boar (Sus scrofa).
Figure 1: Location of the study area ‘Öster Malma’, Sweden with its ten study sites
marked in red (Ånöstam, 2017).
2.2 Site Characteristics
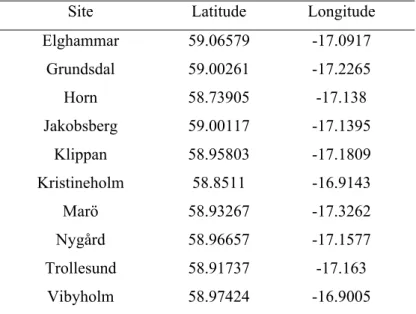
The study area consists of ten individual sites (Table 1). Nine of the ten sites were clear cut in 2014 and replanted with Norway spruce (Picea abies) or Scots pine (Pinus sylvestris) in 2015. Horn was the only site that was clear cut in 2013 and naturally regenerated with pine. The experiment (see description below) started in autumn 2015 and is still ongoing. Today some sites are dominated by one or two tree species, mainly spruce and pine, while others have much more species diversity, including silver birch (Betula pendula), downy birch (Betula pubescens), aspen (Populus tremula), willow (Salix) and rowan (Sorbus).
Table 1: Latitudes and longitudes of the ten sites.
Site Latitude Longitude
Elghammar 59.06579 -17.0917 Grundsdal 59.00261 -17.2265 Horn 58.73905 -17.138 Jakobsberg 59.00117 -17.1395 Klippan 58.95803 -17.1809 Kristineholm 58.8511 -16.9143 Marö 58.93267 -17.3262 Nygård 58.96657 -17.1577 Trollesund 58.91737 -17.163 Vibyholm 58.97424 -16.9005
Each of the ten sites consists of four exclosures that measure 14x14 m. All exclo-sures were set up in 2015 before the experiment began. The excloexclo-sures have four different treatment conditions: control, closed, summer, and winter. The control ex-closures are open all year and are therefore constantly accessible by all animals. The closed exclosures are closed and fenced off all year to prevent animals from entering and accessing the vegetation within them. Summer exclosures are closed and fenced off during the vegetation period (April to October) only and are then opened during
the months October to April. The winter exclosures are the opposite and are there-fore closed during the non-vegetation period (October to April) and opened during the vegetation period.
2.3 Camera Traps
Each control exclosure is permanently equipped with a camera trap (Reconyx Hy-perfire HC500) in the south-east corner all year round. A second camera trap is shared between the summer and winter exclosures, being switched interchangeably during opening months. The cameras are set up to monitor the wildlife using the exclosures with a focus on the four ungulate species; moose, red deer, fallow deer, and roe deer. As the closed exclosure is permanently free from animals, there is no camera covering that area. The cameras have been in place and continuously taking photographs since they were first installed at the end of September 2015 and are checked regularly to ensure that they are still operating correctly and have sufficient battery power.
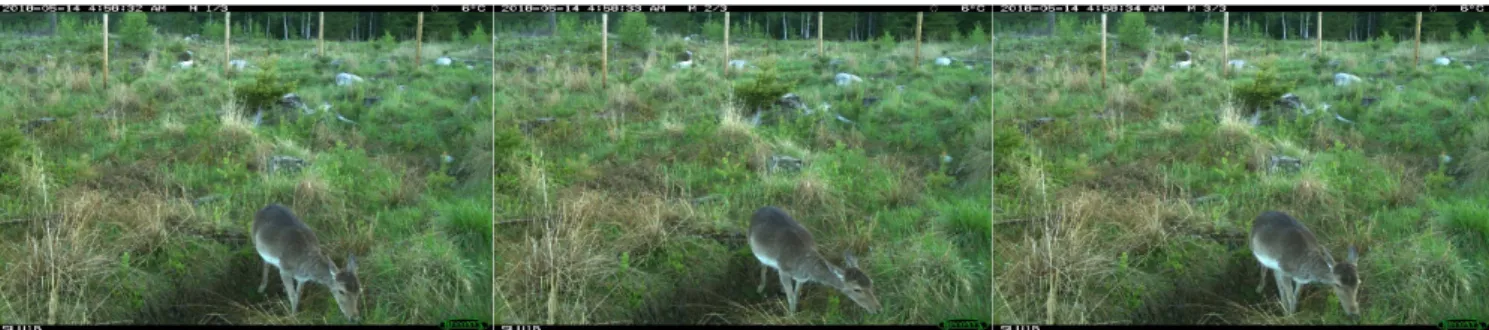
A passive infrared sensor triggers the cameras, when the sensor registers a differ-ence in thermal infrared between moving objects and their background in the detec-tion zone, such as the temperature of the background vegetadetec-tion or soil and a moving animal (Welbourne et al., 2016). Once triggered, the camera takes a series of three images at one-second intervals to capture the event detected (see for an example, Figure 2). Each camera also records a time-lapse image per day at 13:00 to check the camera is still functioning.
Figure 2: Example of a trigger event from a camera on-site showing a female fallow
2.4 Image Classification
Images captured by the camera traps were classified to create a data set of the ani-mals seen in the area. I classified images taken from September 2017 to September 2018 from eight out of the ten sites (Nygård & Vibyholm were excluded due to time constraints). Images taken between September 2015 and September 2017 were pre-viously classified and therefore included in my analysis (excluding Nygård and Vibyholm). The classification process involved identifying a number of variables including the species present, the number of animals present per species and whether individuals were foraging. Foraging was identified where an animal had its head to the ground or could clearly be seen eating leaves from plants or trees. Foraging be-haviour was not separated by species, therefore if there was an image containing two species where one was foraging but the other wasn’t, it was classified as a for-aging event. Anything else was marked as ‘other behaviour’. Species identification could be done due to obvious differences in the appearance of the four ungulate species in question, such as body size and shape. In some instances it was not pos-sible to identify the species present due to blurred images or very dark night images, therefore the animal present was recorded as ‘unknown species’ and excluded from the analyses. Other details such as gender, age and male antler points were also recorded. However, these characteristics were not relevant in this study and thus have not been included here for further analysis.
For my analysis, I used passage events as a measure of patch use. A single passage event represents a sequence of continuous pictures triggered by an individual or group of animals. To determine the end of one sequence and the start of a new se-quence, I implemented a time gap of 5 mins between two triggers. If the second trigger was taken >5 mins after the initial sequence of images, it was deemed to be a separate passage event.
2.5 Climate Data
I extracted data for daily temperature and snow depth from the webpage of the Swe-dish Meteorological and Hydrological Institute (SMHI,
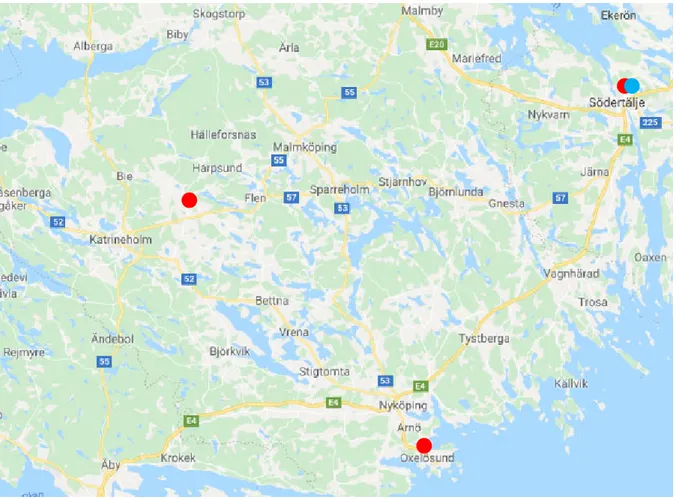
https://www.smhi.se/data/meteorologi/ladda-ner-meteorologiska-observa-tioner#param=airtemperatureInstant,stations=all). Since there has been no weather station located directly in the study area, I extracted daily temperature data from three weather stations surrounding Öster Malma; Floda A, Södertälje and Ox-elösund (Figure 3). Based on the data of these three stations, I calculated an average daily temperature for the whole study area. These average daily temperatures were used to extract average values per month and season. Snow depth data was only available from one weather station around Öster Malma, Södertälje (Figure 3). Therefore, I used the snow depth data from this individual station only to calculate monthly and seasonal averages for the study area. To define a season I used each seasons’ start and end date (SMHI, https://www.smhi.se/en/weather/sweden-weather/season-map/, see also Table 2) and rounded them to receive full months. Rounding to months was done due to a delay in finding the exact start and end dates of each season.
Table 2: Definition of which months form each season.
Season Months
Spring March/April/May Summer June/July/August
Autumn September/October/November Winter December/January/February
Figure 3: Location of the three SMHI weather stations. Weather stations used for
temperature data are marked with red spots while snow depth data is marked with a blue spot (Google Maps., 2019).
2.6 Data Analysis
I used the data on passage events to calculate a species and site-specific daily index (passage rate per day) as the sum of passages per species, per site, per day. Similarly, I calculated a monthly and seasonal passage rate per species by taking a sum of all passage events divided by the number of days covering those specific time periods, for example, the fallow deer passage rate in June 2018 would be the sum of fallow deer passage events divided by 30 days. I repeated this step for every month between September 2015 and September 2018 and similarly each season from autumn 2015 to autumn 2018. This allowed for a monthly and seasonal passage rate to be calcu-lated for each species for the whole study period as seen below:
Passage rate = number of passages/number of days camera was active (per month or season)
I first used this dataset to run linear regression tests to identify any relationship be-tween the passage rates of each species separately and the climate variables. My dependent variables were monthly and seasonal passage rates of the four species, where I ran separate models for the monthly and seasonal variables, with two co-variates, temperature and snow depth. I then ran general linear mixed effect models in which the passage rate was always the dependent variable. In the initial models, I used the passage rates of all four ungulate species together. I then ran separate models for each species individually to identify species-specific responses to the climate variables, using the passage rate of each individual species as the dependent variable. I included ungulate species as a fixed effect, temperature, temperature² and snow cover as covariates, and site and year as random factors. Again, I ran separate models for monthly and seasonal response variables. I performed all statistical anal-yses in SPSS Statistics 25.
3.1 Climate Variations
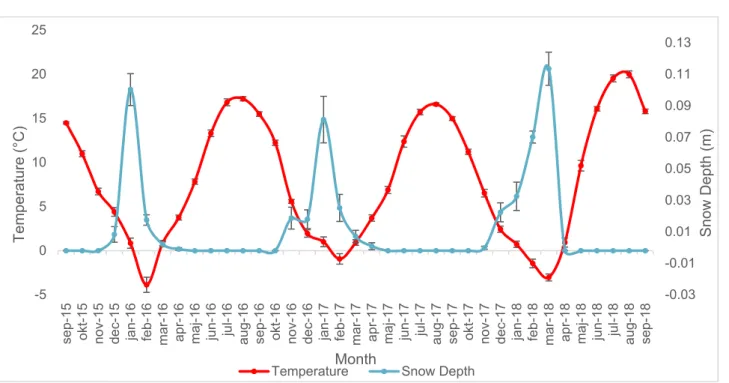
Winter 2016/17 was on average approximately 3 °C warmer than the winters of 2015/16 and 2017/18 (Figure 4). The summer of 2018 was on average approxi-mately 3 °C warmer than the two previous summers (Figure 4). Snow depth in the study area varied across the three year study period with winter 2016/17 having the lowest snow depth and winter 2017/18 having the highest snow depth (Figure 4). Summer months always had a snow depth of 0 m, while during spring months (usu-ally in March) there was a very small amount of snow present before it melted to 0 m (Figure 4).
Figure 4: Average monthly temperature variations (in red) and average monthly
snow depth variations (in blue) from September 2015 to September 2018 with stand-ard error.
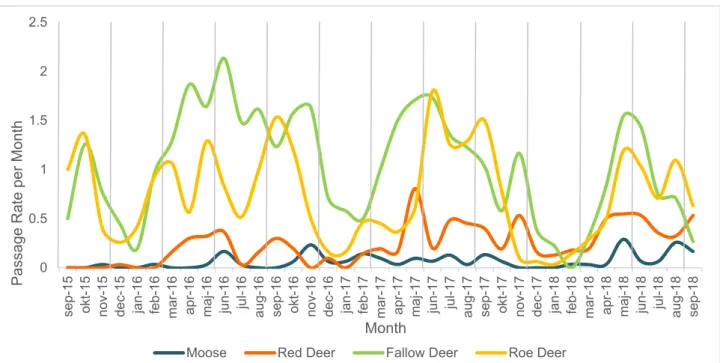
3.2 Monthly Passage Rates per Species
During the study period, fallow deer and roe deer strongly dominate the visits to the sites, followed by red deer and then moose. The passage rates for all four species, and in all years, dropped strongly during mid-winter. Overall, there appears to be a
3 Results
-0.03 -0.01 0.01 0.03 0.05 0.07 0.09 0.11 0.13 -5 0 5 10 15 20 25 sep-15 okt-15 nov-15 dec-15 jan-1 6 fe b-16mar-16 apr-16 maj-16 jun-1
6 ju l-16 au g-1 6 sep-16 okt-16 nov-16 dec-16 jan-1 7 fe b-17
mar-17 apr-17 maj-17 jun-1
7 ju l-17 au g-1 7 sep-17 okt-17 nov-17 dec-17 jan-1 8 fe b-18
mar-18 apr-18 maj-18 jun-1
8 ju l-18 au g-1 8 sep-18 Snow Depth (m) Temperature (°C) Month
general trend towards passage rates of fallow deer and roe deer declining slightly over the years. There also seems to be a general trend towards moose and red deer passage rates increasing slightly over the same time period.
Figure 5: Monthly passage rates of moose (blue), red deer (orange), fallow deer
(green) and roe deer (yellow) from September 2015 to September 2018. Grey vertical lines represent seasons.
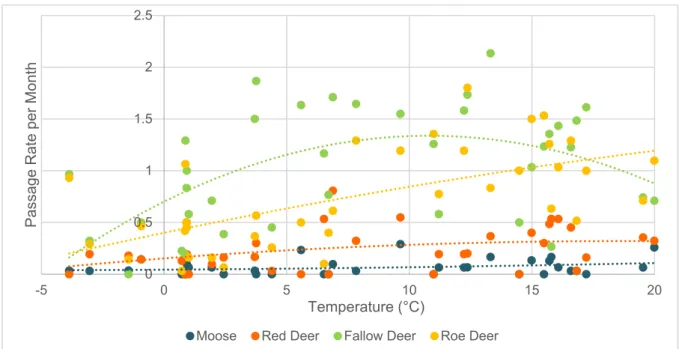
3.3 Monthly Passage Rates per Species and Temperature
Temperature and temperature² had a strong effect on the dependent variable, monthly passage rates (p = <.001) (Table 3). Ungulate species also had a significant effect on the dependent variable (p = .002). However year and site, the two random factors did not have a significant effect on monthly passage rates (p = .169; p = .732) (Table 3). Among the four species, roe deer had the highest R² value (0.3817) (Table 4). When looking at the influence of temperatures on the monthly passage rates of the four species individually, it can be seen that temperature had a positive effect on the monthly passage rates of roe deer (estimate = 0.005; p = <.001) (Table 4). 0 0.5 1 1.5 2 2.5 sep-15 okt-15 nov-15 dec-15 jan-1 6 fe b-16
mar-16 apr-16 maj-16 jun-1
6 ju l-16 au g-1 6 sep-16 okt-16 nov-16 dec-16 jan-1 7 fe b-17
mar-17 apr-17 maj-17 jun-1
7 ju l-17 au g-1 7 sep-17 okt-17 nov-17 dec-17 jan-1 8 fe b-18
mar-18 apr-18 maj-18 jun-1
8 ju l-18 au g-1 8 sep-18 Passage
Rate per Month
Month
Moose, red deer and fallow deer however, were not significantly influenced by tem-perature (estimate = <.001, p = .124; estimate = .001, p = .235; estimate = .001, p = .616) (Table 4).
Figure 6: Monthly passage rate of moose (blue), red deer (orange), fallow deer
(green), and roe deer (yellow) in relation to temperature. Dotted lines indicate pol-ynomial regressions.
Table 3: Univariate statistical analysis for the effect of temperature, temperature², species, year and site, on the dependent variable, monthly ungulate passage rates.
Explanatory Variables df f p
Temperature Hypothesis 1 32.310 .000 Error 1010
Temperature² Hypothesis 1 12.687 .000 Error 1010
Ungulate Species Hypothesis 3 6.538 .002 Error 22.236 Year Hypothesis 3 2.033 .169 Error 10.755 Site Hypothesis 7 .623 .732 Error 22.374 0 0.5 1 1.5 2 2.5 -5 0 5 10 15 20 Passage
Rate per Month
Temperature (°C)
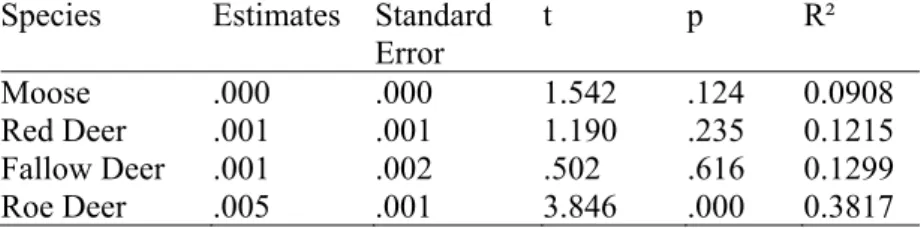
Table 4: Regression coefficient estimates, standard error, significance (p) and R² for the effect of temperature on the monthly passage rates per species.
Species Estimates Standard
Error t p R² Moose .000 .000 1.542 .124 0.0908 Red Deer .001 .001 1.190 .235 0.1215 Fallow Deer .001 .002 .502 .616 0.1299 Roe Deer .005 .001 3.846 .000 0.3817
3.4 Monthly Passage Rates per Species and Snow Depth
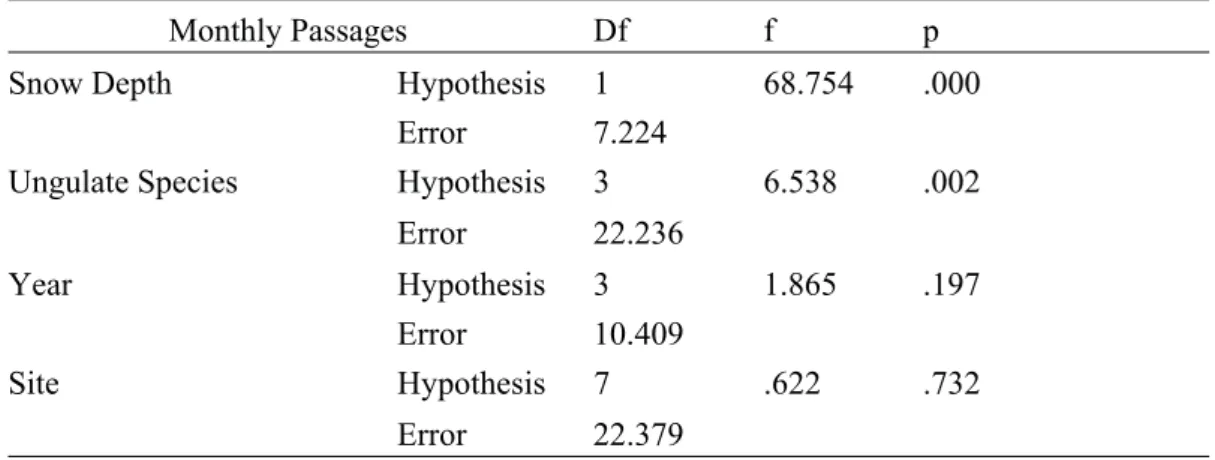
Snow depth had a strong effect on the dependent variable, monthly passage rates (p = <.001) (Table 5). Ungulate species also had a significant effect on the dependent variable (p = .002). Year and site did not have a significant effect on monthly pas-sage rates (p = .197; p = .732) (Table 5). Fallow deer had the highest R² value out of the four species (0.3214) (Table 6). The individual analysis of the effect of snow depth on the monthly passage rate of each species shows that snow depth had a strong effect on fallow deer monthly passages (estimate = -1.289, p = .001) (Table 6). Moose, red deer and roe deer were not significantly influenced by snow depth (estimate = .004, p = .952; estimate = -.202, p = .342; estimate = -.354, p = .249) (Table 6).
Figure 7: Monthly passage rate of moose (blue), red deer (orange), fallow deer
(green), and roe deer (yellow) in relation to snow depth.
Table 5: Univariate statistical analysis for the effect of snow depth, ungulate spe-cies, year, and site on the dependent variable, monthly ungulate passage rates.
Monthly Passages Df f p Snow Depth Hypothesis 1 68.754 .000
Error 7.224
Ungulate Species Hypothesis 3 6.538 .002 Error 22.236 Year Hypothesis 3 1.865 .197 Error 10.409 Site Hypothesis 7 .622 .732 Error 22.379 0 0.5 1 1.5 2 2.5 0 0.02 0.04 0.06 0.08 0.1 0.12 Passage
Rate per Month
Snow Depth (m)
Table 6: Regression coefficient estimates, standard error, significance (p) and R² for the effect of snow depth on the monthly passage rates per species.
Species Estimates Standard
Error t p R² Moose .004 .072 .060 .952 0.045 Red Deer -.202 .212 -.951 .342 0.1332 Fallow Deer -1.289 .392 -3.285 .001 0.3214 Roe Deer -.354 .306 -1.156 .249 0.2394
3.5 Effect of Temperature on Seasonal Passage Rates
On a seasonal time scale temperature, temperature² and snow depth all have a strong effect on ungulate passage rates (p = .001; p = .015; p = <.001) (Tables 7 & 8). In the temperature model ungulate species is also significant (p = .003) (Table 6). Nei-ther year nor site, the two random factors, were statistically significant (p = .553; p = .679) (Table 7). Similarly, in the snow depth model, ungulate species was statis-tically significant while year and site were not statisstatis-tically significant (p = .003; p = .533; p = <.680) (Table 8).
Individually, none of the four species’ seasonal passage rates are significantly influ-enced by temperature (Table 9). There is a strong effect of snow depth on fallow deer seasonal passage rates (estimate = -2.735, p = .019) (Table 10). There is no effect of snow depth on the seasonal passage rates of moose, red deer or roe deer (p = .334; p = .892; p = .373) (Table 10).
Table 7: Univariate statistical analysis for the effect of temperature, temperature², ungulate species, year and site on the dependent variable, seasonal ungulate pas-sage rates. Seasonal Passages df f p Temperature Hypothesis 1 11.613 .001 Error 274 Temperature² Hypothesis 1 9.951 .015 Error 274
Ungulate Species Hypothesis 3 6.437 .003 Error 22.582
Year Hypothesis 3 .763 .533 Error 14.125
Site Hypothesis 7 .691 .679 Error 24.520
Table 8: Univariate statistical analysis for the effect of snow depth, ungulate spe-cies, year and site, on the dependent variable, seasonal ungulate passage rates.
Seasonal Passages df f p Snow Depth Hypothesis 1 27.562 .000
Error 275
Ungulate Species Hypothesis 3 6.437 .003 Error 22.582
Year Hypothesis 3 .765 .533 Error 13.313
Site Hypothesis 7 .690 .680 Error 24.552
Table 9: Regression coefficient estimates, standard error, significance (p) and R² for the effect of temperature on the seasonal passage rates per species.
Species Estimates Standard Error t p Moose .001 .001 1.810 .073 Red Deer .002 .002 .835 .406 Fallow Deer -.003 .003 -.891 .375 Roe Deer .004 .003 1.433 .155
Table 10: Regression coefficient estimates, standard error, significance (p) and R² for the effect of snow depth on the seasonal passage rates per species.
Species Estimates Standard Error t p Moose .206 .213 .970 .334 Red Deer -.096 .708 -.136 .892 Fallow Deer -2.735 1.150 -2.378 .019 Roe Deer -.750 .839 -.894 .373
4.1 Effect of Climate Variations on Ungulate Passage Rates
I carried out this study to understand the influence climate has on the patch use of a multi-species ungulate community in the south of Sweden. As Sweden’s ungulate communities are expanding in both density and range it is important to understand how the climate affects their behaviour. With climate projections showing a strong likelihood of future warming, up to 3 °C warmer by 2100 (IPCC, 2014), understand-ing the response of ungulates to these factors is important. I investigated the effect of climate on ungulate patch use by using data collected from camera traps to assess whether climate changes were having any influence on ungulate passage rates in southern Sweden. The outcome of this study is that temperature only had a strong effect on the monthly passage rates of roe deer, suggesting that as temperature in-creases, roe deer visitation increases. Snow depth only had a strong effect on the monthly and seasonal passage rates of fallow deer. Fallow deer passage rates were negatively affected over a monthly and seasonal scale in relation to snow depth, which suggests that their visitation rates decline as snow depth increases.
Hypothesis I, that as average monthly snow depth increases, monthly ungulate passage rates will decrease, is only supported by fallow deer as the estimates show that the effect of snow depth on them was found to be significant, their monthly and seasonal passage rates decreasing as snow depth increased (Tables 6 and 10). The relationship between increasing snow depth and decreasing fallow deer pas-sage rates could be caused by the snow covering the field layer forage therefore covering a major food source for the fallow deer. Supplementary feeding sites could also influence passage rates as supplementary feeding has been found to maintain higher densities of fallow deer in areas around feeding sites than would normally occur (Felton et al., 2017), therefore suggesting that feeding sites are an important determinant in fallow deer habitat patch selection.
The reduction in passage rates as snow depth increases has also been reported in other studies, especially in larger ungulates as the movement in snow requires a
greater expenditure of energy (Rivrud et al., 2010). Moose, in particular, have been previously found to have their movement limited by snow cover (van Beest et al., 2011) however my results do not support this. Again this could be due to the low density of moose in the area giving a poor representation of how patch use of moose in Sweden is influenced by climate variations.
Hypothesis II, that passage rates will decrease during hot months, was not supported by these results. Over the years moose and red deer summer passage rates increased while there was a general trend towards decreasing summer passage rates for fallow deer and roe deer (Figure 5). This differs to other studies into the effect of tempera-ture no movement, which have found that high summer temperatempera-tures have a nega-tive effect on the movement of cervids (Hayes and Krausman., 1993; Rivrud et al., 2010). A possible explanation for moose and red deer summer month passage rates increasing during the study period could be related to the set-up of the study area. When the ten sites were clear cut and replanted in 2014/2015, grasses and small trees were the dominant species. This would have suited the smaller species, fallow deer and roe deer, as their dietary preferences are grasses, herbs and small trees. However, during the following years, the trees have grown taller with bigger branches, therefore being more favourable for the larger species, moose and red deer. This would mean that there was higher forage availability for moose and red deer in summer 2018.
4.2 Limitations
A major limitation of this study is the short time period during which the camera traps were taking images at the ten sites. Three years of continuous data was used as this is what was available to me at the time. However, when trying to assess the influence of weather on another variable, in this case, ungulate passage rates, it would be preferential to have at least 30 years of data as climate often refers to average weather patterns during the previous 30 years (NASA, 2017).
The snow depth data is also a limiting factor to this study. Only one weather station around the study area, Södertälje, had snow depth data available for the time period covering this study. This data is collected manually by SMHI either with a ruler, or fixed measuring stick (SMHI, 2013). This measurement is also not always carried out daily. If this is the case then the snow depth from the nearest weather station also recording snow depth is taken. This leads to the possibility of erroneous read-ings through human error as well as having to rely on the readread-ings of different weather stations that is potentially tens of kilometres away from the study area. The other issue with snow depth data is that snow depth may vary significantly across small scales as it is influenced by the topography of the area, for example, slope or canopy cover (Zheng et al., 2016). As this is not uniform across the study area there will be areas which are deeper or shallower than the SMHI measurements.
Regarding image classification, a limitation arises due to the fact that it has been carried out by at least three different people, including myself. This could lead to human errors such as the misidentification of a species or misinterpretation of be-haviour such as foraging (Young et al., 2018). While this is not likely to lead to significant errors that would be detrimental to the study, it is something that future studies should take into consideration. The image classification should be done con-sistently by the same individual to remove the human error.
The camera traps work with a passive infrared sensor which detects heat differences between the background and a moving object (such as an animal). On extremely hot
days the background, such as vegetation and rocks, may heat up to the point where there is no detectable difference between the background and an animal walking in front of the camera (van Berkel, 2014). This is more of an issue with smaller species as they emit less body heat than larger species. Detection distance is another issue related to body size as detection of smaller species could decrease compared to the larger species the further away from the camera they are (Apps and McNutt, 2018). This would, therefore, mean that some passage events could be missed on an ex-tremely hot day and therefore affect the outcome of the study by giving a false rep-resentation of the hottest days. Detectability and passage rates can also be affected by differences in insulation of summer and winter fur. As ungulates grow a winter coat to better insulate themselves during the colder months, there will be a difference in their heat signature in summer and winter, thereby leading to the possibility of being less detectable by the sensor in the camera trap (Hofmeester et al., 2019). This could mean that during winter, the ungulates are more detectable than in summer as there will be a bigger difference in the background temperature and their body tem-perature which is increased due to better-insulated fur.
Understanding the effect of climate variations on ungulate patch use can help to develop management strategies and further our knowledge on how climate change could affect multi-species ungulate communities. Here, I have shown that tempera-ture and snow depth may have an effect on ungulate passage rates but that effects varied widely among species. Temperature was found to strongly affect the monthly passage rates of roe deer while snow depth was found to strongly affect both the monthly and seasonal passage rates of fallow deer. While climate variations have been found to have an effect on ungulate passage rates, it is more likely that other factors had more of an influence on changes to ungulate passage rates, such the setup of the study site and forage availability. After being clear cut and replanted, the smaller species (fallow deer and roe deer) initially benefitted from the vegetation available, However as the tree species in the sites have grown they are now more desirable for the larger species, moose and red deer. While some strong effects of both temperature and snow depth were found in my study there is still a lot of un-certainty and further studies should be carried out to better understand how climate variations affect ungulate patch use.
Ånöstam, F., 2017. Timing of ungulate browsing and its effect on sapling height and the field layer vegetation. Examensarbete i ämnet biologi / Sveriges
lantbruks-universitet, Institutionen för vilt, fisk och miljö, 2017(4), pp.1-28.
Apollonio, M., Andersen, R. and Putman, R. eds., 2010. European ungulates and their management in the 21st century. Cambridge University Press.
Apps, P.J. and McNutt, J. W., 2018. How camera traps work and how to work them. African Journal of Ecology, 56, pp.702-709.
Baruzzi, C. and Krofel, M., 2017. Friends or foes? Importance of wild ungulates as ecosystem engineers for amphibian communities. North-Western Journal of
Zool-ogy, 13(2), pp.320-325.
Behrens, A., Georgiev, A. and Carraro, M., 2010. FUTURE IMPACTS OF CLI-MATE CHANGE ACROSS EUROPE. CEPS WORKING DOCUMENT, 324, pp.1-27.
Bowyer, R.T., Bleich, V.C., Stewart, K.M., Whiting, J.C. and Monteith, K.L., 2014. Density dependence in ungulates: a review of causes, and concepts with some clarifications. California Fish and Game, 100(3), pp.550-572.
Büntgen, U., Greuter, L., Bollmann, K., Jenny, H., Liebhold, A., Galván, J.D., Stenseth, N.C., Andrew, C. and Mysterud, A., 2017. Elevational range shifts in four mountain ungulate species from the Swiss Alps. Ecosphere, 8(4), p.1761. Climate-Data.org. 2015. CLIMATE NYKÖPING. (Online) Available at:
https://en.climate-data.org/europe/sweden/soedermanlands-laen/nykoeping-19/. Cutini, A., Chianucci, F. and Apollonio, M., 2015. WILD UNGULATES AND FORESTS IN EUROPE: INSIGHTS FROM LONG TERM STUDIES IN CEN-TRAL ITALY. Atti del II Congresso Internazionale di Selvicoltura. Progettare il
futuro per il settore forestale, Firenze, 26-29 novembre 2014. Firenze: Accademia Italiana di Scienze Forestali, 1, pp.509-517.van
Eklund, A., Axén Mårtensson, J., Bergström, S., Björck, E., Dahné, J., Lindström, L., Olsson, J., Simonsson, L. and Sjökvist, E., 2015. Sveriges framtida klimat: Un-derlag till Dricksvattenutredningen. SMHI.
Felton, A.M., Felton, A., Cromsigt, J.P., Edenius, L., Malmsten, J. and Wam, H.K., 2017. Interactions between ungulates, forests, and supplementary feeding: the role of nutritional balancing in determining outcomes. Mammal Research, 62(1), pp.1-7.
Google Maps, 2019, Öster Malma, Nyköping, Sweden (Online). Available at:
https://www.google.co.uk/maps/place/%C3%96ster+Malma/@58.9323978,16.990 4486,9.88z/data=!4m8!3m7!1s0x465f2496792779d9:0xcb88af3d4cd3fd6d!5m2!4 m1!1i2!8m2!3d58.950833!4d17.158055.
Hayes, C.L. and Krausman, P.R., 1993. Nocturnal Activity of Female Desert Mule Deer. Journal of Wildlife Management, 57, pp.897-904.
Hofmeester, T., Cromsigt, J.P.G.M., Odden, J., Andrén, H., Kindberg, J. and Lin-nell, J.D.C., 2019. Framing pictures: A conceptual framework to identify and cor-rect for biases in detection probability of camera traps enabling multi-species com-parison. Ecology and Evolution, 2019, pp.1-17.
IPCC, 2014: Climate Change 2014: Synthesis Report. Contribution of Working Groups I, II and III to the Fifth Assessment Report of the Intergovernmental Panel on Climate Change, Core Writing Team, Pachauri, R.K. and Meyer, L.A. (eds.) (p. 151). IPCC, Geneva, Switzerland.
IPCC, 2018: Summary for Policymakers. In: Global warming of 1.5°C. An IPCC Special Report on the impacts of global warming of 1.5°C above pre-industrial levels and related global greenhouse gas emission pathways, in the context of strengthening the global response to the threat of climate change, sustainable de-velopment, and efforts to eradicate poverty. Masson-Delmotte, V., Zhai, P., Pört-ner, H.O., Roberts, D., Skea, J., Shukla, P.R., Pirani, A., Moufouma-Okia, W., Péan, C., Pidcock, R., Connors, S., Matthews, J.B.R., Chen, Y., Zhou, X., Gomis, M.I., Lonnoy, E., Maycock, T., Tignor, M. and Waterfield, T. (eds.) (p. 32). IPCC, Geneva, Switzerland.
Jones, G.V., White, M.A., Cooper, O.R. and Storchmann, K., 2005. CLIMATE CHANGE AND GLOBAL WINE QUALITY. Climate Change, 73, pp.319-343. Katona, K., Kiss, M., Bleier, N., Székely, J., Nyeste, M., Kovács, V., Terhes, A., Fodor, Á., Olajos, T., Rasztovits, E. and Szemethy, L., 2013. Ungulate browsing
shapes climate change impacts on forest biodiversity in Hungary. Biodiversity and
conservation, 22(5), pp.1167-1180.
Kelemen, A., Munch, W., Poelman, H., Gakova, Z., Dijkstra, L. and Torighelli, B., 2009. Regions 2020 The Climate Change Challenge for European Regions.
Euro-pean Commission Directorate General for Regional Policy, 1, pp.1-27.
Kuiters, A.T., Mohren, G.M.J. and van Wieren, S.E., 1996. Ungulates in temperate forest ecosystems. Forest Ecology and Management, 88, pp.1-5.
Lecomte, X., Fedriani, J.M., Caldeira, M.C., Clemente, A.S., Olmi, A. and Bugalho, M.N., 2016. Too Many Is Too Bad: Long-Term Net Negative Effects of High Density Ungulate Populations on a Dominant Mediterranean Shrub. PLoS
ONE, 11(7), pp.1-14.F
NASA. 2017. NASA - What's the Difference Between Weather and Climate? (Online) Available at: https://www.nasa.gov/mission_pages/noaa-n/climate/cli-mate_weather.html.
Niemi, M., Rolandsen, C.M., Neumann, W., Kukko, T., Tiilikainen, R., Pusenius, J., Solberg, E.J. and Ericsson, G., 2017. Temporal patterns of moose-vehicle colli-sions with and without personal injuries. Accident Analysis & Prevention, 98, pp.167-173.
Pfeffer, S.E., Spitzer, R., Allen, A.M., Hofmeester, T.R., Ericsson, G., Widemo, F., Singh, N.J. and Cromsigt, J.P., 2018. Pictures or pellets? Comparing camera trapping and dung counts as methods for estimating population densities of ungu-lates. Remote Sensing in Ecology and Conservation, 4(2), pp.173-183.
Putman, R., Apollonio, M. and Andersen, R. eds., 2011. Ungulate management in Europe: problems and practices. Cambridge University Press.
Rivrud, I., Loe, L.E. and Mysterud, A., 2010. How does local weather predict red deer home range size at different temporal scales? Journal of Animal Ecology, 79, pp.1280-1295.
Seiler, A., 2004. Trends and spatial patterns in ungulate-vehicle collisions in Swe-den. Wildlife Biology, 10(4), pp.301-313.
SMHI. 2013. Hur mäts snödjup? (Online) Available at: https://www.smhi.se/kun-skapsbanken/meteorologi/hur-mats-snodjup-1.27291.
SMHI. 2019. Ladda ner meteorologiska observationer. (Online) Available at:
https://www.smhi.se/data/meteorologi/ladda-ner-meteorologiska-observa-tioner#param=airtemperatureInstant,stations=all.
SMHI. 2019. Season Map. (Online) Available at:
https://www.smhi.se/en/weather/sweden-weather/season-map/.
Stewart, K.M., Bowyer, R.T., Dick, B.L. and Kie, J.G., 2011. Effects of density dependence on diet composition of North American elk Cervus elaphus and mule deer Odocoileus hemionus: an experimental manipulation. Wildlife Biology, 17, pp.417-430.
van Beest, F.M., Rivrud, I.M., Loe, L.E., Milner, J.M. and Mysterud, A., 2011. What determines variation in home range size across spatiotemporal scales in a large browsing herbivore? Journal of Animal Ecology, 80(4), pp.771-785. van Berkel, T., 2014. Camera Trapping for Wildlife Conservation. Expedition
Field Techniques, 1, pp.1-122.
Visser, M.E. and Both, C., 2005. Shifts in phenology due to global climate change: the need for a yardstick. Proceedings of the Royal Society B: Biological Sciences, 272(1581), p.2561.
Walther, G.R., Post, E., Convey, P., Menzel, A., Parmesan, C., Beebee, T.J., Fro-mentin, J.M., Hoegh-Guldberg, O. and Bairlein, F., 2002. Ecological responses to recent climate change. Nature, 416(6879), p.389.
Welbourne, D.J., Claridge, A.W., Paull, D.J. and Lambert, A., 2016. How do pas-sive infrared triggered camera traps operate and why does it matter? Breaking down common misconceptions. Remote Sensing in Ecology and Conservation, 2(2), pp.77-83.
Young, S., Rode-Margono, J. and Amin, R., 2018. Software to facilitate and streamline camera trap data management: A review. Ecology and Evolution, 8(19), pp.9947-9957.
Zheng, Z., Kirchner, P.B. and Bales, R.C., 2016. Topographic and vegetation ef-fects on snow accumulation in the southern Sierra Nevada: a statistical summary from lidar data. The Cryosphere, 10, pp.257-269.
I would like to thank my supervisors Joris Cromsigt, Tim Hofmeester, and Sabine Pfeffer for their help and support throughout the duration of my study and for providing me with the opportunity to take on this study overseas in Sweden. Also, thanks to Sabine for enabling me to take part in fieldwork. I would also like to ex-tend my thanks to SLU and Beyond Moose for allowing me to use their facilities and data for this study. Special thanks to thank my family for the support they have given me over the course of my thesis and my two years in Utrecht. Finally, thanks to my friends, especially Joel, Rosie and Nathan for their continued support over the course of both of my degrees.