SICS Technical Report T2006:14
ISRN:SICS-T–2006/14-SE
ISSN 1100-3154
Holistic debugging
by
Lars Albertsson
2006-08-25
lalle@sics.se
Swedish Institute of Computer Science
Box 1263, S-164 29 Kista, Sweden
Abstract:
We present holistic debugging, a novel method for observing execution of com-plex and distributed software. It builds on an instruction set simulator, which provides reproducible experiments and non-intrusive probing of state in a dis-tributed system. Instruction set simulators, however, provide low-level infor-mation, so a holistic debugger contains a translation framework that maps this information to higher abstraction level observation tools, such as source code debuggers.
We have created Nornir, a proof-of-concept holistic debugger, built on the simu-lator Simics. For each observed process in the simulated system, Nornir creates an abstraction translation stack, with virtual machine translators that map machine-level storage contents (e.g. physical memory, registers) provided by Simics, to application-level data (e.g. virtual memory contents) by parsing the data structures of operating systems and virtual machines. Nornir includes a modified version of the GNU debugger (GDB), which supports non-intrusive symbolic debugging of distributed applications. Nornir’s main interface is a de-bugger shepherd, a programmable interface that controls multiple dede-buggers, and allows users to coherently inspect the entire state of heterogeneous, dis-tributed applications. It provides a robust observation platform for construction of new observation tools.
1
Introduction
Every year, the size and complexity of computer software systems increase — we build larger applications by stacking more software construction tools, such as compilers, components, runtime systems, middleware, code generators. Unfor-tunately, software quality assurance methods do not scale in the same manner. As the size of software projects grow, testing and debugging takes more effort in comparison to programming, and for complex software projects it becomes the dominant development cost [Jones, 1998]. This ratio is likely to increase further in the near future, as the proliferation of processors with multiple cores will force many software vendors to write parallel programs, which are harder to test, profile, and debug than sequential programs. Hence, there is a desperate need for scalable quality assurance methods that handle concurrency errors.
Test case execution combined with program observation, e.g. debugging, white-box testing, tracing, and performance profiling, is the predominant soft-ware quality assurance method today. Unlike softsoft-ware construction tools, the observation tools available are generally not stackable nor capable of coherent information exchange with other observation tools. Most existing software ob-servation tools implement their own probing mechanisms, and are limited to observing a single abstraction layer in a homogeneous environment. Therefore, they only partially address their observation needs for complex software, and the oldest and most primitive debugging method — the print statement and variations thereof — is still predominant.
We claim that the the inherently fragile observation technologies that ex-isting test and debug tools rely on is an explanation for their lack of scalabil-ity. The factors contributing to the fragility have been discussed in several pa-pers [Gait, 1985, McDowell and Helmbold, 1989, Huselius, 2002, Schutz, 1993] as inherent difficulties in debugging distributed software: indeterminism (also referred to as nonrepeatability, nonreproducibility), probe effect (aka intrusion), and incomplete causal ordering. If an observation technique cannot provide re-peatable experiments, and if the act of probing affects the observation, it is hard to use it for building scalable observation tools. The factors are discussed in more detail in Section 2.1. Although these factors are particularly troublesome when observing distributed software, they occur in any software using asyn-chronous services, e.g. clocks, interrupts, Unix signals, non-blocking I/O, etc, and limit observability in any complex computer system.
1.1
Simulation
The problems mentioned above are not unique to software engineering, but occur in all natural science engineering disciplines; all physical systems are indeter-ministic to some extent and affected by probe effect. Engineers in other fields often use simulation, a technique unaffected by these problems, as a comple-ment to real expericomple-ments. Simulation is a primary engineering methodology in other natural science disciplines, but has not yet become widespread for software engineering, except for small scale embedded systems development.
Using simulators for observing software systems has major benefits: dis-tributed systems can be observed without intrusion, and experiments can be repeated. Moreover, a single-threaded simulator implementation executes the processes in a distributed system in a deterministic order, and events are there-fore globally ordered in a single serialisation of concurrent events.
Instruction set simulators could be useful for observing software systems, but they have one property that prevents them for being useful for most soft-ware: they are only able to provide information at their abstraction level: the hardware/software boundary. They can be probed for software-visible hardware state, i.e. physical memory contents, register contents, etc, but have little or no knowledge about the programs running in the simulated machine, and are not particularly useful for probing high-level constructs, such as variable contents in user-space programs or database tables.
1.2
Holistic debugging
Our main contribution is holistic debugging, a novel method for observing com-plex computer software running in instruction set simulators. A holistic debug-ger provides a translation framework that maps low-level data probed from the simulator to source-level application data. It also includes symbolic debuggers for inspecting individual processes in a simulated system. The debuggers are controlled by a debugger shepherd, which supports coherent observation of all participating processes in a distributed system. The shepherd is programmable and allows users to create new observation tools and debugging abstractions, and to write application-specific surveillance routines.
A holistic debugger should not be thought of as yet another tool that solves a particular, narrow problem better than other tools. Although it can be used as an interactive debugger, its primary purpose is to serve as a meta-tool that enables construction of new tools, based on more robust techniques than existing tools.
We have demonstrated that building a holistic debugger is feasible by creat-ing the prototype Nornir, built on the complete system simulator Simics. Build-ing a holistic debugger of reasonable quality, with support for many flavours of architectures, operating systems, and programming languages, is a huge task, beyond the scope of a research paper, and Nornir implements a subset of a holistic debugger. Our design is described in Section 3, Nornir is described in Section 4, and Section 5 contains discussion on the use of simulation for soft-ware observation, and some practical problems we have encountered. Section 2 provides some background information on observation of computer software, complete system simulation, and debugging.
2
Background
2.1
Issues with observing distributed systems
2.1.1 Indeterminism
Modern computers are indeterministic. There are factors affecting program exe-cution that cannot be accurately predicted, for example interrupt arrival times, memory communication interleavings, subroutine execution times, and clock readings. Complex programs are always affected by such random factors, and program executions are therefore not fully reproducible, unless the program is explicitly designed to be independent of unpredictable factors. In theory, repeat-able execution is a prerequisite for the standard repetitive debugging procedure. In practice, repetitive debugging is meaningful for simple programs, as long as the variations are small.
Indeterministic execution effectively prevents construction of scalable ob-servation tools. Development and use of automated tools when experiments cannot be reliably reproduced is usually too time-consuming to be worthwhile. As an example, consider the multitude of debuggers for distributed software, using standard debuggers as building blocks [McDowell and Helmbold, 1989, Huselius, 2002, Schutz, 1993]. Although such debuggers have potential for de-bugging complex software, they have not become widely used. Due to inde-terministic factors, repeated executions of a particular program tend to differ at some points, for example in interleaving of events. Automated debuggers are generally not able to adapt to variations in an intelligent manner, and are therefore not practical for indeterministic programs.
2.1.2 Probe effect
Any attempt to monitor a computer system with software probes will change the system’s behaviour. This is referred to as probe effect [Gait, 1985]. The probe effect contributes to the indeterminism problem, and also limits the amount of data that can be observed in a running system. A monitoring service that suffers from probe effect provides a service whose quality degrades with increased usage. Such a service is inherently fragile and unsuitable for scalable observation tools. 2.1.3 Incomplete causal ordering
There is no global clock in distributed systems, and a global ordering on all events in a system can often not be determined, even in post-mortem. Observ-ing a partial orderObserv-ing defined by the happens-before relation [Lamport, 1978], however, is sufficient for observing the execution of a distributed system. In order for a tool to observe this partial ordering, it must be able to observe all messages sent between processes, and their points of arrival. This can be difficult in practice. In some distributed systems, messages and arrival points are straightforward to record, as in the case of network packets delivered to an
application. Other types of messages, such as cache-to-cache transfers, are diffi-cult to observe, and building tools that record and replay distributed executions involving such messages is hard.
We have not found an established name for this problem, and will call it incomplete causal ordering.
2.2
Complete system simulation
The issues mentioned above can be avoided by using a simulator, and a holis-tic debugger can be built on any determinisholis-tic simulator that provides good programming and observation services. Instruction set simulators have suitable characteristics to serve as debugging platforms: They provide models that are detailed enough for running applications in binary form, but still run sufficiently fast to run large applications. We have built our prototype implementation on Simics [Magnusson et al., 2000], a type of instruction set simulator known as complete system simulator [Rosenblum et al., 1995] (or sometimes full system simulator).
Simics is binary compatible with commodity computers, and includes models of processor, memory, disks, network cards, etc. It runs unmodified commodity operating systems and applications in binary form. Simics is designed to be deterministic; if a simulation scenario starts in a well defined simulation state, and the input model is synthetic and predictable, it will produce exactly the same scenario for each simulation.
Simics runs roughly two orders of magnitude slower than the host machine when modelling a machine similar to the host. It is slow enough to be a sig-nificant drawback for simulation as a method, but fast enough to allow large applications to be observed. The simulation speed depends on the accuracy of the timing model. We usually run with a coarse model, where every instruc-tion takes one clock cycle. If a more accurate timing model is desired, Simics allows users to model cache memory hierarchies, providing a good timing ap-proximation without sacrificing much simulation performance. It also supports detailed models of processor pipelines, out-of-order execution, and speculative execution, at the price of severe performance degradation. Magnus Ekman’s dissertation [Ekman, 2004] contains some benchmarks on Simics with different timing models. Complete system simulator timing models have been validated and discussed by Gibson et.al. [Gibson et al., 2000].
Simics can simulate multiprocessor machines and multiple networked com-puters, which may be heterogeneous in architecture. When simulating multiple processors, Simics alternates between them, and the slowdown is linear to the number of processors in the target system.
Simics supports storing and loading checkpoint files representing the entire state of a simulated system. This feature compensates for the simulation slow-down in many scenarios, if the experiment setup takes a long time. Simics also supports idle loop detection, i.e. fast forwarding simulated machines when they spin in the operating system’s idle loop, which gives a significant performance increase on workloads where the machines mostly wait for I/O operations.
2.3
Symbolic debugging
A standard source code debugger, also known as a symbolic debugger, requires external services for probing the debugged program, normally provided by the operating system. The debugger probes the program for raw data and use debugging information emitted by compilers to translate the binary data back to variable values in a high-level programming language. Debuggers typically only require a few probing services by the operating system. Some debuggers, such as the GNU debugger, can be extended to debug other types of target machines by redefining the probing services, which we take advantage of in Nornir.
3
The holistic debugger
Holistic debugging takes a complete system perspective on distributed system observation. A holistic debugger runs a distributed software system in a simu-lator and provides the user with means to examine all components in a system simultaneously, at any abstraction level higher than the simulator’s.
3.1
Machine observation
A complete system simulator provides non-intrusive access to all system state visible to software. Thus, we can at any time stop the simulator, freeze time in the simulated world, and retrieve state data relevant for the application. Unlike standard debuggers, which use probing services supplied by the operating system to probe the state of running processes, the holistic debugger must use non-intrusive probing techniques, and cannot rely on operating system services. It probes the simulator for machine state, but the information retrieved is raw, binary information that has been transformed by compilers, virtual machines, and operating systems, and is no longer easily comprehensible to humans. In order to make this information useful for a programmer, it must be translated back to the abstraction level the programmer deals with, i.e. to variables and types in the programming languages used in the application.
3.1.1 Abstraction stacks
Each program in a computer system runs in a machine, which interprets the program instructions and updates machine state accordingly. The most basic machine is the physical machine, where instructions are interpreted by hard-ware, and machine state is stored in physical storage, such as memory, disk, and registers. Each machine has a set of instructions that programs can use, and programmers use a compiler to translate source code into the machine’s instruction set. A physical computer usually runs only one program directly on the hardware, and in many cases, this program is an operating system. The operating system provides virtual machines, in which other programs can run [Tanenbaum, 1992]. The programs in the virtual machines are likewise
Program: Linux Simulated physical machine: PC Virtual machine: process
Program: kaffe Virtual machine: JVM Program: hello world VM Program
Symbolic context: Linux Virtual machine context: process Symbolic context: kaffe Virtual machine context: JVM Symbolic context: hello world
Debugger shepherd User extensions
Physical machine context:PC
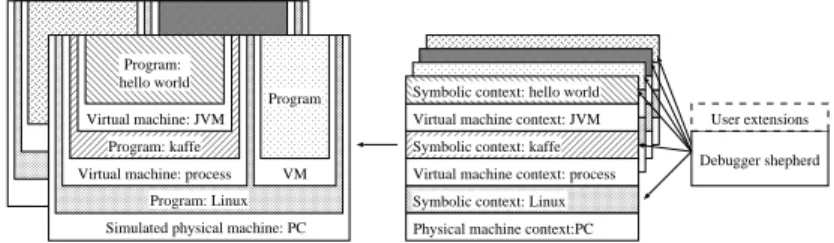
Figure 1: Holistic debugger structure with example applications. programmed in a high-level language, translated by a compiler to machine in-structions. Some of these programs may in turn form other types of virtual machines, interpreting some program, which may be generated by a compiler, and so on. Computer systems generally contain a number of such abstraction stacks, seldom more than a few levels deep.
For each program in a stack, there is a symbolic transformation, where a compiler transforms source code to machine code. There is often no straight-forward way to perform the reverse translation from machine code to source code without help from the compiler, but most compilers are able to provide debugging information that contains adequate information to perform reverse translation, even in the presence of compiler optimisations.
For each virtual machine in the stack, there is also a machine transformation; the storage of the program running in the virtual machine is mapped to storage in the machine that is running the program providing the virtual machine. For example, the virtual memory and registers of the virtual machine corresponding to a Unix process is mapped to physical registers, memory, or disk blocks. The machine transformation is usually reversible, if the state of the virtual machine can be examined.
3.1.2 Translation stacks
In our design of a holistic debugger, for each inspected process in the simu-lated system, there is an associated abstraction translation stack. A translation stack consists of pairs of symbolic context objects and machine context objects, corresponding to the symbolic transformations and machines of the inspected process. The structure is shown in Figure 1. When the user inspects a particu-lar program, a translation stack is instantiated. It includes a symbolic context object, with a symbolic translator that lets the user inspect the execution and state of the program, similarly to a standard debugger. The symbolic translator probes the underlying machine context objects for program state data.
Machine context objects that refer to a physical machine probe the simula-tor for simulated machine state. Machine context objects that refer to virtual machines, for example operating system processes, include a virtual machine translator (VMT) — a component that translates requests for virtual machine state to state requests to the underlying machine context object. In order for
the VMT to perform storage reference translations, it probes the state of the program providing the virtual machine, using its symbolic context object.
There are no fundamental problems stacking translators in this manner, as long as the necessary information for performing reverse translations is available. The stacked translator design enables translation of the information available in the underlying simulators to any abstraction level in the system.
3.2
Debugger shepherd
The functionality described above is sufficient for observing arbitrary distributed software in a robust manner; we can instantiate a symbolic debugger for the pro-cesses in the application and debug them individually. Debugging distributed applications in this manner is an improvement over existing debug methods, since the user can examine intermittent behaviour. Having one manually con-trolled debugger for each process is inconvenient for debugging a large number of processes, however, and if a user wants to compare data in different processes, he must do so manually.
The main interface of a holistic debugger is therefore a debugger shepherd — a master inspection module responsible for instantiating and controlling transla-tion stacks. The shepherd has access to all symbolic translators, and allows the user to follow causal paths (sequences of causally related events) by inspecting and comparing state in multiple processes.
A typical shepherd supports at least the basic debugging operations: break-points, variable inspection, etc, complemented with new debugging operations, such as time breakpoints and operating system event monitoring. Operations that affect execution, such as program loading and changing memory contents, are not supported.
3.3
Holistic debugging abstractions
Holistic debugging adds new dimensions to debugging: time, multiple processes, and multiple abstraction levels. This opens an opportunity and need for new debugging abstractions that complement the old abstractions and match users’ needs better. We suggest a few such abstractions below. These abstractions are easy to implement if the holistic debugger architecture is sound, and users can add their own domain-specific abstractions.
3.3.1 Eventpoints
Eventpoints is a generalisation of breakpoints — a monitor for any type of event in the target system that is of interest to the user. Time breakpoints, which trigger at a specific point in time in the simulated system, is a simple example. Eventpoints can be used to monitor lower level events than the application normally deals with, for example the reception of a network packet with a particular content, or program-specific events that are more complex than the execution of a single code statement. Figure 2 shows condensed Nornir example
code that monitors when a particular program is started in Linux. New types of eventpoints can be created hierarchically in this manner by recursive use of the Observer design pattern.
template < class KernelSymbolicContext > class ExecFileEvent : public Eventpoint {
KernelSymbolicContext symbolicContext_; // Kernel context.
string fileName_; // The name of the executable. auto_ptr< Eventpoint > execve_; // Monitor for execve system calls. // Pid of the process that started the program.
typename KernelSymbolicContext::Typedef_pid_t pid; public:
ExecFileEvent(const KernelSymbolicContext & symbolicContext const string & fileName):
symbolicContext_(symbolicContext), fileName_(fileName),
// flush_old_exec is called during execve, put a breakpoint at an // appropriate line in that function.
execve_(symbolicContext.machineContext()->breakOnAddress( symbolicContext.findLine(
"flush_old_exec", // The function name. "current->self_exec_id++;" // An appropriate line. )))
{
// Notify us when any process calls execve.
execve_->registerCallback(this, & ExecFileEvent::execveTrigger); }
void ExecFileEvent::execveTrigger(const Eventpoint & event) { // Did this process start the program we are interested in? if (symbolicContext_.currentProcess().get_comm() == fileName_) {
// Yes. Store pid, so that it can be retrieved by observers. pid = symbolicContext_.currentProcess().get_pid();
callRegisteredCallbacks(); // Notify observers. }
} };
Figure 2: Approximate implementation of the ExecFileEvent eventpoint. The get command get pid methods provide access to the “comm” and “pid” data members in the Linux data structure task struct.
3.3.2 Causal path monitors
Distributed application often deal with causal paths — distributed sequences of events that are causally related. Debugging distributed software often in-volves following causal paths with erroneous behaviour. Most programming lan-guages and associated debuggers provide sequential, non-distributed program-ming models and force programmers to write and debug distributed software in terms of individual processes. This division is orthogonal to the application
logic, and adds complexity to the debugging process.
The debugger shepherd provides effective means for debugging causal paths. A user that wants to debug the behaviour of a causal path can write routines that monitor the path, inspect the state of participating processes when interesting eventpoints are triggered, and alert the user of unexpected inconsistencies in the inspected data. We will refer to such a routine as a causal path monitor. Since a holistic debugger allows debugging of multiple abstraction layers, a causal path monitor can follow the path vertically through abstraction layers, e.g. into the operating system, as well as horizontally, across multiple processes and machines. Causal path monitors can run independently of each other, and are reusable debugging components, useful for large systems with multiple developers.
A programmer that develops a particular causal path will need to debug the path during testing. Instead of debugging a failing test case by typing manual commands to traditional debuggers, he can write similar commands in the form of a causal path monitor that recognises the input associated with the failing test, follows path progress, and prints an alert on any unexpected data inconsistency. Writing a causal path monitor involves slightly more typing than manual debugging, but it can be added to a project, reused by all developers in the project, and activated if the path in question is suspected of behaving erroneously again.
3.4
The holistic debugger as a platform
Holistic debugging addresses a major debugging problem that currently has no good solution. Nevertheless, we believe that, its most important potential is as a robust platform for building other software observation and analysis tools, much like an operating system is a solid platform for other programs. The construction of such tools lies beyond the scope of this paper, but a holistic debugger’s utility as a tool platform influences our research, and the design of Nornir.
3.4.1 White-box testing
The properties of a holistic debugger makes it very useful for writing white-box tests, and we expect it to be an important use case. It would be particularly useful for testing applications where the coherency of the distributed state is important, e.g. peer-to-peer applications or distributed file systems, since a holistic debugger allows the user to inspecting the consistency of a global ap-plication snapshot. A simulator is also useful for testing apap-plications that are expected to survive hardware faults. In this case, a holistic debugger is not only useful for debugging errors, but also for directing fault injection to test ap-plication robustness in particularly sensitive stages, for example during online software upgrades. Today, these applications are often tested with manual fault injection, which is inefficient and costly.
SuSE Linux 2.4.14 UltraSparc workstation VM: process Program VM Program Simics Static symbolic translator: Linux Debugger broker VMT GDB GDB Verdandi
Figure 3: Nornir logical structure 3.4.2 Performance analysis
A complete system simulator is a powerful tool for understanding performance behaviour of complex software [Alameldeen et al., 2002, Fedorova et al., 2005, Herrod, 1998]. Since all software state is visible in a holistic debugger, it adds the capability to measure performance-related events at multiple ab-straction layers, e.g. page faults, database response times, or application-specific events, and provide more detailed hints on application performance problems than standard profilers can. It is also suitable for performance analysis of soft real-time and distributed applications, since it provides non-intrusive measurements. Moreover, the simulator provides global ordering, making it possible to identify time-consuming events on causal paths with un-desired latency. Obtaining such information is difficult in real experiments, which is illustrated by attempts to build tools that analyse causal path perfor-mance [Aguilera et al., 2003, Chen et al., 2003, Barham et al., 2004].
We have used an earlier version of Nornir to demonstrate how complete system simulation, combined with virtual machine translation, can be used for performance debugging of soft real-time systems [Albertsson, 2002]. We cor-related measurements of performance-cor-related data from the operating system and the application (a video decoder) with application deadline misses. This provided useful information on causes for soft real-time performance problems, which could not have been obtained with traditional profiling tools.
4
Nornir
This section describes Nornir, our implementation of a holistic debugger, and its main components. Since we believe that it will primarily be used as a building block for analysis tools, our development has concentrated more on programma-bility and extensiprogramma-bility than on user interface convenience. In order to gain more knowledge about the applicability and limitations of holistic debugging, we use Nornir to build new types of software analysis tools, which are beyond the scope of this paper. The implementation reflects the needs of those tools, which are similar in nature to the use cases discussed in Section 3.4.
the complete system simulator Simics [Magnusson et al., 2000], which provides a model of the physical computer. The main Nornir user interface is Verdandi, the debugger shepherd. For each process being debugged, Verdandi starts and controls a copy of the GNU debugger (GDB). We have modified GDB to debug processes in a simulated Linux system; a specialised target backend in GDB implements a number of debugging primitives that are necessary for GDB to operate. The Nornir GDB target backend connects and sends requests corre-sponding to basic debugging primitives (reading memory, inserting breakpoints, etc) over a TCP/IP socket to a debugger broker, a library loaded into Simics. The debugger broker acts administrative hub for the GDB processes: It instan-tiates a machine context object, including a virtual machine translator (VMT), for each process debugged, and connects it to a GDB socket. It controls simu-lation progress, and only allows simusimu-lation to proceed when all GDB instances have issued continue commands. Verdandi also keeps a direct connection to the debugger broker, for inspecting and monitoring state not related to particular processes, e.g. operating system events.
4.1
Nornir usage example
As an example of holistic debugging (but without a shepherd), we arranged a debugging session of a race condition in the Apache Portable Runtime li-brary (APR) [Foundation, ]. The lili-brary contains a routine, apr file lock, that provides mutual exclusion using lock files, a common method for provid-ing controlled concurrent access to on-disk databases. On some Unix flavours, however, the routine fails to provide exclusion among threads that share a memory context. This error causes intermittent problems for products using the library, for example Subversion, a popular open-source version control sys-tem [Subversion, ].
We wrote a component test that uses apr file lock in a similar way to Subversion1: A multithreaded server process serves client requests for accesses
to files protected by a lock file. In our test case, the server is supposed to send a unique integer number to each client.
We arranged a test scenario with a simulated UltraSparc workstation running SuSE Linux 7.3. The test files were packed in a file representing a simulated CD. We wrote a simulation control script that inserts the CD and feeds input data to the simulated serial port, corresponding to a user that logs in on the machine, copies files from the CD, and starts the test script.
We ran the scenario once and noted that, when loaded with a few hundred simultaneous clients, some clients received numbers already sent to other clients, or no number at all. We reproduced the execution, used Nornir services to monitor process creation, and attached GDB instances to the processes that were involved in erroneous behaviour in the first execution. We debugged server
1When Subversion is running in multithreaded mode. We were unable to debug a full
Sub-version scenario, since it triggers unrelated problems in the SuSE Linux distribution supported by Nornir.
threads competing for the lock file, and could see how multiple threads retrieved the lock, contrary to the library user’s expectations.
Figure 4: Example debugging session without shepherd.
Figure 4 shows some example output from this debugging session. The debugger in the right window has used a Nornir-specific command (catch system execfile) to wait for the start of an instance of the apr test client program and then attached to it. This debugger prints a prompt and waits for input, since it is attached to the process running on the processor when simulation was stopped. The left debugger window has attached to a server process waiting for socket connections. The windows in the background show the contents of the simulated machine’s graphical and serial port console.
4.2
Virtual machine translation
A Unix process machine context class implements the debugging primitives re-quired by GDB. Registers and memory addresses in GDB refer to virtual regis-ters and addresses in a Linux process. The VMT has knowledge about operating system abstractions, and translates from virtual registers and addresses to phys-ical registers and addresses by parsing the process list and virtual memory page tables in the running Linux kernel. GDB breakpoints also refer to virtual ad-dresses, which the VMT translates and inserts breakpoints at the appropriate physical address. Since the virtual memory mappings may change for a break-point, the VMT also watches the associated page table entries for any changes and adjust the breakpoints accordingly. The VMT uses a static symbolic trans-lator for probing the kernel state, described below.
4.3
Static symbolic translation
Adapting GDB to operate on a simulated target machine is a natural method for creating a symbolic translator. GDB, however, cannot easily be integrated into another program, which forces a VMT using it to retrieve information via text interface parsing, which is error-prone to program and could cause performance problems. The Linux VMT makes heavy use of the kernel symbolic translator, so we want to access it with an efficient, statically typed interface. We have therefore created a static symbolic translator, which automatically generates code that matches the types in the Linux kernel. We compile a Linux kernel, telling the compiler to generate debug information. The kernel is loaded into GDB, which uses the debug information to generate a report on the memory layout of the data types in Linux. The report is fed to a target replicator, which parses it and generates a C++ class for each type in the kernel. Each replicated type class contains methods that can read a data object of this particular type from a target memory address. In the case of compound data types, there are also methods for accessing the individual data members. Figure 5 shows an example of generated code used in the VMT. By programming the VMT with target replication, it becomes resistant to changes in the kernel source, and only has to be changed when there is a major reorganisation of data structures, or when there are semantic changes. Over the time we have developed Nornir, we have used Linux kernels ranging from the 2.1 to 2.4 series, and there have been very few such changes, resulting in small adjustments to the VMT code.
Static symbolic translation assumes that the probed data structures reside in memory, and that their address can easily be retrieved. It works sufficiently well for Linux, which uses global variables to store important data structures, but it does not work as well for probing local variables in a routine. We believe that we will eventually need to switch to a hybrid approach, where the generated type classes also have the ability to query the running kernel via GDB, thus supporting local variable probing without sacrificing type safety.
Original Linux code (slightly edited for clarity):
struct task_struct {
struct task_struct * next_task; pid_t pid;
... };
struct task_struct init_task;
Replicated type class:
class Struct_task_struct { ...
Pointer< Struct_task_struct > get_next_task() const; Typedef_pid_t get_pid() const;
};
Struct_task_struct variable_init_task();
Example usage (simplified, assuming only one target machine):
Pointer< Struct_task_struct > findTask(Typedef_pid_t pid) { Pointer< Struct_task_struct > task =
variable_init_task().memoryLocation();
while ((! task.isNull()) && (task->get_pid() != pid)) task = task->get_next_task();
return task; }
Figure 5: Example of static symbolic translation.
4.4
Verdandi
Verdandi, Nornir’s implementation of a debugger shepherd, is a holistic debug-ger interface implemented in Python. It is convenient to use a standard scripting language for the main interface, since existing code and standard libraries can be reused. Python also includes an interactive interpreter, which can be used by users that prefer interactive debugger interfaces.
Verdandi spawns a GDB process for each debugged process in the target system and uses the GDB machine interface (GDB/MI), a structured text for-mat, for communicating with GDB. The most basic GDB functionality, such as inserting breakpoints and reading variables, is exported to Verdandi. In a typical usage scenario, the user inserts a number of eventpoints, calls a waitFor routine that runs the simulation until either of these occur, inspects variables, calls waitFor again, etc.
Verdandi implements threaded causal path monitors, where each monitor is executed as a sequential routine in a separate Python thread, and runs indepen-dently of other monitors. The threads call blocking routines when they want to wait for new eventpoints, and an eventpoint manager thread in the debugger shepherd controls the simulation, allowing it to proceed only when all monitors are waiting for new eventpoints. This abstraction allows causal path behaviour to be expressed as a compact sequence of statements.
Breakpoints and other eventpoints derive from a common Eventpoint class, which the user can derive from in order to implement higher level event moni-toring. A typical user-defined eventpoint class would run causal path monitors that inspect the paths corresponding to a high-level event, and notify the Ver-dandi run-time system when the event has triggered. For example, an event-point subclass monitoring the arrival of a particular http query can use ordinary breakpoints to monitor read system calls, buffer the data read on each socket, compare the concatenated buffers, and trigger when the sought string arrives.
The code below demonstrates how Verdandi causal path monitors could be used to debug or white-box test the APR error described in Section 4.1. Note that the monitors run independently, and also that we can compare the num-bers received by clients, and thereby determine the consistency of distributed application state. In this simple example, there are other ways of checking dis-tributed consistency, but for complex applications, state is often buried deep in the application and difficult to check with other means.
5
Discussion
Using a complete system simulator as a building block for debugging tools has drawbacks, but also some major advantages; besides getting reproducible ex-periments, we also have good control over the execution environment. We can test and debug our software in scenarios that are difficult to arrange in practice, for example on very expensive computers, faster computers than are available today, on large numbers of low-end computers, or in the presence of hardware and communication faults.
5.1
Simulation as a method
A simulated computer is an approximation of a physical computer, and an experiment in a simulated computer is not identical to an experiment on a real computer. This is not a significant difference from experiments on physical computers — since computers are indeterministic, no experiment is identical to another experiment.
From a software quality assurance perspective, it is not important per se whether a simulator provides an accurate model or not. It is important, however, that the conclusions we draw from experiments on simulated computers apply also for execution on physical computers, and that the flaws we hope to find and eliminate can be produced and observed in simulated systems. Whether simulation is a time- and cost-efficient quality assurance method depends on the application and on the type of errors we expect to find.
For purely logical errors that are not timing-dependent, there is little bene-fit of using simulation, but for timing-dependent logical errors, also called race conditions, the benefit of repeatable executions is obvious. A simulated exe-cution does not reproduce an exeexe-cution in a real system; the interleavings of events will be different for a specific experiment in a simulated system compared
with a specific experiment in a real system, just as interleavings are different for two experiments in real systems. In a simulated system, however, a particular experiment can be repeated. Since the simulated timing model is inexact, it is likely that the execution will take different paths than most executions in real systems, resulting in different test coverage. Testing, however, is an ineffec-tive method for finding concurrency errors; the event interleaving coverage that can be achieved during lab testing is small and many race conditions remain in production software. We believe that simulation will be a key technology for addressing the difficult problem of quality assurance for concurrent applica-tions. A simulator user can control the timing model, and by using a stochastic, pseudo-random timing model, more chaotic than real computers, higher inter-leaving coverage can be achieved during testing. This would enable meaningful testing for concurrency errors. Testing with chaotic timing models is a successful technique for ensuring quality in high-end computer hardware, which tends to have a low fault frequency, in spite of abundant concurrency. Holistic debugging is a prerequisite for developing a similar technology for testing software.
5.2
Practical issues
The major challenges in building a holistic debugger are practical in nature. We expected some difficulties when integrating large components in new ways, but we have also encountered some method-related difficulties we did not expect, and will discuss some of them below.
5.2.1 Determinism
A correct complete system simulator is deterministic, and will produce the same execution each time, if the initial state, the machine model, and the input model are fixed. Determining which simulator operations affect the model can some-times be difficult, and we have somesome-times accidental alterations to the simula-tion model. We have addressed this issue by completely automating the build procedure and experiments, hoping to achieve predictable builds from source code. Since our build system includes target programs and cross compilation tools, the source code tree has grown to about a gigabyte, and will increase for each new target architecture. It has not been sufficient to make the build process deterministic, however; indeterministic factors that have little effect on other types of applications, for example compilers ordering routines randomly, cause significant timing differences in simulated execution, which prevent us from repeating scenarios based on the source tree version. We are working on understanding and addressing these indeterministic factors.
5.2.2 Reliability
Nornir is a fragile prototype, not yet fit for production use. The VMT imple-mentation is immature, but out most time-consuming reliability issues relate
to the integration of components. Many software products have flaws in ar-eas that are seldom used, and small component flaws can become major issues when several components are integrated. Quality problems appear not only in our core components, but also in software running in the simulated machines. We recently had to fix a Linux kernel race condition, which occurs more fre-quently on simulated machines than on real machines. On the other hand, it was straightforward to debug, since we could reproduce the error and place write watchpoints on the relevant data structures.
5.3
Simulation performance
One main drawback of running applications in a simulator is that it runs much slower than on a physical machine. Subjectively measured, this simulation over-head has been the limiting performance factor in most of our experiments, and Nornir does not seem to make the simulation significantly slower.
Nornir incurs essentially no overhead, except when the execution reaches a monitored event. Thus, if the user monitors frequent events, the overhead may be high, whereas if monitored events are rare, Nornir runs approximately at simulator speed. The virtual machine translator requires some administrative monitors, e.g. for page table changes, but they rarely trigger under normal load. A more complex virtual machine translator, for example a VMT for Java just-in-time compilers could potentially require a higher overhead.
We have not made any performance measurements; we do not consider it meaningful, since there are many implementation choices that favour simplicity and testability over performance. Nornir development is constrained by com-plexity, and premature performance optimisations at this stage of development would not be sound engineering.
6
Related work
There are many research results that partly overlap with our work, and solve some of the problems we address, but under restricted conditions or in a limited scope. The main difference between our work and earlier approaches is that we aim to address a larger set of fundamental problems at once, without placing strict requirements and assumptions on the software being studied.
There have been other complete system simulators than Simics, simi-lar in design: SimOS [Rosenblum et al., 1995], which is still in use at a few companies, and an older PDP-11 simulator [Doyle and Mandelberg, 1984]. Various research experiments that involve SimOS and Simics illustrate the benefits of complete system simulation for understanding software be-haviour [Alameldeen et al., 2002, Fedorova et al., 2005, Herrod, 1998]. Rosen-blum et al. presented annotations, a method of connecting Tcl scripts to events in the operating system and applications under study. The can be combined hierarchically, and are somewhat similar to eventpoints, but their main purpose is to filter performance data and map it to processes [Rosenblum et al., 1997].
Simics, as shipped by the vendor, has limited support for debugging applications with GDB; it has no virtual machine translator, but can obtain virtual mem-ory translations from the simulated TLB (translation lookaside buffer), which allows interactive debugging under favourable circumstances.
Virtualisation programs, such as Xen [Dragovic et al., 2003], are similar in nature to simulators, but they are generally not isolated from intic input from the outside world, and can therefore not provide determinis-tic execution. Pervasive debugging, a method for determinisdeterminis-tic debugging of distributed applications running in Xen domains [Ho et al., 2004], can be re-garded as a light-weight version of a subset of holistic debugging. Virtualisation achieves much better performance than instruction-set simulation, but provides more limited observability and only supports distributed systems with homo-geneous hardware. Furthermore, a pervasive debugger is focused on interactive debugging of a limited number of similar processes, and provides no support for automation. It does not include an abstraction translation stack, and in-stead requires modifications to the virtual machine of each process being ob-served [Ho, 2005]. This limits its usefulness on production software, and require developers to debug a software system different from the one that end-users run. Many embedded system vendors provide simulators for development and de-bugging [Wind River, ]. Some vendors provide hardware support for recording intermittent failures and replaying them in a simulator [Green Hills Software, ]. Debugging embedded systems with simulators is an easier task than doing so for high-end commodity systems, however; the debuggers typically only need to perform a single symbolic translation, since embedded systems seldom use virtual memory.
Deterministic replay is a popular research technique for repro-ducing intermittent errors [Choi and Zeller, 2002, Tai et al., 1991, LeBlanc and Mellor-Crummey, 1987, Xu et al., 2003, Thane, 2000]. Re-play tools typically require modifications, either to run-time system, operating system, or hardware, and generally require a homogeneous environment.
There is a multitude of other tools, too many to enumerate, for modify-ing distributed programs, run-time systems, or hardware to trace behaviour for debugging or performance analysis. They do not achieve reproducible ex-periments, however. There are literature surveys on techniques and problems related to tracing and debugging concurrent programs, covering most such tools [McDowell and Helmbold, 1989, Huselius, 2002, Schutz, 1993].
There are also some tools that attempt to raise the debugging abstrac-tion level, either by understanding high-level abstracabstrac-tions, or allowing the user to program the debugger [Aral and Gertner, 1988, Golan and Hanson, 1993, Hanson and Korn, 1997, Winterbottom, 1994]. Event-Based Behavioral Ab-straction (EBBA) [Bates, 1995] is an approach for describing high-level events by aggregating low-level events, similarly to eventpoints, but more formal.
Many earlier attempts at creating tools for studying complex software illus-trates the difficulties involved in building scalable tools for distributed systems. The Paradyn tools [Hollingsworth, 1994] evaluate multiple hypotheses on bot-tlenecks in a parallel program in order to determine the factors limiting
perfor-mance in an application, using an intricate instrumentation strategy in order to minimise probe effect.
There are research projects that attempt to compensate for incomplete causal ordering and track causal path behaviour by statistical inference in or-der to do performance debugging of distributed systems [Aguilera et al., 2003, Chen et al., 2003, Barham et al., 2004].
7
Conclusions
We present holistic debugging, a robust platform for building new, scalable and robust tools that can inspect all state in a distributed software system, and that does not suffer from probe effect and nonrepeatability. We show how a holistic debugger can be constructed from a complete system simulator and stacked abstraction translators that map low-level simulator data to high-level program information. We present the debugger shepherd concept, a programmable and extensible environment that can observe distributed state in the system. We have created Nornir, a prototype holistic debugger implementation, built with the complete system simulator Simics, the GNU debugger, a virtual machine translator for Linux, and a debugger shepherd implementation.
Holistic debugging is a new method for building tools. It has some major benefits, but also a set of disadvantages, some of which may be inherent, and others addressed with time, if holistic debugging becomes an accepted method. The set of benefits and disadvantages, however, is radically different from ex-isting methods. Unlike alternative approaches, holistic debugging assumes very few properties of the software being inspected. We believe that it is an im-portant key for solving several problems that the computer science community have researched for decades, without producing widely accepted solutions, for example distributed system debugging, testing for concurrency errors, and per-formance profiling for distributed systems. We believe that some day, it will be natural for software developers to test software in simulated computers, write debugging and white-box test routines that are reused by their colleagues and customers, use chaotic timing and fault-injection models that stress their soft-ware more than can be done today, and that these factors enable them to build larger software products of higher quality than is possible today. That day is still far into the future, but our work is a step in that direction.
References
[Aguilera et al., 2003] Aguilera, M. K., Mogul, J. C., Wiener, J. L., Reynolds, P., and Muthitacharoen, A. (2003). Performance debugging for distributed systems of black boxes. In SOSP, pages 74–89.
[Alameldeen et al., 2002] Alameldeen, A., Mauer, C., Xu, M., Harper, P., Martin, M., Sorin, D., Hill, M., and Wood, D. (2002). Evaluating
non-deterministic multi-threaded commercial workloads. In 5th Workshop on Computer Architecture Evaluation using Commercial Workloads.
[Albertsson, 2002] Albertsson, L. (2002). Temporal debugging and profiling of multimedia applications. In Multimedia Computing and Networking 2002, Proceedings of SPIE, pages 196–207.
[Aral and Gertner, 1988] Aral, Z. and Gertner, I. (1988). High-level debugging in parasight. In Workshop on Parallel and Distributed Debugging, pages 151– 162.
[Barham et al., 2004] Barham, P. T., Donnelly, A., Isaacs, R., and Mortier, R. (2004). Using Magpie for request extraction and workload modelling. In OSDI, pages 259–272.
[Bates, 1995] Bates, P. C. (1995). Debugging heterogeneous distributed systems using event-based models of behavior. ACM Trans. Comput. Syst., 13(1):1– 31.
[Chen et al., 2003] Chen, M., Kiciman, E., Accardi, A., Fox, A., and Brewer, E. (2003). Using runtime paths for macro analysis.
[Choi and Zeller, 2002] Choi, J.-D. and Zeller, A. (2002). Isolating failure-inducing thread schedules. In Proceedings of the International Symposium on Software Testing and Analysis, Rome, Italy.
[Doyle and Mandelberg, 1984] Doyle, J. K. and Mandelberg, K. I. (1984). A portable PDP-11 simulator. Software Practice and Experience, 14(11):1047– 1059.
[Dragovic et al., 2003] Dragovic, B., Fraser, K., Hand, S., Harris, T., Ho, A., Pratt, I., Warfield, A., Barham, P., and Neugebauer, R. (2003). Xen and the art of virtualization. In Proceedings of the ACM Symposium on Operating Systems Principles.
[Ekman, 2004] Ekman, M. (2004). Strategies to Reduce Energy and Resources in Chip Multiprocessor Systems. PhD thesis, Chalmers University of Technology. [Fedorova et al., 2005] Fedorova, A., Seltzer, M., Small, C., and Nussbaum, D. (2005). Performance of multithreaded chip multiprocessors and implications for operating system design. In Proceedings of the Usenix 2005 Annual Tech-nical Conference, Anaheim, CA.
[Foundation, ] Foundation, A. S. Apache portable runtime project. http://apr.apache.org/.
[Gait, 1985] Gait, J. (1985). A debugger for concurrent programs. Software Practice and Experience, 15(6):539–554.
[Gibson et al., 2000] Gibson, J., Kunz, R., Ofelt, D., Horowitz, M., and Hen-nessy, J. (2000). FLASH vs. (simulated) FLASH: Closing the simulation loop. In Proceedings of the 9th International Conference on Architectural Support for Programming Languages and Operating Systems (ASPLOS), pages 49–58. ACM.
[Golan and Hanson, 1993] Golan, M. and Hanson, D. R. (1993). DUEL - a very high-level debugging language. In USENIX Winter, pages 107–118.
[Green Hills Software, ] Green Hills Software. Green Hills Software. http://www.ghs.com/.
[Hanson and Korn, 1997] Hanson, D. R. and Korn, J. L. (1997). A simple and extensible graphical debugger. In USENIX, editor, Proceedings of the USENIX 1997 annual Technical Conference, January 6–10, 1997, Anaheim, California, USA, pages 173–184, Berkeley, CA, USA. USENIX.
[Herrod, 1998] Herrod, S. A. (1998). Using Complete Machine Simulation to Understand Computer System Behavior. PhD thesis, Stanford University. [Ho, 2005] Ho, A. (2005). Personal communication.
[Ho et al., 2004] Ho, A., Hand, S., and Harris, T. (2004). PDB: Pervasive de-bugging with Xen. In Proceedings of the 5th IEEE/ACM International Work-shop on Grid Computing (Grid 2004).
[Hollingsworth, 1994] Hollingsworth, J. K. (1994). Finding Bottlenecks in Large Scale Parallel Programs. PhD thesis, Computer Sciences Department, Uni-versity of Wisconsin – Madison.
[Huselius, 2002] Huselius, J. (2002). Debugging Parallel Systems: A State of the Art Report. Technical Report 63, M¨alardalen University, Department of Computer Science and Engineering.
[Jones, 1998] Jones, T. C. (1998). Estimating software costs. McGraw-Hill, Inc., Hightstown, NJ, USA.
[Lamport, 1978] Lamport, L. (1978). Time, clocks, and the ordering of events in a distributed system. Communications of the ACM, 21(7):558–565. [LeBlanc and Mellor-Crummey, 1987] LeBlanc, T. J. and Mellor-Crummey,
J. M. (1987). Debugging parallel programs with instant replay. IEEE Trans-actions on Computers, C-36(4):471–482.
[Magnusson et al., 2000] Magnusson, P. S., Christensson, M., Eskilson, J., Fors-gren, D., H˚allberg, G., H¨ogberg, J., Larsson, F., Moestedt, A., and Werner, B. (2000). Simics: A full system simulation platform. IEEE Computer. [McDowell and Helmbold, 1989] McDowell, C. E. and Helmbold, D. P. (1989).
[Rosenblum et al., 1997] Rosenblum, M., Bugnion, E., Devine, S., and Herrod, S. A. (1997). Using the SimOS machine simulator to study complex computer systems. ACM Transactions on Modeling and Computer Simulation, 7(1):78– 103.
[Rosenblum et al., 1995] Rosenblum, M., Herrod, S. A., Witchel, E., and Gupta, A. (1995). Complete computer system simulation: The SimOS ap-proach. IEEE parallel and distributed technology: systems and applications, 3(4):34–43.
[Schutz, 1993] Schutz, W. (1993). The Testability of Distributed Real-Time Sys-tems. Kluwer Academic Publishers, Norwell, MA, USA.
[Subversion, ] Subversion. Subversion. http://subversion.tigris.org/.
[Tai et al., 1991] Tai, K.-C., Carver, R. H., and Obaid, E. E. (1991). Debugging concurrent Ada programs by deterministic execution. IEEE Transactions on Software Engineering, 17(1):45–63.
[Tanenbaum, 1992] Tanenbaum, A. (1992). Modern Operating Systems. Pren-tice Hall.
[Thane, 2000] Thane, H. (2000). Monitoring, Testing and Debugging of Dis-tributed Real-Time Systems. PhD thesis, Royal Institute of Technology (KTH).
[Wind River, ] Wind River. Wind River. http://www.windriver.com.
[Winterbottom, 1994] Winterbottom, P. (1994). ACID: A debugger built from A language. In USENIX Winter, pages 211–222.
[Xu et al., 2003] Xu, M., Bodik, R., and Hill, M. D. (2003). A ”flight data recorder” for enabling full-system multiprocessor deterministic replay. In Pro-ceedings of the International Symposium on Computer Architecture.
import nornir lockHolder = None idsUsed = [] def serverMonitor(): ev = nornir.waitFor([ExecFileEvent(’apr_test_server’)]) serverPid = ev.pid while True: ev = waitFor([CloneEvent(serverPid), ProcessExitEvent(serverPid)]) if ev.__class__ == ProcessExitEvent: return
nornir.createMonitorThread(serverThreadMonitor, args = ev.pid) def serverThreadMonitor(pid):
debugger = nornir.attach(pid) waitFor([debugger.breakpoint(
’apr_file_lock’, line = ’return APR_SUCCESS;’)]) assert(lockHolder is None)
lockHolder = pid
waitFor([debugger.breakpoint(
’apr_file_unlock’, line = ’return APR_SUCCESS;’)]) assert(lockHolder == pid)
lockHolder = None def clientMonitor(pid):
debugger = nornir.attach(pid)
waitFor([debugger.breakpoint(’receiveId’, line = ’return id;’)]) id = debugger.readVar(’id’); assert(not id in idsUsed) idsUsed.append(id) def monitorAprScenario(): nornir.createMonitorThread(serverMonitor) while True: ev = waitFor([ExecFileEvent(’apr_test_client’)])
nornir.createMonitorThread(clientMonitor, args = ev.pid) monitorAprScenario()