Sara Nygårdhs Carina Fors Lars Eriksson
Lena Nilsson
Field test on visibility at cycle crossings at night
VTI rapport 691A Published 2010
Publisher: Publication:
VTI rapport 691A
Published: 2010 Project code: 40755 Dnr: 2007/0618-26
SE-581 95 Linköping Sweden Project:
Road user support in night-time traffic
Author: Sponsor:
Sara Nygårdhs, Carina Fors, Lars Eriksson and Lena Nilsson
Swedish Road Administration
Title:
Field test on visibility at cycle crossings at night
Abstract (background, aim, method, result) max 200 words:
This report describes a field study which is part of the project "Road user support in night-time traffic". The first steps in the project were a literature review on night-time traffic in urban areas and a focus group study where road users’ needs and experiences of night-time traffic in urban areas were discussed. The aim of the field study was to compare the night-time visibility distance of cycle crossings to the night-time visibility distance of bicyclists at the corresponding cycle crossings. This was tested both for dry and wet road surface.
Twelve volunteers participated in the study; six at dry road surface and six at wet road surface condi-tions. They sat as passengers in an instrumented car at night travelling along a test route including a total of 19 cycle crossings. The participants indicated when they noticed bicyclists (stationary dummies) and cycle crossings along the test route, and the visibility distance was registered and stored.
The main result of the study was that the bicyclist dummy was always seen at longer distances than the cycle crossing.
Keywords:
Visibility, cycle crossing, night-time
ISSN: Language: No. of pages:
Utgivare: Publikation:
VTI rapport 691A
Utgivningsår: 2010 Projektnummer: 40755 Dnr: 2007/0618-26 581 95 Linköping Projektnamn: Trafikantstöd i mörkertrafik Författare: Uppdragsgivare:
Sara Nygårdhs, Carina Fors, Lars Eriksson och Lena Nilsson
Vägverket
Titel:
Fältstudie på synbarhet vid cykelöverfarter i mörker
Referat (bakgrund, syfte, metod, resultat) max 200 ord:
Denna rapport utgör dokumentation av en fältstudie som är en del i projektet "Trafikantstöd i mörker-trafik". De första delarna i projektet var en litteraturstudie om mörkertrafik i tätort samt en fokusgrupps-studie där olika trafikantgruppers behov och upplevelser av mörkertrafik i tätort diskuterades.
Syftet med fältstudien var att i mörker jämföra synavståndet till cykelöverfarter med synavståndet till cyklister vid motsvarande cykelöverfarter. Detta studerades både vid torr och vid våt vägyta.
Tolv försökspersoner deltog i studien; sex vid torra och sex vid våta vägyteförhållanden. De satt som passagerare i en instrumenterad bil på natten och åkte längs en testrutt som omfattade totalt 19 cykel-överfarter. Försökspersonerna indikerade när de upptäckte cyklister (stationära attrapper) och cykelöver-farter längs testrutten, varvid synavståndet registrerades och sparades.
Huvudresultatet av studien var att cyklistattrappen alltid syntes på längre avstånd än cykelöverfarten.
Nyckelord:
Preface
This report describes the results of the first part of the third step in a three-step project called “Road user support in night-time traffic”, which has been financed by the
Swedish Road Administration. The first step was a literature review and the second step was a focus group study. In the third step road users’ behaviour and experiences in relation to alternative designs of road equipment are investigated. This report describes the results of a field test on visibility at cycle crossings.
Stefan Svensson and Rolf Gillberg, VTI, created the bicyclist dummies. Carina Fors, Sara Nygårdhs, Lars Eriksson, Harry Sörensen, Sven-Olof Lundkvist and Lena Nilsson from VTI all contributed to the planning and carrying out of the study. Sven-Olof Lundkvist, Lars Eriksson, Carina Fors and Sara Nygårdhs analysed the data and the latter has also written this report. Lena Nilsson has been the project leader. Peter Aalto has been the contact person at the Swedish Road Administration.
Linköping October 2010
Quality review
Review seminar was carried out on 20 April 2010 where researcher Åsa Forsman reviewed and commented on the report. Sara Nygårdhs has made alterations to the final manuscript of the report 17 June 2010. The project manager Lena Nilsson examined the report on 29 September 2010, which led to further adjustments on 6 October 2010. The research director Jan Andersson examined and approved the report for publication on 7 October 2010.
Kvalitetsgranskning
Granskningsseminarium genomfört 2010-04-20 där forskare Åsa Forsman var lektör. Sara Nygårdhs har genomfört justeringar av slutligt rapportmanus 2010-06-17. Projektledare Lena Nilsson har därefter granskat rapporten 2010-09-29 vilket lett till ytterligare justeringar 2010-10-06. Forskningschef Jan Andersson har därefter granskat och godkänt publikationen för publicering 2010-10-07.
Table of contents
Summary ... 5 Sammanfattning ... 7 1 Introduction ... 9 1.1 Background ... 9 1.2 Aim ... 91.3 Cycle crossings in Sweden ... 9
2 Method ... 11 2.1 Participants ... 11 2.2 Procedure ... 11 2.3 Design... 12 2.4 Instrumented car ... 13 2.5 Measures ... 14 2.6 Setting... 16 3 Results ... 17
3.1 Visibility of bicyclist dummy ... 17
3.2 Visibility of cycle crossing ... 18
3.3 Visibility of bicyclist dummy compared to that of the cycle crossing ... 19
4 Discussion ... 21 4.1 Results ... 21 4.2 Method ... 22 5 Future research ... 24 6 References ... 25 Appendices
Appendix A1 – Instructions for part I Appendix A2 – Instructions for part II Appendix B – Photos
Appendix C – Field test loop Appendix D – Test results
Appendix E – Measurement results of lighting and road surface parameters Appendix F – Analyses
Field test on visibility at cycle crossings at night
by Sara Nygårdhs, Carina Fors, Lars Eriksson & Lena Nilsson VTI (Swedish National Road and Transport Research Institute) SE–581 95 Linköping Sweden
Summary
This report describes a field study which is part of the project “Road user support in night-time traffic”. The first steps in the project were a literature review on night-time traffic in urban areas and a focus group study where road users’ needs and experiences of night-time traffic in urban areas were discussed.
The aim of the field study was to compare the night-time visibility distance of cycle crossings to the night-time visibility distance of bicyclists at the corresponding cycle crossings. This was tested both for dry and wet road surface.
Twelve volunteers participated in the study; six at dry road surface and six at wet road surface conditions. They sat as passengers in an instrumented car at night travelling along a test route including a total of 19 cycle crossings. The participants indicated when they noticed bicyclists (stationary dummies) and cycle crossings along the test route, and the visibility distance was registered and stored.
Physical parameters measured in the field study were illuminance, daylight luminance coefficient and retroreflectivity. From these measures the contrast between the road surface and marking was calculated, as well as the difference between the illumination at the front and at the back of the bicyclist dummy.
The main result of the study was that the bicyclist dummy was always seen at longer distances than the cycle crossing. However, the difference in detection distance with and without the bicyclist dummy varies over crossings. Only weak correlations between physical parameters and visibility could be shown. The results are the same both at dry and wet road surface.
Fältstudie på synbarhet vid cykelöverfarter i mörker
av Sara Nygårdhs, Carina Fors, Lars Eriksson & Lena Nilsson VTI
581 95 Linköping
Sammanfattning
Denna rapport utgör dokumentation av en fältstudie som är en del i projektet Trafikantstöd i mörkertrafik. De första delarna i projektet var en litteraturstudie om mörkertrafik i tätort samt en fokusgruppsstudie där olika trafikantgruppers behov och upplevelser av mörkertrafik i tätort diskuterades.
Syftet med fältstudien var att i mörker jämföra synavståndet till cykelöverfarter med synavståndet till cyklister vid motsvarande cykelöverfarter. Detta studerades både vid torr och vid våt vägyta.
Tolv försökspersoner deltog i studien; sex vid torra och sex vid våta vägyteförhållanden. De satt som passagerare i en instrumenterad bil på natten och åkte längs en testrutt som omfattade totalt 19 cykelöverfarter. Försökspersonerna indikerade när de upptäckte cyklister (stationära attrapper) och cykelöverfarter längs testrutten, varvid synavståndet registrerades och sparades.
De fysikaliska parametrarna belysningsstyrka, luminanskoefficient och retroreflexion mättes i fältstudien. Från dessa parametrar beräknades kontrasten mellan vägyta och vägmarkering samt skillnaden i belysningsstyrka mot framsidan och baksidan av cyklistattrappen.
Huvudresultatet av studien var att cyklistattrappen alltid syntes på längre avstånd än cykelöverfarten. Skillnaden i synavstånd med och utan cyklistattrapp varierade dock mellan cykelöverfarterna. Endast svaga korrelationer mellan fysikaliska parametrar och synavstånd kunde påvisas. Resultaten är desamma både vid torr och vid våt vägyta.
1 Introduction
The project ”Road user support in night-time traffic” aims at making an integrated effort concerning night-time traffic from the perspective of interaction between road users and traffic. The purpose is to improve safety and accessibility in road traffic. The project focuses on urban areas and is separated into three steps. The first step was a literature review (Fors & Lundkvist, 2009). The second step was a focus group study where road users’ needs and experiences of night-time traffic in urban areas were discussed (Fors & Nygårdhs, 2010). The third step is meant to investigate road users’ behaviour and experiences in relation to alternative designs of road equipment. The first part of the third step is the field study reported here.
1.1 Background
In the literature study, it was seen that very little research on bicyclists in night-time traffic has been reported during the years 1998-2008, which was the time limit for the literature review. Only two studies were of interest, dealing with lighting and reflector tags on bicycles.
From the results of the focus group study, it was observed that bicyclists and older pedestrians as well as older drivers found that visibility of bicyclists and cycle crossings is poor.
A proposal from the Swedish Transport Agency in October 2009 (Transportstyrelsen, 2009), suggests that car drivers should have a duty to give way for bicyclists at cycle crossings. Also, the cycle crossings must either be controlled (through signals) or be designed in such a way that the speed of the vehicles at the crossings does not exceed 30 km/h. In the proposal, there were also some drafts for a cycle crossing sign. If the proposal from the Swedish Transport Agency leads to rules and regulations, it is
important that the bicyclists can be seen by the drivers in time for them to stop. A cycle crossing should help the driver to expect that a bicyclist may possibly cross the road. In conclusion, the literature study, the focus groups and the proposal from the Swedish Transport Agency all pointed out that it was of interest to study the visibility of cycle crossings and bicyclists at cycle crossings.
1.2 Aim
The aim of the field study was to compare the night-time visibility distance of cycle crossings to the night-time visibility distance of bicyclists at the corresponding cycle crossings. Comparisons were made both for dry and wet road surface, respectively.
1.3
Cycle crossings in Sweden
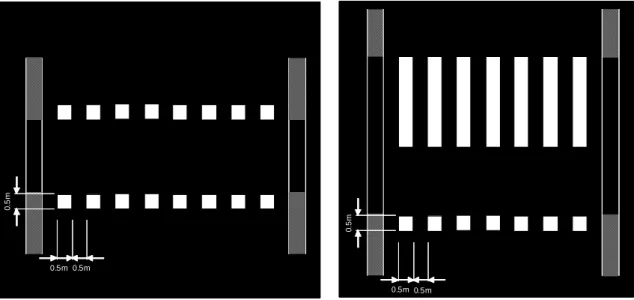
The present Swedish recommendations on road design, VGU (Vägverket & Svenska Kommunförbundet, 2004), state that a cycle crossing can be marked on a place meant to be used by bicyclists or moped riders (riding a moped class II) to cross a road or a cycleway. The Swedish cycle crossing is designed with white road markings in the form of squares with each side 0.5 m long. The basic design is shown in Figure 1 left. The cycle crossing can be combined with a pedestrian crossing as shown in Figure 1 right.
0.5m 0.5m 0. 5 m 0.5m 0.5m 0. 5 m 0.5m 0.5m 0. 5 m 0.5m 0.5m 0. 5 m 0.5m 0.5m 0. 5 m 0.5m 0.5m 0. 5 m
Figure 1 Examples of cycle crossing road marking. Left: Basic design of a cycle crossing. Right: A cycle crossing combined with a pedestrian crossing.
2 Method
2.1 Participants
Twelve participants, six males and six females, were engaged in the study. Nine of them were recruited from a VTI database of volunteers and three through personal contacts with people at VTI. All of the participants had a driver’s license and with the exception of sporadic visits, none of them were familiar with the city of Norrköping, where the study was carried out. Their ages ranged from 26 to 57 years. The participants were paid 750 SEK for their participation.
2.2 Procedure
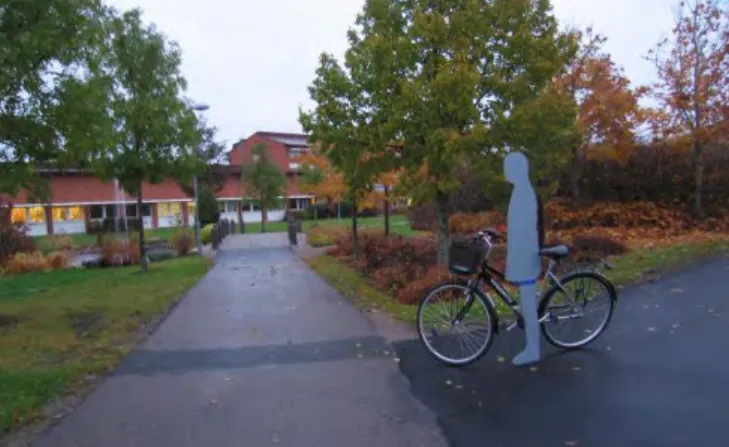
The participants were passengers in an instrumented car driven along a pre-defined test route. The experiment was separated into two parts. In the first part, the participants’ task was to push a noiseless button when they saw a dummy bicyclist at a crossing, waiting to pass the road (see Figure 2). A written instruction was handed out to the participants before this first part, instructing them to look for bicyclist dummies (see Appendix A1 – Instructions for part I). They were also orally briefed about the task and directed to test the push-button to see how it worked. Furthermore, the driver of the instrumented car had a push-button which was used for registering the time of pass of the cycle crossing.
Figure 2 A dummy bicyclist at a cycle crossing.
When the first part of the experiment was completed, the bicyclist dummies were removed. In the second part of the experiment, the participants’ task was to push the button when they were certain that they were about to pass a cycle crossing. They were given another written instruction (see Appendix A2 – Instructions for part II) showing them how a cycle crossing is supposed to look and telling them that there was an extra reward if they pushed the button only at cycle crossings (i.e. when they saw the road
marking squares) and did not miss any cycle crossing. The bicyclist dummies in the first part were placed at exactly the same cycle crossings used in the second part, but this was not known by the participants.
For the purpose of creating the bicyclist dummies, ten identical dummy persons had been produced based on a silhouette of an outdoor-dressed person and painted in matt grey colour with a luminance factor of 0.28. The dummies were 170 cm high, 37 cm wide at the widest part and 1 cm thick. The silhouette of the dummy person is shown in Figure 3.
Figure 3 Dummy person used in the field test.
In the experiment, each dummy was attached to a bicycle. The bicycles differed in height, colour and shape, but most of them were dark. The reflection tags of the bicycles were concealed with blue tape. The dummies were placed on the ground next to the bicycles and were attached to the bicycles by thin black cable ties. Photos of the bicyclist dummies at the cycle crossings are found in Appendix B – Photos.
2.3 Design
The field tests were carried out in one week at the end of October 2009. The wet road surface tests were performed on the night between the 26th and the 27th of October and the dry road surface tests were performed on the night between the 28th and the 29th of October. Because the field study had to be carried out in darkness, and the surrounding traffic should be kept to a minimum, the experiment started after 11 pm at night and was finished before 5 am in the morning.
Three males and three females participated in the tests when the road surface was dry and another group of three males and three females participated in the tests at night when the road surface was wet. However, no tests were carried out during rain so the windscreen wipers were not used. The participants individually had the same position in the car, i.e. they were passengers in the front seat, centre rear seat or right rear seat in every run. Table 1 shows a schedule of the runs in the wet and dry road tests.
Table 1 Order of the runs. Women = a participant group of three women. Men = a participant group of three men.
Group Run no.
Subgroup Starting position
Direction Target
Wet road surface
1 Women I A Counter-clockwise Bicyclist dummy 2 Men I A Counter-clockwise Bicyclist dummy 3 Women I B Clockwise Bicyclist dummy 4 Men I B Clockwise Bicyclist dummy 5 Women I B Counter-clockwise Cycle crossing 6 Men I B Counter-clockwise Cycle crossing 7 Women I A Clockwise Cycle crossing
8 Men I A Clockwise Cycle crossing
Dry road surface
3 Women II B Clockwise Bicyclist dummy 4 Men II B Clockwise Bicyclist dummy 5 Women II B Counter-clockwise Cycle crossing 6 Men II B Counter-clockwise Cycle crossing 7 Women II A Clockwise Cycle crossing 8 Men II A Clockwise Cycle crossing
A single participant was only tested once in the same condition, i.e. there was no repeti-tion. The starting positions and the direction of the runs were altered. Note that runs no. 1 and 2 were only carried out when the road surface was wet. The crossings in the clockwise and counter-clockwise direction are considered as separate crossings due to the fact that only one of the cycle crossings could be used in both directions (crossing 58 is the opposite of crossing 78, separated with a small traffic island) and that for this crossing, the order of the cycle crossing and the pedestrian crossing was altered.
2.4 Instrumented
car
The car used in the field test was a Volvo 855 with logging equipment. Four noiseless push-buttons were linked to a computer. The computer registered the exact time for each push-button being pushed down. Vehicle speed was also logged and thereby the distance travelled between the two buttons being pushed down (i.e. a participant’s and the driver’s) could be computed.
2.5 Measures
The measures collected in the field study were: Visibility distance, s [m]
Illuminance, E [lx]
Daylight luminance coefficient, Qd [mcd/m2
/lx]
Retroreflectivity, RL [mcd/m2/lx].
Measures calculated from the collected field measures were: Contrast, C [1]
Illumination difference, ΔE [lx].
Visibility distance, s, was measured as follows: Each participant pushed their button when he or she noticed the bicyclist dummy or the cycle crossing (depending on if it was the first or the second part of the test). Whenever the instrumented car crossed a cycle crossing correctly marked with squares, the driver of the car pushed his button. In this way, the time Δt between that each participant noticed the cycle crossing or
bicyclist dummy and that the car actually came to the crossing was registered. Using the measured vehicle speed, v, the visibility distance, s vt, was calculated and stored. Illuminance, E, is the total luminous flux incident on a surface per unit area. A lux meter was used for measuring illuminance in eight measurement positions on the road markings and the road surface (see Figure 4). Additionally, the perpendicular
illuminance at the dummy bicyclist’s head was measured both at the front side (visible from the direction of travel), Efront, and at the back side (not visible from the direction of
travel), Eback.
Daylight luminance coefficient, Qd, is a measure used for describing the reflection properties of a road marking or a road surface in road lighting. Qd was measured with a reflectometer in the positions shown in Figure 4.
Retroreflectivity, RL, is another physical measure that describes the performance of a
road marking or a road surface in headlight illumination. It was measured with a
retrometer in the positions shown in Figure 4. The hypothesis for measuring RL is that if
the illuminance is very low, the vehicle headlights will influence visibility of the cycle crossing.
5 6 1 2 7 8 3 4 Direction of travel Direction of travel 5 6 1 2 7 8 3 4 Direction of travel Direction of travel
Figure 4 Positions for E, Qd and RL measurements on the road surface and road
markings at the cycle crossing and the pedestrian crossing. The measurement positions are marked with red dots. (Observe that the figure pictures measurement positions for two crossings; one where the pedestrian crossing comes first and the other where the cycle crossing comes first.)
The results of the visibility measurements are given in Appendix D – Test results, whereas the results of the physical measurements of E, Qd and RL are given in
Appendix E – Measurement results of lighting and road surface parameters. The illumination difference between the perpendicular illuminance at the dummy bicyclist’s head at the front side and at the back side, ΔE, is relevant for the visibility of the bicyclist dummy and was calculated as:
back front E E
E
.
The contrast, C, is relevant for the visibility of the cycle crossing. Let indices 1-4 denote
the measurement positions as illustrated in Figure 4 and let L be the luminance. Then E1
denotes the measured illumination at measurement position 1, etc. The contrast, C, was
calculated as: e roadsurfac e roadsurfac g roadmarkin L L L C , where 2 3 3 1 1 E Qd E Qd Lroadsurface i and 2 4 4 2 2 E Qd E Qd Lroadmarking . i
At one cycle crossing (no. 77) there was no road marking at the measurement position 4. Therefore, only the measurement positions with indices 1 and 2 were used.
2.6 Setting
A test route including many cycle crossings was chosen in Norrköping city, see Appendix C – Field test loop. Cycle crossings at exits of a roundabout were excluded, resulting in a total of ten cycle crossings clockwise and ten cycle crossings counter-clockwise in the loop. All of them were combined with pedestrian crossings. However, not all pedestrian crossings in the loop had a cycle crossing next to it. The cycle
crossings clockwise were assigned the numbers 50–59, whereas the cycle crossings counter-clockwise were assigned numbers in the range of 70–79.
3 Results
Mean values of visibility distances at the different crossings are shown for dry and wet road surface, respectively, in Figure 5 and Figure 6. Section 3.1 shows the visibility of the bicyclist dummy, whereas section 3.2 deals with the visibility of the cycle crossing. In section 3.3 a comparison between the visibility of the bicyclist dummies and the visibility of the cycle crossings is made. Appendix D – Test results, gives the number of useable data for each test condition.
3.1
Visibility of bicyclist dummy
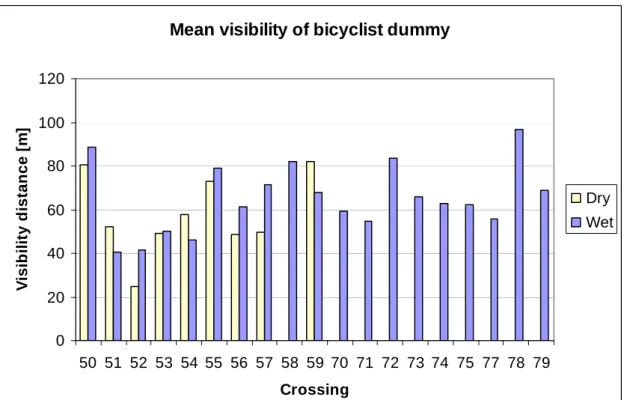
The mean value of the visibility distance to the bicyclist dummy for each crossing measured at dry and wet road surface, respectively, is shown in Figure 5. Note that for the dry road surface condition there were only bicyclist dummies at the clockwise crossings 50–57 and 59 (the bicyclist dummy had been removed by the public at crossing number 58).
Mean visibility of bicyclist dummy
0 20 40 60 80 100 120 50 51 52 53 54 55 56 57 58 59 70 71 72 73 74 75 77 78 79 Crossing V is ib ilit y d is ta n c e [ m ] Dry Wet
Figure 5 Mean visibility distances to the bicyclist dummies at dry and wet road surface.
The wet and dry road surface conditions were analysed separately with one-way analyses of variance (ANOVA).
3.1.1 Dry road surface
A one-way ANOVA of the dry road surface condition with dependent variable visibility of bicyclist dummy measured for every participant and independent variable crossing
was carried out. In Appendix F – Analyses, a full table of the ANOVA is given. The ANOVA showed an effect of crossing, F(8,45) = 3.481, p<.01.
The difference between the illumination measured at the front and at the back of the bicyclist dummy (ΔE) was compared to the visibility distance of the bicyclist dummy in
the dry road surface condition. No significant correlation between ΔE and the visibility
distance of the bicyclist dummy could be shown.
3.1.2 Wet road surface
The analysis for the wet road surface condition was a one-way ANOVA with dependent variable visibility of bicyclist dummy measured for every participant and independent
variable crossing. (See Appendix F – Analyses for the full ANOVA.) No significant
differences of visibility distance to the bicyclist dummy could be shown;
F(18,86) = 1.24, p = 0.248.
A comparison between the visibility distance of the bicyclist dummy in the wet road surface condition and ΔE was made for each participant individually. With respect
given to mass significance, the correlation was significant for two persons but the variance could only be explained by ΔE to 31% and 32%, respectively.
3.2
Visibility of cycle crossing
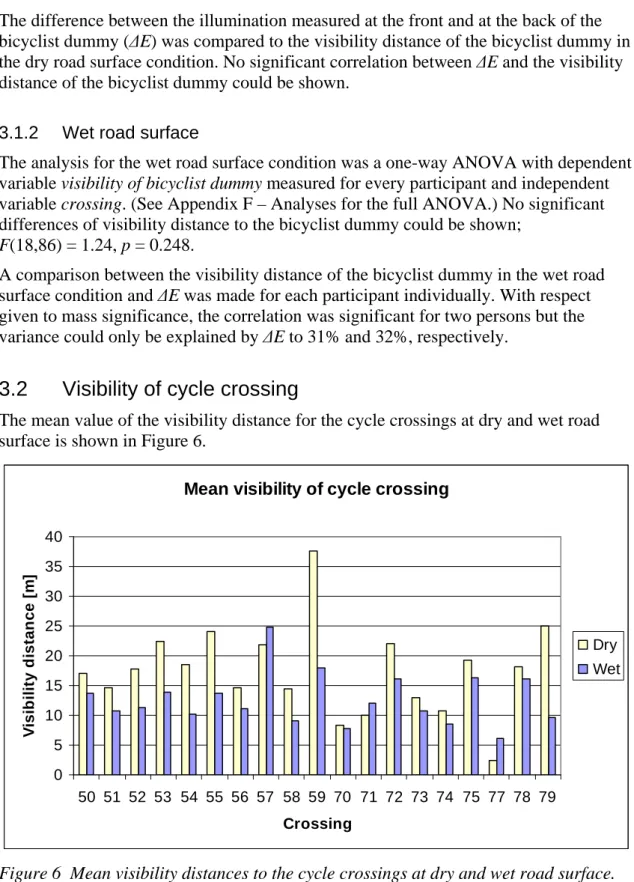
The mean value of the visibility distance for the cycle crossings at dry and wet road surface is shown in Figure 6.
Mean visibility of cycle crossing
0 5 10 15 20 25 30 35 40 50 51 52 53 54 55 56 57 58 59 70 71 72 73 74 75 77 78 79 Crossing V is ib ilit y d is ta n c e [ m ] Dry Wet
Figure 6 Mean visibility distances to the cycle crossings at dry and wet road surface.
Separate one-way analyses of variance were carried out for the dry and wet road surface condition, respectively. In each ANOVA the dependent variable was visibility of cycle crossing for every participant and the independent variable was crossing. Appendix F – Analyses gives the full ANOVA tables for each condition.
3.2.1 Dry road surface
For dry road surface, there were significant differences between the crossings:
F(18,87) = 4.07, p<.0001.
The mean contrast at the cycle crossing (C) was compared to the visibility distance of
the cycle crossing in the dry road surface condition. No significant correlation between the contrast C and the visibility of the cycle crossing could be shown.
No significant correlation between the mean retroreflectivity of the road markings at the cycle crossing and the visibility of the cycle crossing could be shown. Additionally, no significant correlation between the retroreflectivity of the road surface at the cycle crossing and the visibility of the cycle crossing could be shown.
3.2.2 Wet road surface
The wet road surface condition showed significant differences between the crossings:
F(18,92) = 2.45, p<.01.
The mean contrast at the cycle crossing (C) was compared to the visibility distance of
the cycle crossing in the wet road surface condition. For one person, the correlation was significant but the variance could only be explained by C to 36%.
There was a significant correlation between the mean retroreflectivity of the road surface at the cycle crossing and the visibility of the cycle crossing. However, the variance could only be explained by the mean retroreflectivity of the road surface to 4%. No significant correlation between the road markings at the cycle crossing and the visibility of the cycle crossing could be shown.
3.3
Visibility of bicyclist dummy compared to that of the cycle
crossing
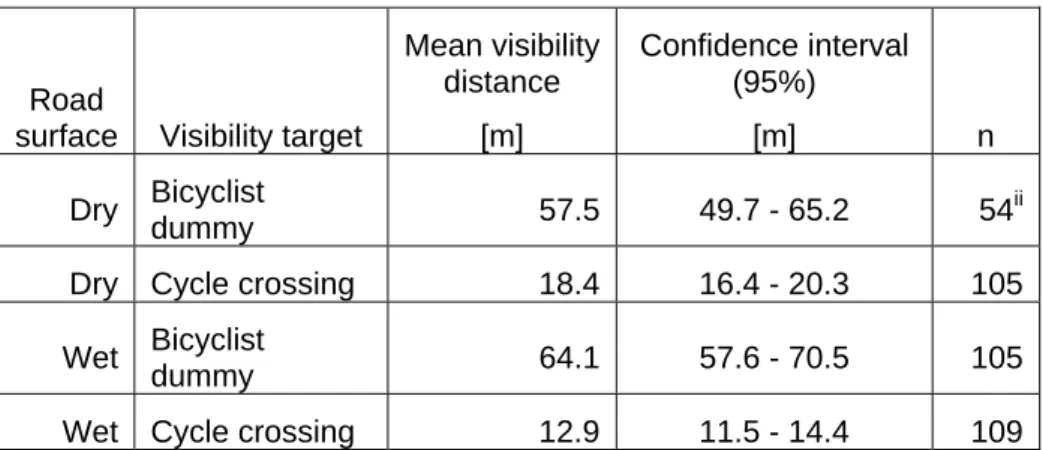
The mean value and confidence interval of visibility distance of the bicyclist dummy and the cycle crossing at dry and wet road surface, respectively, are shown in Table 2.
Table 2 Mean visibility distance, 95% confidence interval and number of observations for dry and wet road surface and bicyclist dummies and cycle crossings, respectively.
Road
surface Visibility target
Mean visibility distance [m] Confidence interval (95%) [m] n Dry Bicyclist dummy 57.5 49.7 - 65.2 54 ii
Dry Cycle crossing 18.4 16.4 - 20.3 105
Wet Bicyclist
dummy 64.1 57.6 - 70.5 105
Wet Cycle crossing 12.9 11.5 - 14.4 109
ii
Table 2 shows the results for all of the collected data for each condition. Since the table is not complete, i.e. the number of observations varied, no meaningful comparisons of data can be made directly from these figures. Despite this, the table may imply that the bicyclist dummy was visible at a distance of about 60 m, irrespective of weather, and that the cycle crossing was visible at a longer distance in the dry road surface condition than in the wet road surface condition. It is also indicated that the bicyclist dummy is visible at longer distances than the cycle crossing, both at wet and dry road surface. To find out if these implications are true, the following analysis was made.
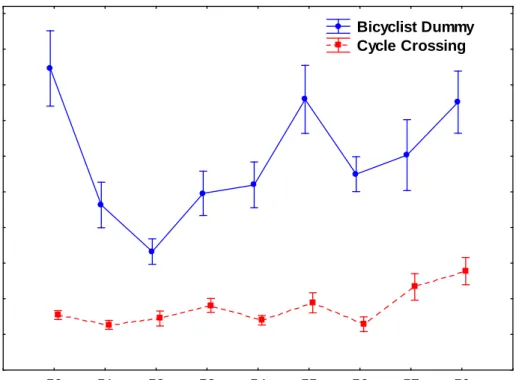
An ANOVA was conducted with a mixed design of group (2) × target (2) × crossing (9). The between-subjects factor was the two groups performing their tasks with dry and wet road surfaces, respectively. The repeated measures factors (within-subjects) were the two detection targets, consisting of bicyclist dummy and cycle crossing, and the nine crossings used at all conditions. There were 1.85% missing values (4 out of 216). Each missing value was replaced by its condition combination mean value. Because of a violated sphericity assumption, Greenhouse-Geisser corrected p-values were reported. See Appendix F – Analyses for the full ANOVA.
The ANOVA showed main effects of target, F(1,10) = 59.12, p< .0001, and crossing, F(8,80) = 12.05, p< .0001. There was also an interaction effect of target and crossing, F(8,80) = 8.76, p< .0001. While the bicyclist dummy was detected at a distance farther
away compared with detection of cycle crossing for all crossings, the interaction effect shows that this difference in detection distance varies over crossings. This is illustrated in Figure 7. 50 51 52 53 54 55 56 57 59 Crossing 0 10 20 30 40 50 60 70 80 90 100 Vi si bi li ty Di s tan ce (m ) Bicyclist Dummy Cycle Crossing
Figure 7 Visibility of the bicyclist dummy and of the cycle crossing, respectively. Mean values and standard errors for nine crossings.
4 Discussion
4.1 Results
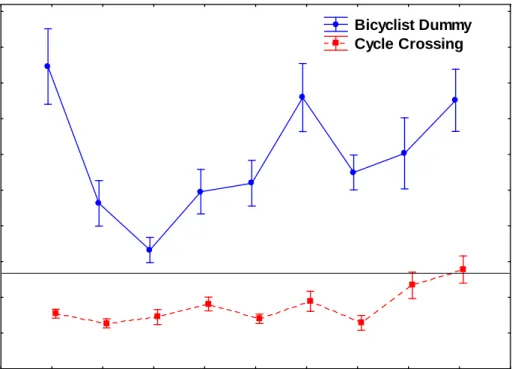
The main result of this study was that the bicyclist was always seen at longer
distances than the cycle crossing. How far away from the crossing is it relevant to
realize that there is a cycle crossing? The smallest acceptable distance should probably be the distance it takes to stop the vehicle. Given that the speed of a car is 50 km/h and that the car driver has a reaction time of one second, the stopping distance is 26 m for dry road surface and 28 m for wet road surface at full brake (NTF, 2010). A stopping distance of 27 m is illustrated with a line in Figure 8.
50 51 52 53 54 55 56 57 59 Crossing 0 10 20 30 40 50 60 70 80 90 100 V is ib ility D is ta n c e (m ) Bicyclist Dummy Cycle Crossing
Figure 8 Standard error and mean visibility of the bicyclist dummy and of the cycle crossing, respectively, together with the estimated stopping distance at 50 km/h.
This means that for only one of the nine cycle crossings in the figure, the visibility distance would be long enough for the driver to stop. It can be argued that the bicyclists are always seen at longer distances than the stopping distance, so it should not be a problem to stop in time all the same. However, the bicyclists used in this field study were bicyclist dummies, standing still and waiting directly in front of the cycle crossing. This behaviour is, however, not characteristic for all bicyclists, i.e. a bicyclist would often come with speed to the crossing and if he or she is waiting to pass the crossing, he or she does not always stand correctly at the cycle crossing. Motion could probably be detected more easily by the car driver but the bicyclist might come into sight when it is too late to stop the car.
4.2 Method
The method used for this experiment was a field study in real traffic. An obvious advantage is that the participants were placed in a real car in real traffic on a real road with real crossings, which means that the connection to reality was high. The
participants were passengers, though, not drivers of the car. Letting participants drive the car would lead to some other disadvantages, such as difficulties in knowing when the participant observed the bicyclist dummy or cycle crossing and different driving behaviour that may influence the results. The amount of time needed for the experiment would also have been increased. As mentioned in section 4.1, the bicyclists in this field study were dummies, standing still. In a real traffic situation, the bicyclists would probably move. This is hard to organize in practice in a field test.
It should be observed that the visibility distance to the combined crossing in total was not measured, but to the cycle crossing, correctly marked with squares. This could mean that the visibility of the crossing, i.e. including the pedestrian crossing, helps the driver to discover the bicyclist. However, this implies that the cycle crossing in itself does not help to any great extent. On the other hand, another purpose of the cycle crossing is to mark the cycleway for the bicyclist.
It must be stressed that the number of observations was small and also varied between the crossings and conditions. Because the field study was carried out in real traffic in the city centre, at some occasions, the bicyclist dummy had been removed by local people. As a consequence, not all of the runs included all of the bicyclist dummies. The participants were mainly recruited from the VTI database of volunteers. Due to late withdrawals and recruited participants that forgot the date, some participants had to be replaced before the field test. Three participants were therefore asked to volunteer through personal contacts with people at VTI. It is possible, but not likely, that this method of selection could have influenced the results.
The number of participants was low, only twelve people, and there was no repetition due to familiarity problems as well as time limits. Hence, the study could be considered as an explorative study. However, the main result was clear even for this small group of people; the participants observed the bicyclist dummy before the cycle crossing. There is no reason to suspect that this result would be different with a larger group of people. The position in the car might influence the results between different participants. This was tested and differences in visibility distance between different positions were found. However, these differences had no effect on the main result.
It can be argued that the order of the runs was the same for all participants, i.e. no balancing between starting position, direction or target was made between the groups. Therefore, the results could possibly have been influenced by time of the day, i.e. drowsiness of the participants. However, there was a reason for showing the bicyclist dummies first, except the fact that they were time-consuming to set up. To try to ascertain that the participants did not remember where the cycle crossings were, the participants were not told in advance about what they were about to look for (before the start of each part of the experiment). In this way, the participants were not supposed to focus on the cycle crossings at first, which means that they would probably have
difficulties remembering them. To increase the confusion of the participants, the starting positions and the direction of the runs were altered (see Table 1).
were first placed at the counter-clockwise cycle crossings and then moved and used at the clockwise cycle crossings. In the dry condition, the dummy bicyclists were used only at the clockwise cycle crossings and then removed.
The visibility distance used is based on the registered push-button push closest to the cycle crossing. If the participant pushed the button twice when approaching a crossing, the last push was considered accurate due to the fact that the button was often pushed at exits of roundabouts (not included in the experiment), previous to the crossing.
However, a participant might push the button when he or she sees a cycle crossing, A, and then push the button again because he or she discovers another cycle crossing, B. If this happens before the car has passed cycle crossing A the distance between the
second push of the push-button and cycle crossing A is calculated. This could be the case in roundabouts, where the participants may push their push-buttons at cycle crossings at exits before they enter the roundabout. As previously mentioned, no cycle crossings at exits were included in the experiment, though.
No strong significant relations between physical parameters and visibility could be shown. Several motives for this are possible:
The illumination, E, should not be influenced by the road surface and was therefore only measured once, i.e. in wet weather. Consequently, possible changes in illumination were not accounted for. It had been checked that there was no dimming of the road lighting, though.
Since some of the participants occasionally pushed the button twice before a crossing, only the shortest visibility distance for each participant and crossing included in the field test was analysed.
The inclination of the bicyclist dummies varied slightly between crossings. The effect of this was probably not very large.
The background of the bicyclist dummies varied between crossings because of the road alignment (roundabout, curviness, hilliness).
Interpreting the luminance coefficient (Qd) on wet road surfaces is problematic. The Qd-value does to some degree reflect the specularity of the surface, which on wet road surfaces gives a high value.
On-coming traffic may have destroyed some of the visibility measurements. This could not be controlled for in this field study but should not have had a large impact on the results.
In some cases, there was a road sign in front of the bicyclist dummy when it was placed at the cycle crossing.
5 Future
research
To determine the role of the design of the cycle crossings, further research is needed. Such research could consist of field tests including a larger number of participants and repetition in such a way that the same participant is exposed to the same cycle crossing condition repeatedly. Also, it is of interest to vary the colour of the bicyclist dummies (on a grey-scale from white to black) and to use bicyclists coming with speed to the crossing. This could probably be tested in a simulator study. It could also be possible to make a comparison of photos from different crossings, using the method in VTI notat 43-2004 (Lundkvist et al., 2004).
References
Fors, C. & Lundkvist, S-O: Night-time traffic in urban areas. A literature review on road user aspects. VTI rapport 650A. Swedish National Road and Transport Research Institute. 2009.
Fors, C. & Nygårdhs, S.: Trafikanters upplevda behov och problem i mörkertrafik i tätort. En fokusgruppstudie med cyklister, äldre bilförare och äldre fotgängare. VTI notat 5-2010. Swedish National Road and Transport Research Institute. 2010. Lundkvist, S-O, Nygårdhs, S & Wiklund, M.: Fotgängares upptäckbarhet i mörker vid övergångsställen. VTI notat 43-2004. Swedish National Road and Transport Research Institute. 2004.
NTF, Nationalföreningen för trafiksäkerhetens främjande: NTF Konsument. Frågor och svar. Hur räknar man ut reaktionssträckan? http://www.ntf.se/konsument/fraga3187.asp (Acc: 2010-02-16).
Transportstyrelsen: Förslag till nya trafikregler vid cykelöverfarter och på cykelbanor. TSV 2009:2856. PM. Swedish Transport Agency. 2009.
Vägverket & Svenska Kommunförbundet: VGU. Vägmarkering och vägkantsutmärk-ning. VV publikation 2004:80. Swedish Road Administration. 2004.
Appendix A1 Page 1
Instructions for part I
Instruktioner till försökspersoner vid cykelförsöket i
Norrköping
Hej och välkommen!
Du är här för att medverka i ett försök på VTI. Du kommer att sitta som passagerare i en personbil tillsammans med andra försöksdeltagare samt en förare och åka en slinga i Norrköping. Försöket går ut på att mäta synbarheten av dels cykelöverfarter och dels cyklister.
Försöket är uppdelat i två delar. Först får du information om del 1, sedan görs två körningar i del 1 och därefter får du information om del 2, som också innebär två körningar.
Du kommer att sitta på samma plats i bilen under både del 1 och del 2. Under alla körningar kommer du att använda dig av en ljudlös tryckknapp för att registrera när du ser en cyklist respektive cykelöverfart.
Del 1
InstruktionUnder den första delen av försöket ska du trycka på en knapp varje gång du ser en cyklist som väntar på att få passera gatan. En cyklist definieras här som en attrapp med en cykel, se figur.
Figur 1 Cyklist i dagsljus.
Du behöver bara trycka när cyklisten väntar med sin cykel på höger sida av vägen. Försök att trycka så diskret att de andra personerna inte ser det.
Tryck inte för att du tror att någon annan har gjort det utan vänta tills du är helt säker
på att det är en cyklist du ser. Om du trycker rätt ökas arvodet med 50 kr! Håll utkik
framåt på samma sätt hela tiden och ändra inte på det mellan de olika körningarna. Du som sitter i baksätet får titta framåt mellan frampassagerarnas säten. Den här delen av försöket innehåller två körningar med en paus emellan.
Appendix A2 Page 1
Instructions for part II
Del 2
InstruktionEn cykelöverfart ska enligt regelverket utformas med vita kvadrater. Ett exempel på en sådan cykelöverfart ser du i bilden nedan. Kvadraterna kan vara antingen före eller efter övergångsstället.
I det här försöket ligger alla cykelöverfarter tillsammans med övergångsställen som i exempelbilden ovan. Däremot finns det inte cykelöverfarter vid alla övergångsställen.
Under den här delen av försöket ska du trycka på en knapp varje gång du ser en
cykelöverfart på den väg du åker på. Tryck bara när du är helt säker på att du kommer till en cykelöverfart som är utformad med kvadrater. Om du trycker på de ställen där det finns kvadrater men låter bli att trycka på ställen där kvadrater saknas ökas ditt arvode med ytterligare 50 kr! Även här gäller det att trycka diskret på knappen så att de andra inte ser.
Den här delen av försöket innehåller också två körningar med en paus emellan.
Appendix B Page 1 (5)
Photos
All photos are taken at a longitudinal distance of 25 m from the bicyclist dummy. In the left part of each picture the mean visibility distance, s, is given to the bicyclist
dummy/cycle crossing in metres. Where the visibility distance to the bicyclist dummy was not measured in the dry road surface condition, the mean visibility distance to the cycle crossing in the dry road surface condition is given in parenthesis.
50 dry 51 dry 51 wet 50 wet s = 80/17 s = 89/14 s = 52/15 s = 41/11 50 dry 51 dry 51 wet 50 wet s = 80/17 s = 89/14 s = 52/15 s = 41/11
Appendix B Page 2 (5) 52 dry 52 wet 53 dry 53 wet s = 25/18 s = 42/11 s = 49/22 s = 50/14 52 dry 52 wet 53 dry 53 wet s = 25/18 s = 42/11 s = 49/22 s = 50/14 54 dry 55 dry 54 wet 55 wet s = 73/24 s = 58/18 s = 46/10 s = 79/14 54 dry 55 dry 54 wet 55 wet s = 73/24 s = 58/18 s = 46/10 s = 79/14
Appendix B Page 3 (5) 56 dry 56 wet 57 dry 57 wet s = 49/22 s = 61/11 s = 71/25 s = 49/15 56 dry 56 wet 57 dry 57 wet s = 49/22 s = 61/11 s = 71/25 s = 49/15 58 wet 59 dry 59 wet s = 82/38 s = 82/11 (14 dry) s = 68/18 58 wet 59 dry 59 wet s = 82/38 s = 82/11 (14 dry) s = 68/18
Appendix B Page 4 (5) 71 wet 72 wet 73 wet 70 wet s = 84/16 (22 dry) s = 66/11 (13 dry) s = 55/12 (10 dry) s = 59/8 (8 dry) 71 wet 72 wet 73 wet 70 wet s = 84/16 (22 dry) s = 66/11 (13 dry) s = 55/12 (10 dry) s = 59/8 (8 dry) 74 wet 75 wet s = 63/8 (11 dry) s = 62/16 (19 dry) 74 wet 75 wet s = 63/8 (11 dry) s = 62/16 (19 dry)
Appendix B Page 5 (5) 77 wet 78 wet 79 wet s = 56/6 (2 dry) s = 97/16 (18 dry) s = 69/10 (25 dry) 77 wet 78 wet 79 wet s = 56/6 (2 dry) s = 97/16 (18 dry) s = 69/10 (25 dry)
Appendix C Page 1 (1)
Appendix D Page 1 (5)
Test results
Table 3 The number of useable participant data for each crossing and test condition. Maximum for each condition is 6.
Visibility of
Bicyclist dummy Cycle crossing Crossi
ng no. Dry Wet Dry Wet
50 6 6 6 6 51 6 6 6 6 52 6 6 6 6 53 6 6 6 6 54 6 6 5 6 55 6 6 6 6 56 6 6 6 6 57 6 6 6 6 58 0 6 6 5 59 6 3 6 6 70 0 6 5 6 71 0 6 6 6 72 0 6 6 6 73 0 6 6 6 74 0 6 6 6 75 0 6 6 6 76 0 0 0 0 77 0 6 1 5 78 0 3 6 6 79 0 3 5 4
Appendix D Page 2 (5)
Visibility of bicyclist dummy
Table 4 Visibility distances to bicyclist dummy [m] measured in the dry road surface condition for three females and three males.
Dry road surface
Female Male
Front seat
Centre rear seat
Right rear
seat Front seat
Centre rear seat Right rear seat Cycle crossing P7 P8 P9 P10 P11 P12 50 107.7 46.6 120.1 84.2 88.4 35.8 51 76.4 41.1 40.1 59.1 81.4 14.4 52 23.1 21.3 33.6 23.7 37 10.2 53 57.2 31.8 59.1 57.1 69 19.8 54 72.8 38.4 86.4 54.7 80.3 13.6 55 88.6 55.4 103 98.6 74.3 16.6 56 39.7 48.6 56.1 48 62.6 38.1 57 82.6 34.5 64.1 43.9 43.3 27.9 58 59 84.1 72.8 81.5 106.5 109.6 38.6 70 71 72 73 74 75 76 77 78 79
Appendix D Page 3 (5)
Table 5 Visibility distances to bicyclist dummy [m] measured in the wet road surface condition for three females and three males.
Wet road surface
Female Male
Front seat
Centre rear seat
Right rear
seat Front seat
Centre rear seat Right rear seat Cycle crossing P1 P2 P3 P4 P5 P6 50 84.2 95 21.2 140.8 80.8 110.4 51 35.4 56.1 20.9 69.3 27.1 34.5 52 50.3 49.6 22.3 48.8 23.7 55.2 53 84.2 43.3 17.4 71 45.9 39 54 45.2 49.9 20.2 49.2 47.8 64.8 55 66.2 82.2 21.5 117.5 82.2 104.8 56 68.8 61.9 26.7 95 56 57.9 57 105.1 38.9 18 123.9 39 102.4 58 73.9 14.3 14.1 140.5 136.6 114.2 59 92.8 105.1 6.4 70 71.5 72.9 20.5 65.7 65.1 59.1 71 91.1 68.7 16.9 49.6 39.4 61.3 72 124 81.9 40.9 109.8 43 101.9 73 125.1 27.1 32.5 126.5 18.8 64.3 74 59.1 95.2 14 51 90.3 67 75 90 68.5 34.2 67.6 40.5 73.4 76 77 65.5 59.3 12.5 67.4 67.7 60.8 78 119 47.8 123.7 79 67.4 69.6 69.8
Appendix D Page 4 (5)
Visibility of cycle crossing
Table 6 Visibility distances to cycle crossing [m] measured in the dry road surface condition for three females and three males.
Dry road surface
Female Male
Front seat
Centre rear seat
Right rear
seat Front seat
Centre rear seat Right rear seat Cycle crossing P7 P8 P9 P10 P11 P12 50 15.4 19.8 20.5 18.8 21.6 6.4 51 15.8 10.8 22.1 17.2 10 12.2 52 18.7 9.6 27.6 19 22.1 9.3 53 15.7 14.1 30.6 13 33.1 27.8 54 13.2 19.4 19.1 20.5 20.2 55 24.5 5.5 28.4 42 32.1 12.2 56 17.6 10.2 26.7 15.8 10.5 7.2 57 20.9 17.9 31 22.1 34.5 4.9 58 8.6 13.6 23.2 22.7 13.5 5.2 59 29.8 20.2 26.7 48.6 48.6 52.1 70 7.7 1.4 11.1 8.9 12.2 71 10.7 10.2 9.6 16.2 10.7 3.1 72 22.9 18.5 35 25.9 18.2 12.2 73 15.8 9.9 12.1 18.3 12.5 9.3 74 11.9 4.9 22.7 15.4 6.9 2.8 75 16.8 20.5 22.1 34 17.6 4.9 76 77 2.4 78 20.9 5.6 24.5 25.4 27.3 5 79 26.3 31.7 16.3 30.4 20.1
Appendix D Page 5 (5)
Table 7 Visibility distances to cycle crossing [m] measured in the wet road surface condition for three females and three males.
Wet road surface
Female Male
Front seat
Centre rear seat
Right rear
seat Front seat
Centre rear seat Right rear seat Cycle crossing P1 P2 P3 P4 P5 P6 50 17.4 12.1 10.7 12.9 13.6 15.8 51 14.7 9.1 4.1 15.1 9.4 11.8 52 14.3 3.4 10.7 23.1 3.9 11.9 53 16.9 11.8 14 14.7 9.9 16 54 17.1 2.4 14.9 5.6 9.1 12.1 55 9.3 10.7 13.8 19.3 12.4 16.2 56 16.5 1.4 2.5 17.7 11.9 16.2 57 16.9 11.8 19 52.2 18 30.7 58 13.5 9.1 11.9 9.6 10.3 59 40.6 16 19 13.8 16.3 1.6 70 16.9 9.1 9.7 6.9 2.7 0.9 71 13.8 11 10.5 15.1 11 11.1 72 24.9 12.1 16 21.5 9.7 12.7 73 8.5 9.3 7.7 14.9 10.5 13 74 13.2 1.3 10 8 8.5 9.9 75 28.2 16 7.4 15.1 11.8 19.8 76 77 5.5 1.7 1.1 10.8 11.3 78 24 15.8 11.1 16.5 5.3 23.7 79 13.8 16.2 8.2
Appendix E Page 1 (5)
Measurement results of lighting and road surface parameters
Let index 1 denote the measurement position on the road surface at the center of the cycle crossing, index 2 denote the measurement position on the centre road marking in the cycle crossing and so on as illustrated in Figure 4. Then Ei, RLi and Qdi denote the measured illumination, retroreflectivity and luminance coefficient at measurement position i, respectively.
Illuminance measures [lx]
Crossing no. Efront Eback E1 E2 E3 E4 E5 E6 E7 E8 50 20.6 11.4 42.0 39.1 33.2 33.3 36.9 35.6 31.5 32.4 51 17.7 5.8 21.9 21.8 30.0 27.4 25.4 25.7 21.4 22.2 52 9.6 15.2 40.7 40.9 41.1 40.9 21.6 24.0 18.9 26.8 53 14.7 37.2 66.6 65.8 60.7 66.5 27.4 30.3 30.2 31.4 54 6.1 7.8 16.4 16.9 15.4 15.9 13.5 13.8 12.9 12.4 55 14.5 16.7 24.5 23.9 25.2 25.5 19.0 17.8 19.0 19.2 56 7.4 3.6 17.8 18.7 18.1 18.2 14.2 13.9 13.5 13.8 57 7.3 14.8 59.9 54.5 49.8 52.2 14.4 16.0 11.6 11.9 58 18.8 21.5 51.4 51.8 56.4 55.3 51.7 54.7 53.1 58.2 59 22.3 15.1 45.3 43.0 39.1 40.0 62.1 61.9 54.1 54.5 70 29.0 37.8 38.9 38.4 41.1 39.3 42.4 49.9 40.3 44.1 71 8.6 10.6 14.1 13.3 16.6 16.8 10.1 10.0 11.1 10.6 72 10.4 59.4 77.5 79.2 57.7 62.1 121.3 121.5 94.4 95.3 73 15.8 23.7 30.6 33.0 30.7 32.5 79.3 89.2 72.6 77.2 74 12.7 10.8 41.3 43.0 39.1 38.4 40.3 40.0 38.0 38.2 75 14.4 15.5 34.2 36.0 33.4 33.4 29.3 28.6 28.7 30.0 77 12.5 5.6 50.5 40.4 51.7 41.5 34.4 36.0 78 56.1 24.6 77.4 75.8 80.2 81.5 68.4 66.5 62.9 63.2 79 13.7 34.1 63.8 68.8 58.4 58.0 42.1 39.5 44.7 45.3
Appendix E Page 2 (5)
Luminance coefficient measures at wet road surface [mcd/m2/lx]
Crossing no. Qd1 Qd2 Qd3 Qd4 Qd5 Qd6 Qd7 Qd8 50 100 240 92 245 119 245 132 248 51 114 191 88 190 98 241 78 185 52 141 218 87 152 149 245 114 165 53 123 152 84 149 140 229 92 162 54 105 205 92 188 102 227 102 230 55 137 214 124 230 131 242 148 245 56 120 232 118 235 95 247 116 223 57 92 151 85 167 85 162 99 148 58 126 205 128 125 109 208 92 246 59 78 187 78 181 111 227 172 211 70 100 202 94 218 95 242 60 193 71 104 199 126 182 170 52 87 72 76 218 93 226 90 254 7 193 73 101 241 87 198 124 235 91 218 74 91 116 82 158 107 95 93 110 75 132 196 101 221 187 226 88 222 77 161 201 131 178 78 87 240 103 182 88 246 79 114 93 8 126 245 111 195
Appendix E Page 3 (5)
Luminance coefficient measures at dry road surface [mcd/m2/lx]
Crossing no. Qd1 Qd2 Qd3 Qd4 Qd5 Qd6 Qd7 Qd8 50 78 181 88 175 70 161 81 182 51 64 128 64 115 64 132 64 127 52 63 112 63 141 63 128 63 122 53 64 143 64 178 64 143 64 151 54 74 151 74 114 74 153 74 117 55 77 157 81 190 75 160 77 186 56 66 175 69 162 68 174 69 165 57 53 138 74 106 49 144 79 71 58 8 159 8 130 8 171 8 163 59 57 110 57 157 57 153 57 154 70 55 156 55 126 55 148 55 143 71 60 159 60 133 60 147 60 133 72 57 157 57 124 57 145 57 165 73 66 159 66 190 66 153 66 157 74 65 74 65 125 65 69 65 98 75 15 6 37 138 13 36 53 180 77 58 113 53 113 78 54 187 54 54 177 54 154 79 67 67 138 67 160 67 166
Appendix E Page 4 (5)
Retroreflectivity measures at wet road surface [mcd/m2/lx]
Crossing no. RL1 RL2 RL3 RL4 RL5 RL6 RL7 RL8 50 2 6 3 4 2 2 1 3 51 1 7 1 7 1 5 1 4 52 0 5 0 6 0 2 0 6 53 2 4 2 8 2 2 1 2 54 1 5 1 0 1 3 1 1 55 8 18 1 31 1 12 0 11 56 1 13 2 8 2 25 2 4 57 0 5 2 2 3 31 1 1 58 0 6 1 3 3 4 3 4 59 3 7 1 2 1 5 0 2 70 2 3 1 9 8 4 2 3 71 1 13 0 0 0 1 1 0 72 2 10 1 3 2 6 22 8 73 2 6 2 12 2 21 2 12 74 1 1 2 1 1 0 1 3 75 1 8 0 2 1 0 0 38 77 0 1 1 3 78 5 4 3 9 1 8 3 8 79 0 11 3 2 0 2 1 2
Appendix E Page 5 (5)
Retroreflectivity measures at dry road surface [mcd/m2/lx]
Crossing no. RL1 RL2 RL3 RL4 RL5 RL6 RL7 RL8 50 10 110 13 124 10 137 10 66 51 9 76 9 120 9 68 9 80 52 10 83 10 135 10 84 10 88 53 11 75 11 39 11 79 11 132 54 13 126 13 45 13 133 13 75 55 14 41 16 101 20 34 15 16 56 11 152 15 93 15 151 15 100 57 10 173 15 68 9 220 15 33 58 8 47 8 107 8 94 8 88 59 9 106 9 108 9 81 9 111 70 9 40 9 104 9 55 9 63 71 9 54 9 75 9 28 9 93 72 11 89 11 88 11 64 11 39 73 13 79 13 105 13 65 13 123 74 11 10 11 62 11 11 44 75 74 165 6 131 69 145 20 151 77 9 104 10 132 78 9 39 9 74 9 62 9 79 79 9 81 9 128 9 112 9 83
Appendix F Page 1 (2)
Analyses
Visibility of bicyclist dummy
Table 8 shows the analysis of variance (ANOVA) of the dry road surface. The analysis was a one-way ANOVA with dependent variable visibility of bicyclist dummy
measured for every participant and crossing as independent variable.
Table 8 One-way analysis of variance with dependent variable visibility of bicyclist dummy and independent variable crossing. Dry road surface.
Effect SS df MS F p-value ηp2 ω2
Crossing 16079 8 2010 3.481 <0.01 0.38 0.27
Error(Crossing) 25981 45 577
Total 220413 54
Table 9 shows the analysis of variance for the wet road surface condition. The analysis was a one-way ANOVA with dependent variable visibility of bicyclist dummy
measured for every participant and independent variable crossing. No significant differences of visibility distance to the bicyclist dummy could be shown.
Table 9 One-way analysis of variance with dependent variable visibility of bicyclist dummy and independent variable crossing. Wet road surface.
Effect SS df MS F p-value ηp2 ω2
Crossing 23568 18 1309 1.24 0.248 - -
Error(Crossing) 90695 86 1055
Total 545407 105
Visibility of cycle crossing
Table 10 and
Table 11 show the one-way analysis of variance of the visibility distance of the cycle crossing for dry and wet road surface, respectively. The dependent variable was visibility of cycle crossing for every participant and the independent variable was crossing. It was seen that there were significant differences between the crossings both at dry and at wet road surface.
Appendix F Page 2 (2)
Table 10 One-way analysis of variance with dependent variable visibility of cycle crossing and independent variable crossing. Dry road surface.
Effect SS df MS F p-value ηp2 ω2
Crossing 4874 18 271 4.07 <0.0001 0.46 0.34
Error(Crossing) 5794 87 67
Total 45779 106
Table 11 One-way analysis of variance with dependent variable visibility of cycle crossing and independent variable crossing. Wet road surface.
Effect SS df MS F p-value ηp2 ω2
Crossing 1986 18 110 2.45 <0.01 0.32 0.19
Error(Crossing) 4148 92 45
Total 24070 111
Visibility of bicyclist dummy compared to that of the cycle crossing
An analysis of variance (ANOVA) was conducted with a mixed or “split plot” design of group (2) × target (2) × crossing (9). The between-subjects factor was the two groups performing their tasks with dry and wet road surfaces, respectively. The repeated
measures factors (within-subjects) were the two detection targets, consisting of bicyclist dummy and cycle crossing, and the nine crossings used at all conditions. See Table 12.
Table 12 ANOVA with mixed design of group, visibility target and crossing.
Effect SS df MS F p-value ηp2 Group 165 1 165 0.060 0.812 - Error(Group) 27641 10 2764 Target 93484 1 93484 59.12 <0.0001 0.86 Error(Target) 15814 10 1581 Crossing 18217 8 2277 12.05 <0.0001 0.55 Error(Crossing) 15113 80 189 Target × Crossing 10534 8 1317 8.76 <0.0001 0.47 Error(Target × Crossing) 12029 80 150
www.vti.se vti@vti.se
VTI är ett oberoende och internationellt framstående forskningsinstitut som arbetar med forskning och utveckling inom transportsektorn. Vi arbetar med samtliga trafikslag och kärnkompetensen finns inom områdena säkerhet, ekonomi, miljö, trafik- och transportanalys, beteende och samspel mellan människa-fordon-transportsystem samt inom vägkonstruktion, drift och underhåll. VTI är världsledande inom ett flertal områden, till exempel simulatorteknik. VTI har tjänster som sträcker sig från förstudier, oberoende kvalificerade utredningar och expertutlåtanden till projektledning samt forskning och utveckling. Vår tekniska utrustning består bland annat av körsimulatorer för väg- och järnvägstrafik, väglaboratorium, däckprovnings-anläggning, krockbanor och mycket mer. Vi kan även erbjuda ett brett utbud av kurser och seminarier inom transportområdet.
VTI is an independent, internationally outstanding research institute which is engaged on research and development in the transport sector. Our work covers all modes, and our core competence is in the fields of safety, economy, environment, traffic and transport analysis, behaviour and the man-vehicle-transport system interaction, and in road design, operation and maintenance. VTI is a world leader in several areas, for instance in simulator technology. VTI provides services ranging from preliminary studies, highlevel independent investigations and expert statements to project management, research and development. Our technical equipment includes driving simulators for road and rail traffic, a road laboratory, a tyre testing facility, crash tracks and a lot more. We can also offer a broad selection of courses and seminars in the field of transport.