VANADIUM REDOX FLOW BATTERY
Sizing of VRB in electrified heavy construction equipment
NATHAN ZIMMERMAN
School of Business, Society and Engineering Course: Degree Project
Course code: ERA401 Subject: Energy Engineering HE credits: 30
Program: Master of Science Program in Sustainable Energy Systems
Supervisor: Javier Campillo, Bobbie Frank Date: 2014-07-13
ABSTRACT
In an effort to reduce global emissions by electrifying vehicles and machines with internal combustion engines has led to the development of batteries that are more powerful and efficient than the common lead acid battery. One of the most popular batteries being used for such an installation is lithium ion, but due to its short effective usable lifetime, charging time, and costs has driven researcher to other technologies to replace it. Vanadium redox flow batteries have come into the spotlight recently as a means of replacing rechargeable batteries in electric vehicles and has previously be used mainly to store energy for load leveling. It possesses many qualities that would be beneficial to electrify vehicles. The battery has the ability for power and energy to be sized independently which is not dissimilar to internal combustion vehicles. It also has the potential for a tolerance to low discharges, fast response time, and can quickly be refueled by replacing the electrolyte; just like is done when a car refuels at the gas station.
The purpose of the study is to determine the possibility of using vanadium redox flow batteries to power heavy construction equipment, a wheel loader, with a finite amount of space available for implementation. A model has been designed in MATLAB to determine how long the battery could last under typically applications for the wheel loader which needs a peak power of 200 kW. From the volume available it has been determined that the battery can be installed with an energy capacity of 148 kWh. The results of the model show that vanadium redox flow batteries can be used to power a wheel loader but due to the limiting energy density and cell components it remains to be impractical.
Keywords: All-vanadium redox flow battery, Vanadium, Energy storage, Batteries, Electric
TABLE OF CONTENTS
1 INTRODUCTION ...1
Rechargeable Electrical Energy Storage ... 1
Batteries in Vehicles ... 2 Types of Batteries ... 2 1.1.2.1 Lead-Acid ...2 1.1.2.2 Sodium-X ...3 1.1.2.3 Nickel-metal Hydride ...3 1.1.2.4 Lithium-ion ...3
1.1.2.5 Energy Storage Comparison ...3
Redox Flow Batteries ... 5
Electrochemistry ... 6
1.2.1.1 Redox Reactions and the Galvanic Cell ...6
Vanadium Redox Flow Battery ... 7
VRB System ... 8
The Advantages and Disadvantages of VRB Technology ... 9
Power & Energy ...10
1.3.3.1 Equilibrium Potential – Nernst Equation ... 10
1.3.3.2 Standard Potential... 11
Cell, Module, Pack ...13
1.3.4.1 Cell Stack/Module ... 13
VRB Performance Aspects ...15
Battery performance ...15
Vanadium ...16
Vanadium Procurement ...16
Vanadium Health and Environmental Impact ...16
Purpose ...17
Scope and limitations ...18
2 DESCRIPTION OF CURRENT STUDY ... 18
3 METHOD ... 19
VRB Sizing ...19
SOC and Vanadium Concentration ...20
Cell Stack ...22
Pump sizing ...23
4 SIMULATION AND RESULTS ... 24
Model 1 – Constant Current and Flow Rate ...25
Flow rate and Pumps ...25
Cell Stack ...27
Power ...28
Volume ...30
Energy ...31
Efficiency ...33
Model 1 Optimal Parameters Results ...34
Model 2 – Varying Current and Flow Rate ...34
Varying load ...37
System Breakdown ...40
Cost Analysis ...41
Refuelling ...48
5 DISCUSSION... 49
Model Limitations with Improvements ...49
Vanadium Concentration ...49
SOC ...50
Flow rate ...50
Increasing Power Density ...50
Reducing Costs ...51
Comparison to the Industrial Standard – Li-ion ...51
Semi-Solid Flow Cells ...53
6 CONCLUSIONS ... 54
LIST OF FIGURES
Figure 1: Battery Comparison1. ... 5
Figure 2: Simplified Redox Reaction. ... 7
Figure 3: Vanadium Redox Flow Battery. ... 9
Figure 4: VRB Cell Stack. ... 13
Figure 5: VRB zero-gap cell stack...14
Figure 6: Zero-Gap, One Cell. ... 15
Figure 7: Load requirements for 1 cycle through each application. ... 20
Figure 8: Optimal Flow Rate. ... 26
Figure 9: Effects of Flow Rate. ... 27
Figure 10: Voltage Curve. ... 28
Figure 11 : Model 1 - 200 kW VRB State of Charge through discharge cycle at constant power. ... 29
Figure 12 : Model 1 - 200 kW VRB voltage curve through discharge cycle at constant power. ... 29
Figure 13: Model 1 - 200 kW VRB power curve through discharge cycle at constant power. . 30
Figure 14: Current Density and Number of Cells. ... 31
Figure 15: 200 kW constant load VRB a) Energy vs. Electrolyte Volume b) VRB Volume vs. Time. ... 32
Figure 16: Losses. ... 33
Figure 17: 200 kW VRB efficiency. ... 34
Figure 18: Model 2 - 200 kW VRB state of charge through discharge. ... 35
Figure 19: Model 2 – 200 kW VRB voltage change through discharge. ... 36
Figure 20: Model 2 – 200 kW VRB current change through discharge. ... 36
Figure 21 : Model 2 - 200 kW VRB under load and carry operation, (a) shows the change in SOC for 1 cycle, (b) shows the application load for 1 cycle. ... 37
Figure 22 : Model 2 - 200 kW VRB under load and carry operation, (a) current change for 1 cycle, (b) voltage change for 1 cycle. ... 38
Figure 23: Model 2 - 200 kW VRB varying load, how the load affects the SOC. ... 38
Figure 24 : Model 2 – 200 kW 148.4 kWh VRB state of charge while under varying load application... 39
Figure 25: System breakdown in reference to available volume. ...41
Figure 26 : Component present costs in percent for a 200 kW, 148.4 kWh VRB. ... 44
Figure 27 : Component predicted future costs in percent for a 200 kW, 148.4 kWh VRB. ... 45
Figure 28: 200 kW VRB scalable costs for future present or future costs projections depending on energy needs. ... 46
Figure 29 : VRB power capacity scalability. ... 47
LIST OF TABLES
Table 1 Energy Storage Comparison. ... 4
Table 2: Standard Potential values for Vanadium. ... 11
Table 3: Molar Formation Data for VRB. Values in parentheses are estimated. ...12
Table 4: L120G Wheel Loader Engine Specifications. ...19
Table 5: Average Energy Consumption. ... 20
Table 6 : Design Parameters for 200 kW VRB. ... 25
Table 7 : 132 kWh Vanadium Redox Flow Battery. ... 40
Table 8: Optimal parameters from simulation. ... 40
Table 9: VRB Cost Analysis for Present and Future Costs. ... 42
Table 10: 200 kW VRB Energy Capacity Costs Structure. ... 45
Table 11: VRB Power Pricing Structure. ... 46
Table 12 : Annualized Cost for 10 Years in SEK. ... 48
NOMENCLATURE
Designation Symbol Unit
Concentration c mol/L
Cross sectional area A m2
Current I amps Density ρ kg/L Diameter D m Energy E kWh Energy Density D kWh/L Efficiency η -
Faraday’s constant F c/mol
Flow rate Q L/sec
Friction factor fi -
Fuel consumption F L/hr
Gas Constant R L/mol K
Gravity g m2/s
Head loss, friction hf Pa
Head loss, minor losses hm Pa
Length L m
Lower heating value LHV kJ/kg
Mols of electrons z mol
Number of cells Ncells -
Open Circuit Potential E0 volts
Pipe roughness ε -
Reynolds number Re -
State of charge SOC -
Specific weight γ -
Temperature T K
Time t seconds
Velocity V m/sec
ABBREVIATIONS AND TERMS
BEV Battery Electric Vehicles
CD Charge Density
DOD Depth of Discharge
FB Flow Battery
HHV Higher Heating Value
H2SO4 Sulfuric Acid
ICE Internal Combustion Engines
LHV Lower Heating Value
Li-ion Lithium ion
NiMH Nickel-Metal Hydride
RFB Redox Flow Battery
SOC State of Charge
1
INTRODUCTION
The electrification of vehicles into battery electric vehicles (BEV) has been in practice for well over a decade as an attempt to move away from fossil fuels (Marc Dijk, 2013). However, the high initial cost of the batteries, such as Li-ion and NiMH, needed for these vehicles, their weight compared to fossil fuel, short driving range per charge, slow recharging, reduced passenger and cargo space has further declined the interest in BEVs (Mohd R. Mohamed, 2009). A new contender in the electrification of vehicles that has a very strong potential in practical application is flow batteries. Flow batteries can allow for a higher degree of freedom in vehicle design in that they can be designed to fit a wide range of vehicular requirements such as quick response time and ability to be charged faster or be refueled quickly by simple exchanging the electrolyte from the system (Mohd R. Mohamed, 2009).
Rechargeable Electrical Energy Storage
The first rechargeable battery, lead-acid battery, was introduced in the mid-1800s. At the beginning of the 1900s the idea of developing rechargeable batteries to be used in vehicles was started by Thomas Edison. In the period of 1900-1910, when electric and gasoline propulsion were competing for the burgeoning domestic and business transport market, it was the restricted range and slow refueling of the electric car which finally resulted in the domination of the market by the internal combustion engine (Westbrook, 2008). Shortly after Edison, G.N. Lewis started experiments to create and develop lithium batteries in 1912 (Unplugged: Energy In Motion, 2011). Roughly sixty years later lithium-ion batteries were discovered and in the 1990s where this technology became increasingly popular in mobile devices due to its high energy density and the ability to be charged through 100’s of cycles with only minor decreases in charge capacity over time. As the price of lithium-ion batteries decreased it is also becoming a popular alternative to lead-acid batteries as it can provide the same voltage while reducing the weight of the machine, which increases the efficiency. In the past 20 years a new type of battery has been gaining momentum and has the possibility of surpassing lithium-ion and Ni-Cd battery performance, (Aaron D., 2011). Redox flow batteries (RFB), which are similar to fuel cells, can be scaled to fit the end objective’s (a vehicle) requirements. Scaling is possible because the technology is based electrolytic fluid passing through an electrochemical cell that produces electricity via chemical reactions, and this fluid can be stored in, or switched out of, tanks. The most appealing features of RFB are: scalability and flexibility, independent sizing of power and energy, high round-trip efficiency, high depth of discharge (DOD), long durability, fast responsiveness, and reduced
Batteries in Vehicles
Battery technology has evolved to a point that makes battery electric vehicles (BEV) a viable contender against not only traditional internal combustion engines but also against
renewable sources such as hydrogen fuel cells and biofuels. The increase in technology over time has allowed for a large increase in energy density (Wh/kg), which is the amount of energy that can be stored in a system per unit volume or mass. From the traditional lead-acid battery having an energy density of 25 to 50 Wh/kg to lithium-ion have and energy density of 100 to 200 Wh/kg (Piergiorgio Alotto, 2014), where the density of diesel is more than 8 kWh/kg (Westbrook, 2008). A consideration that needs to be taken into account with batteries is that there are a finite number of charges and as this number increases, and if there are deep discharges, the performance of the battery will slowly dissipate. However, stored potential energy must be transformed into mechanical energy to be of use to the vehicle, and electric motors convert energy many times more efficiently than comparable internal combustion engines (Michael Fischer, 2009). BEVs use an electric motor, which has substantial benefits over traditional combustion engines such as being clean and quiet, has very few moving parts, is extremely efficient, and requires minimal maintenance when compared to internal combustion engines (ICE). In the modern ICE car roughly 15 % of the energy from liquid fuel is available to move the car after losses from the engine, idling, and driveline (Sabrina T. Howell, 2013). Therefore it is of considerable interest to compare the performance difference and capital cost between BEV and ICE vehicles.
Types of Batteries
Finding alternatives to fossil fuels that are clean is not a new concept being researched for the modern vehicle. One such option is to do away with combustion engines and implement battery technology to access stored electrical energy to mobilize vehicles. Advancements are being made every day that increase the storage capacity and size of batteries. The flowing sections are a brief introduction to some of the current batteries being used to reduce the use of fossil fuels (opinion of the author).
1.1.2.1
Lead-Acid
The most widely known, and oldest, of the batteries is the lead-acid battery, which is over 150 years old. It is widely used in modern ICEs as a starter battery (it starts the car), and since it is only used for this purpose it has a life expectancy of several years. The lead-acid battery uses two different types of lead immersed in a diluted acid mixture (electrolyte), a chemical reaction takes place and electricity is produced (National Roads and Totorists' Association). One major disadvantage to lead-acid batteries is that they are sensitive to temperature, where energy and power density begin to be affected when the temperature falls below 10 ◦C. With a respectable minimum lifetime of around three years in continuous traction use, and with their relatively low production cost of about $60 per kWh, currently offer a low-cost option for electric cars (Westbrook, 2008).
1.1.2.2
Sodium-X
The sodium-sulphur and sodium-nickel chloride (ZEBRA) batteries were both developed as an attempt to fix the low energy density problem in order to make BEV a possibility. They both have an energy density potential of around 100 Wh/kg. The major drawback, and possible eliminating factor in vehicle use, is that these two types of batteries have an effective temperature of 350 ◦C and 300 ◦C respectively. Therefore, these batteries would be better suited in a nonautomotive application.
1.1.2.3
Nickel-metal Hydride
Nickel-metal Hydride (NiMH) batteries have a significantly longer life cycle than lead-acid batteries and were some of the first batteries to be implemented in BEVs and are still widely used in popular models today. They have an energy density of the level of 60 to 100 Wh/kg, cell voltage of 1.2 volts, and can have a high life cycle. However, they are subject to having a poor efficiency and if not used can lose up to 10% to 15% per month (Battery University, 2011) from self-discharging. They also take longer to charge than lead-acid batteries plus they emit quite a bit of heat during the process. The performance of NiMH batteries can greatly be affected by temperature, therefore the battery needs a computer to just monitor the battery’s temperature and charge level. However, their popularity in the BEV market has grown because they have a higher tolerance to over discharging and charging, which helps in making the battery management system a bit simpler. Also, the loss of charge can be
reversed by discharging and charging a several times.
1.1.2.4
Lithium-ion
Possibly the most widely used and well known of the rechargeable batteries being used in BEV are lithium-ion (li-ion) batteries (Marcy Lowe, 2010). When compared to other batteries they have higher electrochemical potential and due to the light weight of lithium they have the capability of achieving the largest energy density for weight. Li-ion batteries can also claim a respectable energy density of 100 to 200 Wh/kg, cell voltage of 3 to 4 volts, with a lifetime potential of 4000 to 8000 cycles with a fast recharge of 80% of the state of charge (SOC) within an hour. However, there are some disadvantages. On the negative side, li-ion batteries require protection so as to not over charge or discharge and have to stay within a proper range of operating limits, battery costs are approximately 40 % more than other batteries with similar capabilities, and the technology is still young and constantly changing (Poole). A computer is also needed for li-ion batteries to monitor the temperature and SOC to ensure that the integrity of the battery is not disrupted.
1.1.2.5
Energy Storage Comparison
In table (1) below a comparison between the different types of batteries are shown; where redox flow batteries will be discussed in detail in the next section. A quick reflection at the chart shows that there are a few obvious differences. Firstly, the lead-acid battery is a very poor choice for BEV since it has a very low energy density and life cycle, but on the other
hand a lithium-ion battery can exceed the energy density by up to four times and the life cycle is twice as long. Secondly, looking at the life cycle, the flow battery is in a league of its own with no other option capable of offering a similar life cycle, as well as having a production cost that is second only to lead-acid. Purely for comparison the hydrocarbons were added. Looking at their efficiency it can be seen that it is the worst in the list but it has an
exponentially higher energy density to compensate for this downfall. Hydrogen fuel cells have a magnitude of three times more than traditional gasoline. Although, the market has had difficulty excepting hydrogen fuels and therefore the popularity is not great (Romm, 2009). This lack of popularity could be in part due to the absence of a proper info structure for refuelling. Using the data from table (1) a Ragone Chart, figure (1) has been constructed for a further comparison of different types of energy storage.
Table 1 Energy Storage Comparison.
Energy Storage Type Energy Density
(Wh/kg) Life Cycle Energy Efficiency (%) Power Density (w/kg) Lead-acid Battery Lead-acid 1 35 1000 >80 180 Sodium-sulfur Battery Sodium-sulfur 1 150-240 >800 80 150-230 Sodium-nickel chloride 1 90-120 1200 80 155 Nickel-metal Nickel-cadmium 1 50-80 2000 75 200 Nickel-metal Hydride 1 70-95 <3000 70 200-300 Lithium-ion Battery Lithium-ion 1 118-250 >2000 >95 200-430 Lithium-ion Polymer 1 130-225 >1200 >91 4 260-450
Redox Flow Battery 2
(VRB) 10-50 >>13000 85 >50 Hydrocarbon
Hydrogen (fuel cell) 1 39 720 4000h 7 50 >300 5
gasoline 1 12 890 150-400 6 <30
-Super-capacitors
Electric double layer2
(EDL) 10-30 1x10⁶ 3 95 >10000 3
1 (Siang Fui Tie, 2013) 2 (Piergiorgio Alotto, 2014) 3 (University) 4 (Matthew A. Keyser, 2003) 5 (Davis) 6 (Energy and Climate)
Figure 1: Battery Comparison1.
1The data used in the Ragone Chart (figure 1) was constructed by using the data from table 1.
Redox Flow Batteries
Described in section 1.1.2, the existing battery technology being used in BEVs is not without limitations. In a sustainability assessment of electric vehicles and the recyclability of rare earth metals, (Koen Binnemans, 2013) (Ricardo Faria, 2012), show that for NiMH and Li-ion batteries it was found that their production leads to resource depletion, global warming, and contributes to ecological toxicity. In the 21st century, time is not a luxury that everyone has,
and therefore the charging time for batteries and their potential life cycle are another two major drawbacks on the current available technology.
A new type of technology that addresses both of these issues is Redox flow batteries. This type of electrochemical system has the ability to be scalable, independent sizing of power and energy, high round-trip efficiency, high DOD, long durability, fast responsiveness, and reduced environmental impact (Piergiorgio Alotto, 2014). Up until recently this type of technology has been primarily used in large installations that have been used in stabilizing the intermittent production of renewable energy sources such as wind and solar power to the grid (Trun Nguyen, 2010). The electrochemical systems of flow batteries operates by using two electrolytic solutions, which can when designed have a large energy capacity because larger storage tanks can be used and will result in the scalability of usable energy. Leading
the charge in redox flow batteries are vanadium redox flow batteries (VRB). In the following sections VRBs will be discussed in more detail.
Electrochemistry
In an electrochemical system, such as in flow batteries, there must be two electrodes, the anode and cathode, that allow for the transport of electrons, and separated by an electrolyte that allows the movement of ions but blocks the movement of electrons via a membrane (John Newman, 2004). Where each electrode-solution pair forms a redox
(oxidation/reduction) half-cell that allows for oxidation to occur in the electrolyte solution called the anolyte and for reduction to occur in the electrolyte solution called the catholyte. When the electrode is immersed in the electrolyte atoms begin to separate and are introduced into the electrolyte as ions and effectively leaving electrons in the electrode. As this process continues a build-up of electrons will create a negative charge. This will in turn make it more difficult for more ions to be introduced into the system, where this negative electrode is called the anode. Oxidation can now occur, the loss of electrons in the anolyte, and
controlled with the help of an external conductor that is connected to the opposite electrode to allow the flow of electrons, which is called the cathode. The cathode is where reduction occurs, which is the gaining of electrons in the catholtye. Even though the half-cell reactions occur at different electrodes, the rates of reaction are coupled by the principles of
conservation of change and electroneutrality, and therefore the current, flow of positive charge, that leaves one electrode must enter another, and the flow of current is continuous (John Newman, 2004).
1.2.1.1
Redox Reactions and the Galvanic Cell
As mentioned a redox reaction is were reduction, the gain of electrons, and oxidation, the loss of electrons occurs in half-cells. A galvanic cell is where the electrons being transferred are used to perform useful electrical work.
A simplified redox reaction can be seen in figure (2) (cheng), where one electrode is made of zinc and the second made of copper. Zinc is a reactive metal and consequently it reacts with the solution. Zinc atom lose electrons at the electrode and come into the solution as
positively charged ions. This type of chemical reaction is called oxidation. The same process occurs for the copper electrode but at a much slower rate causing an imbalance. Before the electrodes were introduced to the electrolytic solution they were both neutral. However, now the zinc electrode is increasingly becoming negative and if a conductive wire was connected to each electrode there would be a flow of electrons to the copper electrode resulting in a voltage of 1.1 V. Reduction then occurs in the copper electron as positive copper ions are attracted to the increasing amount of electrons flowing into the system driving the charge of the copper electrode to become neutral again. As the ions leave the electrolytic solution this will cause the solution to become negatively charged, but passing through the membrane towards the zinc solution allows for a balance to be achieved since the zinc solution is negative.
Figure 2: Simplified Redox Reaction.
Vanadium Redox Flow Battery
In a VRB the chemical properties of vanadium allow it to be in four redox states V2+/V3+ and
V4+/V5+. It was determined that the best choice of electrolyte would be sulfuric acid (H2SO4)
because it provides sufficient solubility for each of vanadium’s oxidation states (Aishwarya Parasuraman, 2013). The contribution of adding H2SO4 is that it increases the ionic
conductivity of the catholyte, or positive electrolyte, and also provides hydrogen ions to the reaction at the positive electrode. By using the four different redox states of vanadium it of great interest because the redox couples act as the negative and positive electrolyte in each half-cell and during discharge V2+ is oxidized to V3+ in the negative electrolyte while V5+ is
reduced to V4+ in the positive electrolyte, and charging of a VRB is just the reverse of this
process (D.S Aaron, 2012). Also, using vanadium in both half-cells creates a long lasting system because the cell capacity will not deteriorate due to the fact that the same metal ions are being used in both electrolytic solutions. When there is cross-diffusion between the solutions there will be an energy loss but only for that particular cycle. Add a pump to each electrolyte tank will allow for the circulation of both electrolyte tanks, were this circulation is allowed to flow through an electrochemical cell stack that is made up of multiple cells
connected in either series or parallel. The electrolyte needs to be able to flow in order for the redox reactions to occur while passing through each cell in the stack and will be expounded upon further on.
VRB System
A typical all vanadium system is comprised of two electrodes (anode and cathode) and an ion exchange membrane separator that allows for the diffusion of hydrogen ions across a
membrane while preventing the cross-diffusion of the electrolyte solutions from the two tanks (Aishwarya Parasuraman, 2013). In figure (3) (Wogan, 2013) a VRB and all constituent parts can be seen.
When an external source is connected to the electrodes it causes electrons to flow through the circuit from the negative electrode to the positive electrode. This happens because
connecting the two electrodes causes the energy potential in the negative electrode to increase, which causes electrons to flow from the negative to positive electrode via the oxidation (loss of electrons) of V2+ to V3+ effectively producing electricity. At the same time
the connection of electrodes causes the energy potential in the positive electrode to decrease, which causes the reduction (gaining of electrons) of V5+ to V4+. While the redox reaction is
occurring there will be a diffusion of hydrogen ions (H+) across the membrane separating the
two half-cells to maintain the charge neutrality and to also complete the circuit. Once
equilibrium is achieved in both half-cells the redox reaction will cease and therefore no more electricity can be produced.
To charge the battery all that is needed is to reverse the process by connecting to an external power source. This will create a positive potential in the positive electrode, which will cause oxidation to occur in the positive electrolyte and therefore electrons will be given up from V4+
to create V5+. At the same time there will be a negative potential on the negative electrode
allowing for electrons to be accepted from the positive electrode and being introduced into the electrolyte causing V3+ to be reduced to V2+.
The chemical equation for the system can be seen in equation (1). The first two equations, following from left to right, represent the reduction occurring at the cathode and the oxidation occurring at the anode respectively, which occurs during discharge.
𝑉5++ 2𝐻++ 𝑒−⇋ 𝑉4++ 𝐻 2𝑂 𝑉2+ ⇋ 𝑉3++ 𝑒− _________________________ 𝑉2++ 𝑉5++ 2𝐻+ ⇋ 𝑉4++ 𝑉3++ 𝐻 2𝑂 [1]
Where H2O and H+ protons are needed in the cathodic reaction (positive side) to maintain
the charge balance and stoichiometry, and the vanadium ions,V4+ and V5+, are actually
vanadium oxide ions VO2+ and VO2+ respectively (Christian Blanc, 2010).
Therefore equation(1) can be rewritten into equation (2). 𝑉2++ 𝑉𝑂
Figure 3: Vanadium Redox Flow Battery.
The Advantages and Disadvantages of VRB Technology
There are two main distinctions between galvanic cells, like lead-acid batteries, and VRB. One of which has already been mentioned and that is that there are pumps in the system to circulate the electrolyte solutions. The second difference is that the chemical reaction taking place in VRB is between the electrolytes, as mentioned vanadium can exist in four oxidation states, and not between the electrolyte and the electrode as was seen in figure (2). This is of interests because in a normal battery, like a lead-acid battery, the chemical reactions taking place are between the electrode and the electrolyte, so there will be no electro-deposition or loss in electroactive substances taking place when the battery is repeatedly cycled (Christian Blanc, 2010).
In VRB there is a separation between power and energy. When implemented, the power needs are subject to the constraint of how many cells are in the cell stack and the energy needs are met by the electrolyte tanks. Therefore, when a flow battery is implemented into a vehicle, the engine size (power) will represent the cell stack and the fuel tank (energy) will represent the electrolyte volume.
Other advantages are quick response times, high electricity-to-electricity equalization requirement, simple (SOC) indication (electrolytes will be different colors when at
equilibrium), low maintenance, tolerance to overcharge and overdischarge, and possibly the most important is the ability for deep discharges without affecting the cycle life (Trung Nguyen, 2010).
On the negative side of VRB technology is the cost of vanadium because it is already commonly used in many applications. However, there is a possibility of cheaply obtaining vanadium. During the leaching of coal, to obtain a higher heating value, vanadium is just one of the elements that can be separated; more will be discussed in section 1.5.1. VRBs also have a low energy density, but this can possibly be addressed when implemented into heavy machines as the loss of equipment for electrification would help with the addition of large electrolyte tanks.
Power & Energy
Power and energy are independent of each other in VRB, where the power potential is set by the cell stack and energy potential by the volume of the electrolyte tanks. When sizing a system it will be necessary to find the number of cells needed and how they should be connected in order to achieve the desired voltage and amperage and then the volume of the tanks can be determined in accordance to the available space in the system.
The following section(s) will discuss how the voltage of one cell can be calculated and then how and to construct a cell stack.
1.3.3.1
Equilibrium Potential – Nernst Equation
When two electrodes are connected, the equilibrium potential, denoted by E, is the state where no current is flowing and the rate of forward reactions is equal to the rate of backwards reactions. The potential of the electrode at equilibrium is a measure of the electrochemical potential, or energy (John Newman, 2004). Therefore, a cell stack will be at equilibrium when no current is running through it. This is of interests because the Nernst equation can be used to relate the equilibrium potential to the concentrations of the catholyte and anolyte, equation (3), to calculate the voltage depending on the concentrations, denoted by c for each species in the catholyte and anolyte.
𝐸 = 𝐸𝜃´− 𝑅𝑇 𝑛𝐹𝑙𝑛 {( 𝑐𝑖𝑟𝑒𝑎𝑐𝑡𝑎𝑛𝑡𝑠 𝑐𝑖𝑝𝑟𝑜𝑑𝑢𝑐𝑡𝑠) 𝑐𝑎𝑡ℎ𝑜𝑙𝑦𝑡𝑒 (𝑐𝑖𝑟𝑒𝑎𝑐𝑡𝑎𝑛𝑡𝑠 𝑐𝑖𝑝𝑟𝑜𝑑𝑢𝑐𝑡𝑠) 𝑎𝑛𝑜𝑙𝑦𝑡𝑒 } [V] [3]
For the case of VRB the vanadium concentrations at different oxidation states can be inserted into equation (3) to become equation (4).
𝐸 = 𝐸𝜃´− 𝑅𝑇 𝑛𝐹𝑙𝑛 {( 𝑐 𝑉𝑂2+ ∙ 𝑐𝐻+2 𝑐𝑉𝑂2+ ) ( 𝑐𝑉2+ 𝐶𝑉3+)} [V] [4]
Where R is the gas constant, T is temperature in Kelvin, F is Faraday’s constant, ci is the concentration of species i, and Eθ`is the formal potential, an experimental value often not
1.3.3.2
Standard Potential
Calculating the standard potential for the redox of vanadium will show the potential voltage capabilities at standard conditions: a concentration of 1 mole per liter (1M), pressure at 101 kPa and temperature at 25 ◦C (298.15K). This is done by adding the reduction potential of the reduction half-cell to the negative of the oxidative half-cell. The equation for calculating the standard potential can be seen in equation (5), which uses the standard potential values for the different vanadium species from table (2) (Hayes, 2003). The chemistry of the VRB is what drives the battery and since vanadium exists in more than one oxidation state the voltage potential can be calculated, equation (5).
𝐸𝜃= 𝐸
𝑐𝑎𝑡ℎ𝑜𝑑𝑒𝜃 − 𝐸𝑎𝑛𝑜𝑑𝑒 𝜃 ⇒ 1.00 + 0.225 = 1.255 𝑉 [V] [5]
Table 2: Standard Potential values for Vanadium.
Vanadium Couples Reaction Potential in acidic solutions (Eθ - volts) V5+ - V4+ VO 2+ 2H++e- <--> VO2++H2O 1 V4+ - V3+ VO2+ +2H++e- <--> V3++H 2O 0.337 V3+ - V2+ V3++e-<-->V2+ -0.255 V2+ - V V2++2e-<-->V -1.13
With the standard potential calculated to be 1.255 volts, equation (4) can be used to calculate for nonstandard conditions, where Eθ has just been calculated and the right side of the Nernst
equation corrects for the deviation from standard conditions.
The standard potential can also be calculated another way by using equation (6), but first the Gibbs free energy ∆G, needs to be calculated. The Gibbs free energy is meant to measure the energy that accompanies a chemical reaction and is determined by using equation (7). This is done by using the law of conservation of energy and relates the change in free energy
resulting from the transfer of n moles of electrons to the difference of potential E in equation (6), and empirical parameters found in electrochemical tables, table (3) (Christian Blanc, 2010).
𝐸𝜃= −∆𝐺𝜃
𝑛𝐹 [V] [6]
Where n is the number of moles of electrons and is taken to be 1, F is Faraday’s constant (9.648533 x 10⁴ C mol-1), and ∆Gθ is the Gibbs free energy of the reaction at the standard
state conditions of 1 M concentration, 101 kPa, and 25 ◦C. ∆𝐺𝜃= ∆𝐻
𝑟𝜃− 𝑇∆𝑆𝑟𝜃 [kJ/mol] [7]
The standard enthalpy and entropy of reaction can be calculated by using equation (8) and equation (9) respectively. Where, for each one, they are the difference of molar formation between the products and reactants, with respects to either enthalpy or entropy.
∆𝐻𝑟𝜃= ∑ ∆𝐻𝑓,𝑝𝑟𝑜𝑑𝑢𝑐𝑡𝑠𝜃 − ∑ ∆𝐻𝑓,𝑟𝑒𝑎𝑐𝑡𝑎𝑛𝑡𝑠𝜃 [kJ/mol] [8]
∆𝑆𝑟𝜃= ∑ ∆𝑆
𝑓,𝑝𝑟𝑜𝑑𝑢𝑐𝑡𝑠𝜃 − ∑ ∆𝑆𝑓,𝑟𝑒𝑎𝑐𝑡𝑎𝑛𝑡𝑠𝜃 [kJ/mol] [9]
From the VRB reaction in equation (2) the products and reactants are known and all that is left is the molar formation data, which is located in table (3).
Table 3: Molar Formation Data for VRB. Values in parentheses are estimated.
Formula State ∆Hθ
f[kJ/mol] ∆Hθf[kJ/mol] ∆Sθf[kJ/mol ∙ K]
V2+ aqueous (-226) -218 (-130) V3+ aqueous (-259) -251,3 (-230) VO2+ aqueous -486,6 -446,4 -133,9 VO+ 2 aqueous -649,8 -587 -42,3 H2O aqueous -285,8 -237,2 69,9 H+ aqueous 0 0 0
Using the thermodynamic values given above, equations (8 & 9) can be expanded and solved into equations (10 & 11).
∆𝐻𝑟𝜃= ∆𝐻𝑓,𝑉𝑂𝜃 2++ ∆𝐻𝑓,𝑉𝜃 3++ ∆𝐻𝑓,𝐻𝜃 2𝑂 −∆𝐻𝑓,𝑉𝜃 2+− ∆𝐻𝑓,𝑉𝑂 2+ 𝜃 − 2∆𝐻 𝑓,𝐻𝜃 + [10] = −486.6 − 259 − 285.8 + 226 + 649.8 − 0 = −155.6 𝑘𝐽/𝑚𝑜𝑙 ∆𝑆𝑟𝜃= ∆𝑆 𝑓,𝑉𝑂𝜃 2++ ∆𝑆𝑓,𝑉𝜃 3++ ∆𝑆𝑓,𝐻𝜃 2𝑂 −∆𝑆𝑓,𝑉𝜃 2+− ∆𝑆𝑓,𝑉𝑂 2+ 𝜃 − 2∆𝑆 𝑓,𝐻𝜃 + [11] = −133.9 − 230 + 69.9 + 130 + 42.3 + 0 = −121.7𝑘𝐽/𝑚𝑜𝑙
Combining equations (6 & 7) results in equation (12), where the standard potential can now be calculated
𝐸𝜃= −∆𝐻𝑟𝜃−𝑇∆𝑆𝑟𝜃 𝑛𝐹 [V] [12] = −155,60 ( 𝐽 𝑚𝑜𝑙) + 121.7(𝑚𝑜𝑙 ∙ 𝐾)(298.15 𝐾)𝐽 96485.33 (𝑚𝑜𝑙) (1 𝑚𝑜𝑙)𝐶 = 1.23 𝑉
Therefore, at standard conditions using thermodynamic principles the potential voltage of one cell in a VRB is 1.23 V, which is very close to the results obtained using equation (5).
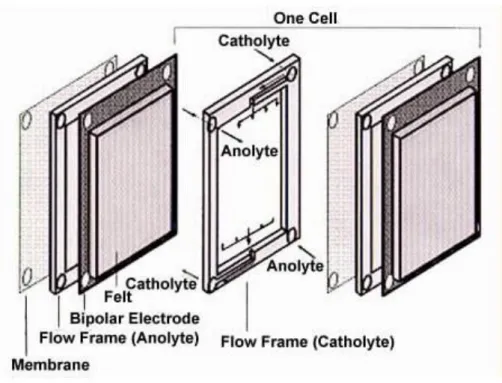
Cell, Module, Pack
Cell, module, and pack are three terms generally used when talking about batteries in BEVs. The cell is going to be the smallest unit, which consists of the electrodes, membrane, and end plates. A module is when more than one cell is combined and the pack consists of one or more modules, which can be connected in series or parallel.
1.3.4.1
Cell Stack/Module
The voltage capability of a VRB cell is around 1.2 V, and therefore more cells are needed to be connected in order to increase this to a point where application in BEV is viable. An example of a cell stack or module can be seen in figure (4), (Christian Blanc, 2010), which represents three cells connected in series. On both ends of the stack are two end plates with electrodes and then separating each individual cell is a bipolar electrode that allows for the flow of electrons to occur. Within each cell there is a semi-permeable membrane that keeps the vanadium electrolyte solutions separated from mixing while allowing hydrogen ions through. With each cell being separated by a bipolar electrode the catholyte solution in each cell will oxidize and therefore give up electrons to the anolyte solution in the next cell creating a voltage. End plate Membrane Bipolar electrode End plate Electron Oxidation Reduction
It was proven in (D.S Aaron, 2012) that by designing a cell stack that has a zero-gap
configuration, where there is no separation between the end plats, membrane, and electrode, can increase the efficiency of VRBs. Their studies showed that the zero gap design could reduce charge transport distances and observed an improvement in battery output. In this design, figure (5) from (Yu Victor, 2014) and figure (6) from (M. Skyllas-Kazacos), the anolyte and catholyte have been replaced with porous carbon felt. This allows for the direct contact of electrodes, electrolyte, and membrane sandwiching everything in between the positive and negative ends.
Figure 6: Zero-Gap, One Cell.
VRB Performance Aspects
It was mentioned earlier that one of the benefits that accompanies flow batteries is that power and energy are independent of each other. This is of great interests in the implementation of VRBs into vehicles because the vehicle’s power needs will be met by design of the cell stack and the energy will be determined on the volume of the electrolyte tanks. Therefore the vehicle can be optimized by designing a system that is capable of carrying a large tank load and therefore allowing the vehicle to have a larger range of application. In the construction industry time is essential and having to spend less time recharging/refuelling would potential save time and money.
Battery performance
The SOC of a battery is essentially a representation of how much energy the battery has or has used, not dissimilar to the fuel gauge in a vehicle. It is a value between 1 and 0, where a value of 1 represents a fully charged battery, SOC is defined as the remaining capacity of a battery and it is affect by its operating conditions such as load current and temperature, (Kwo Young, 2013).
Vanadium
Vanadium has long been an important mineral in the steel business. When used as an additive it has the capability of producing the toughest alloys for armour plate, axles, piston rods, crankshafts, and vanadium oxide is used in ceramics as a catalyst in the production of superconducting magnets (RSC, 2014) (D.S Aaron, 2012).
Vanadium Procurement
Vanadium does not occur in nature on its own but it is possible to find it within 65 different minerals, therefore other means of acquisition have to be used. Vanadium is a common additive to alloy steel as it adds strength and resilience accounting for the majority of vanadium being used and can be founded as a by-product during iron refining. As mentioned earlier vanadium can be obtained from the leaching of coal, which is a process that is already being practiced in industry. Vanadium recovery plants in Japan and Germany have been constructed to treat fly ash from boiler plants fired with Venezuelan crude oil, which has an average vanadium content of 310 ppm with a potential annual production of 4200 tons (Rydh, 1999).
Vanadium Health and Environmental Impact
Any hazards that can occur from the exposure to vanadium are determined by the oxidation state of the vanadium while in its solid form. Some health effects to vanadium ingestion: damage to the nervous system, cardiac and vascular disease, weakening, sickness, headaches, and behavioural changes (WTS, 2014). Vanadium can be found in plants, animals, and algae in the environment and can also cause some inhibition of their functioning by causing DNA alteration.
The vanadium being used in VRB is vanadium pentoxide powder and is mixed with sulfuric acid and water to create the electrolyte solution. In this form the vanadium will no longer be a concern but the electrolyte still needs to be handled with care as the acidity level can lead to caustic affects if allowed as is comparable to lead acid batteries. In case of a spill the
following preventative measures should be taken:
“Ventilate area of release. Stop leak if possible without risk. Do not touch spilled material. Dike far ahead of spill with inert diking materials. For small spills, neutralize with soda ash, absorb spill with inert, non-combustible material such as clay then place in suitable containers. For large spills, contain spill with inert, non-combustible absorbent material such as clay or earth. Remove spilled liquid with pumps into suitable containers, or absorb with dry clay and shovel into polyethylene or plastic containers. Wash thoroughly after dealing with a spillage” (EVRAZ , 2011).
It was determined by (Rydh, 1999) that when compared to traditional lead acid batteries that the environmental impact is lower for a VRB because the net energy storage efficiency of a vanadium battery is greater due to lower energy losses during the life cycle and plus
vanadium provides favorable characteristics such as long cycle life, good availability of recourses and recycling ability.
Purpose
The objective of this project is to determine the feasibility of implementing a VRB into a wheel loader which is a type of heavy construction equipment. The interest in flow battery technology is gaining momentum in the renewable energy world, which in the past has been proposed as a means to help in the stabilization of electricity grids (Toshikazu Shbata, 2013). The idea of electrifying vehicles can now be explored because flow batteries can provide quick response time, ability to be discharged quickly, quick refueling, and all while reducing the dependency on fossil fuel.
It is easy from looking at a numbers perspective, considering that the specific energy of fuel gas is over a hundred times that of the leading battery technology, that the power and energy potential of ICE is far superior to that of BEV. If the power or energy requirements increase in either case so will system parameters such as vehicle weight, sized, and shape. This means that based on the current technology it is impractical to design a vehicle that requires a large amount of power and energy. This is why BEV installation is typically seen in small
commuting vehicles that require a much lower amount of energy.
If however, we were to consider a vehicle that requires a much higher power and energy, such as heavy construction vehicles constraints such as weight and size available for battery
installation become more interesting. As mentioned before, typically BEVs are small and compact and are designed for maximum fuel efficiency to allow for farther distances to be travelled. With a wheel loader the main task is not transportation but to do work; like lifting or moving large and heavy loads. Such work requires a lot of power and in this project the wheel loader requires a peak power of 200 kW and it was found, from using duty cycles of three different applications, that the average power required is 45 kW. The current
parameters of the wheel loader in study has a fuel capacity of 269 liters and an average fuel consumption of 13.5 L/hr, this would result in the need for refuelling after 20 hours. It needs to be noted though that this is just the average and that the refuelling time is dependent upon the conditions under which the wheel loader is running. Considering the cost of diesel to be 13.5 SEK/L, (Fuel-prices-europe, 2014), this would require 3631 SEK with each refuelling or 181.5 SEK/hr. A comparison between ICE and VRB can be made if the ICE were to be replaced with an electric motor to cover the average power requirements of 45 kW from the wheel loader would have a different running cost. The average cost for electricity in Sweden for 2012 was approximately 1.56 SEK/kWh, (Dromacque, 2013). It has been described how VRBs can be recharged simply by connecting to the grid. If it were possible to use the same discharge and recharge time as with the 20 hours from an ICE this would have a running cost of 1404 SEK/charge. This shows that the cost of “refuelling” a VRB is 2.5 times less than the current refuelling cost of diesel. This cost however is sizing the ICE and VRB as equal and this is quiet impractical because as mentioned earlier the amount of energy in a VRB is dependent upon the volume of electrolyte used and for this project only three cubic meters
are available for the battery. That is why for this project it is of interests to see how the battery can be sized to still meet the requirements of the wheel loader.
Scope and limitations
This project is limited in the fact that no actual VRB will be built and tested. Therefore the battery design will be done from a theoretical perspective. The theoretical possibilities will be designed and outlined but should be tested before any actual application. Two models were constructed to test different parameters. The first model is used to design a 200 kW VRB, to match the max power of the wheel loader. The model is designed to determine the number of cells, volume of electrolyte, pump power required to circulate the electrolyte from its two tanks, and the time of discharge with a constant load 200 kW. However, in real application the wheel loader does not require a constant 200 kW; therefore a second model has been designed to see how long the battery can last under typical working conditions.
This study focuses on sizing a VRB with a given amount of space available in the system. There are other factors that will need to be considered if there is an actual implementation. In an actually working model a heat exchanger will be needed as well as a controller but these are out of the scope of this project and are not presented, but acknowledged.
2
DESCRIPTION OF CURRENT STUDY
The purpose of this project is to determine the feasibility and sizing of electrifying a wheel loader with available volume of 3 m3 with VRB technology. The model was designed using
MATLAB, where the battery is designed to operate with a SOC of 0.95 – 0.05. The model begins by determining the flow rate that provides the maximum power and energy capacity by using the available volume in the system. Then, from the outlet concentration of
vanadium from the stack, allows for the SOC of the battery to be calculated and this in turn determines the power capacity of the battery by determining the voltage of the stack. Using this information, the number of cells needed to meet the power requirements was
determined, and therefore the cell stack size. It was determined that the amount of usable volume in the system is only 3 m3, (Unnebäck, 2014). Since the stack size is now know the
remaining volume of the system can be used to determine the amount of vanadium and subsequently the volume of electrolyte and energy capacity. The final stage of the model calculates the needed pump power for the two pumps in the system.
3
METHOD
The first calculations were made focusing around the engine specifications given in (VolvoCE, 2011) and can be seen in table (4). These specifications made it possible to size the VRB appropriately, which was done by following the system of equations, used in subsequent subsections, for the designing of VRB in (Christian Blanc, 2010). From table (4) it can be seen that the power of the wheel loader is 200 kW, therefore the battery was parameterized around this value. The 200 kW battery was then designed at constant current which resulted in finding the number of needed cells and volume of electrolyte. A second model was then designed using the determined number of cells and volume, but at varying current and flow rate. The two models will be compared and discussed in more detail in section 4.
VRB Sizing
The L120G Wheel Loader uses a 6-cylinder, 8 liter in-line turbocharged diesel engine with a net power of 200 kW, table (4). Diesel fuel has a lower heating value (LHV) of 43,400 kJ/kg (EngineeringToolBox) and a density, ρdiesel, of 0.845 kg/l (Wagner, 2013). Duty cycles were
given for three different applications: load and carry, pallet fork, and short cycle loading. The cycles were done for a period of one cycle, in 0.05 second intervals, figure (7); the average fuel consumption, Favg, 13.5 liters/hour, (Unnebäck, 2014), was also provided. Using
MATLAB these were extended for a one hour time period to determine the average power requirements for each application, table (5).
Table 4: L120G Wheel Loader Engine Specifications.
Max power at (r/s) 28.3
SAE J1995 gross (kW) 201
ISO 9249, SAE J1349 net (kW) 200
Max torque at (r/s) 25
SAE J1995 gross (Nm) 1320
ISO 9249, SAE J1349 (Nm) 1312 Economic working range (r/s) 14.2-35
displacement (l) 7.75
operating weight (kg) 19259.5 Battery (voltage - amps) 24 fuel tank capacity (liters) 269
Figure 7: Load requirements for 1 cycle through each application.
Table 5: Average Energy Consumption.
Type of Application Average Power (kW)
Load and Carry 56.19
Pallet Fork 36.13
Short Cycle Loading 43.27
Average power 3-operations 45.19
SOC and Vanadium Concentration
An important parameter of VRB is the SOC, which is dependent upon the concentration of vanadium ions in the catholyte and anolyte as it flows through the stack. As mentioned before a SOC of 1 denotes a fully charged battery, a 100% charge, and zero is a completely depleted battery; it represents the amount of energy available and concentration of reactants and products over time. This means that the concentrations of vanadium will change
throughout the charge and discharge cycles and will not be equal throughout the process. There will be an initial concentration, c0, concentration entering the cell, cin, a concentration out, cout, and a concentration for the tank, ctank. Usually, the size of the reservoir is large compared to the electrolyte flow rate; thus the change in concentrations due to the flow of
0 0.5 1 1.5 2 2.5 3
0 200 400
Load and Carry time of 1 cycle =2.8867
Time (min) P o w e r (k W ) 0 0.2 0.4 0.6 0.8 1 1.2 1.4 1.6 1.8 0 100 200
Pallet Fork time of 1 cycle =1.7808
Time (min) P o w e r (k W ) 0 0.2 0.4 0.6 0.8 1 1.2 1.4 1.6 0 100 200
Short Cycly Loading time of 1 cycle =1.5583
Time (min) P o w e r (k W )
used electrolyte is so small that the tank concentrations are considered homogeneous , which allows for cin to be equal to ctank (Christian Blanc, 2010). To determine the SOC and the concentrations for the inlet and outlet of the stack were necessary to calculate.
𝑐𝑖𝑛= 𝑐𝑜+ 1
𝑉𝑡𝑎𝑛𝑘 ∫
𝑏
𝐹∗ 𝐼(𝑡) [mol/l] [13]
𝑐𝑜𝑢𝑡 = 𝑐𝑖𝑛+ 𝑏∗𝑁𝐹𝑐𝑒𝑙𝑙∗𝑄𝐼 [mol/l] [14]
Where Vtank is the volume of the tank, F is faraday’s constant, I is current flowing through the
stack, Ncell is the number of cells, Q is the flow rate of electrolyte, and b is either positive or
negative for charging and discharging respectively.
The flow rate of the vanadium is an important parameter of the VRBs because it affects the rate of electrons being released, and therefore the SOC and voltage of the battery. The higher the flow rate the fewer the number of reactions that will be able to occur. The battery is composed of a stack with Ncells and therefore as the electrolyte is flowing through the stack
there are Ncell redox reactions occurring, which means that the flow rate is dependent upon
the number of cells. 𝑄 = 𝑁𝑐𝑒𝑙𝑙𝑠
𝐹 ∗ 𝐼 [mol/s] [15]
As seen in equation (14) the outlet concentration is dependent upon the flow rate of electrolyte, therefore it was of interest to see how the flow rate affects the concentration. Using MATLAB a range of minimum flow rate increments will be calculated to determine at what flow rate, if any, provides the maximum power and energy capacity for the system in study. However, a minimum flow rate shall be calculated first.
The minimum flow rate, Qmin, is the rate at which all the vanadium ions are oxidized during
one full cycle and is dependent upon the concentration of ions available at the end of the battery’s cycle.
𝑄𝑚𝑖𝑛 = −1∗𝐼∗𝑁𝑐𝑒𝑙𝑙𝑠
𝐹∗ (𝐶𝑜𝑢𝑡,𝑚𝑖𝑛−𝐶𝑖𝑛,𝑚𝑖𝑛) [𝑚
3/𝑠] [16]
Where I is the stack current, Ncells is the number of cells in the stack, F is Faraday’s constant,
Cout,in are the concentrations of vanadium found from equation (13 and 14).
𝑉 = 𝐸0+ 𝑅𝑇 𝑧𝐹∗ 𝑙𝑛
𝑎𝑅𝑒𝑑
𝑎𝑂𝑥 [v] [17]
The SOC out represents the SOC of where all the vanadium ions will be oxidized, carrying no charge, while flowing through the cell, and therefore exit with a SOC of 0. This “charge less” volume will be re-introduced to the tank changing the tank’s concentration, ctank,and
effectively how much energy is remaining in the battery.
𝑚𝑜𝑙𝑠𝑡𝑜𝑡𝑎𝑙 = 𝑐𝑜∗ (𝑉𝑡𝑜𝑡𝑎𝑙− 𝑉𝑜𝑢𝑡,𝑠𝑡𝑎𝑐𝑘)+ 𝑐𝑜𝑢𝑡∗ 𝑉𝑜𝑢𝑡,𝑠𝑡𝑎𝑐𝑘 [mols] 𝑐𝑡𝑎𝑛𝑘 = 𝑚𝑜𝑙𝑠𝑡𝑜𝑡𝑎𝑙
Were c0 is the initial tank concentration, cout is calculated from equation (14), Vtotal is the
volume electrolyte, and Vout,stack is the outlet volume of the stack is calculated by multiplying
the flow rate by the change in time, Q * dt.
Equation (17) calculates the voltage by using E0 the open circuit potential of the battery, R is
the gas constant 8.314 (L/mol K), T is the temperature, F is Faraday’s constant, z is the number of mols of electrons transferred in the cell, and a refers to the chemical activity of the electrolyte during reduction and oxidation. Equation (17) can be rewritten to related the chemical activity to the state of charge, equation (19),
𝑉 = 𝐸0+ 𝑅𝑇 𝑧𝐹∗ 𝑙𝑛 [ 𝑆𝑂𝐶2 (1−𝑆𝑂𝐶)2] [v] [19] Where SOC = ( 𝑐𝑉2+ 𝑐𝑉2++𝑐𝑉3+) = ( 𝑐𝑉𝑂2+ 𝑐𝑉𝑂2++𝑐 𝑉𝑂2+ ) [-]
SOC is given from vanadium concentration of the tank in reference to the initial vanadium concentration, and since it is dependent upon the still available electrons after Ncell redox
reactions means that the voltage will decline with the changing SOC.
Cell Stack
The power capacity of the battery comes from its stack size. In this case the required power requirement is 200 kW. Therefore, the stack needs to be designed to this specification and can be done by using equation (20).
𝑁𝑐𝑒𝑙𝑙𝑠= 𝑃
𝐼 ∗ 𝑉 [-] [20]
Where P is the power requirement, I is the current flowing through the stack, and V is the voltage from equation (19). Since the voltage is decreasing with time would also mean so does power. If the number of cells was to be determined using the voltage produce at a SOC of 1 would result in too few cells and the stack would not be able to meet the peak power needs. Therefore the average voltage found at a SOC of 50% should be used in order to neither over determine nor under determine the number of cells.
Tank size
The sizes of the tanks in the system are dependent upon the amount of energy needed in the system. The energy potential of the VRB is dependent upon the amount of vanadium in the system. The amount of vanadium needed can be found by using equation (21).
𝑁𝑣 = 𝐼∗𝑡
𝐹∗ (𝑆𝑂𝐶0− 𝑆𝑂𝐶𝑒𝑛𝑑)∗ 𝑁𝑐𝑒𝑙𝑙𝑠 [mol] [21]
Where I is the current, t is the amount of time it takes to discharge, F is Faraday’s constant, SOC0,end are the SOC boundaries at which the battery operates, and Ncells are the number of
cells in the stack. Now that the mols of Vanadium needed are calculated the volume of the tank, Vtank, can be calculated using equation (22), and should be multiplied by 2.
𝑉𝑡𝑎𝑛𝑘= 𝑡∗𝐼∗ 𝑁𝑐𝑒𝑙𝑙𝑠
𝐹∗𝑉𝑐𝑜𝑛 ∗ (𝑆𝑂𝐶0− 𝑆𝑂𝐶𝑒𝑛𝑑) [L] [22]
Where t is the time for discharge, I is the current of the stack, Ncells is the number of cells, F is
Faraday’s constant, Vcon is the concentration of vanadium used, and SOC0,end are the SOC
boundaries at which the battery operates.
Depending upon the SOC boundaries of the battery will also affect the size of the tanks. For example if the SOC is between 0.8 – 0.2, the battery will only be able to utilize 80% of the electrolyte and this will affect the energy of the system because more electrolyte will be needed to meet the demand. Therefore, in this study, it is assumed that the electrolyte is near fully charge at 0.95 and ends at 0.05. This is because it is predicted that there will still be residual discharged vanadium in the VRB during refuelling making a fully charged battery unrealistic. On the other hand, keeping the lower limit at 5% discharge will allow for the system to remain fully functioning.
Pump sizing
One of the bases for the VRB to work is the need for two pumps in the design, one that will pump the anolyte and the other for the catholyte, as seen in figure (3). In any system it is important to size the pump(s) accordingly for an optimum size. Sizing a pump too small could result in a loss of efficiency at the membrane because there is a possibility of proton buildup at too low of a flow rate. Sizing a pump too big could take up needed space in the system as well as could lead to a decrease in efficiency from mechanical losses. Equation (23) was used to determine the power of the pump.
𝑃𝑝𝑢𝑚𝑝= ∆𝑝𝑠𝑦𝑠𝑡𝑒𝑚𝑄 [𝑊] [23]
Where Q is the flow rate from equation (15) and ∆psystem is the pressure drop over the system
and is the sum of the pressure drops in the pipe and stack, ∆pipe and ∆stack respectively
∆𝑝𝑝𝑖𝑝𝑒 = −𝛾 (∆𝑉2
2𝑔 + ∆𝑧 + ℎ𝑓+ ℎ𝑚) [𝑃𝑎] [24]
Where γ is the specific weight, g is the gravitational constant 9.81 m2/s, z is the change in
height, and the head losses, due to friction and minor losses, were calculated using equations (25) and (26). ℎ𝑓,𝑖= 𝑓𝑖(𝐿𝑖 𝐷𝑖) ( 𝑉𝑖2 2𝑔) [m] [25] ℎ𝑚 = 𝑘𝑉 2 2𝑔 [m] [26]
For equation (25), fi is the friction factor and is calculated by using the Darcy friction factor equation (27), which uses the Reynolds number, Re, calculated by using equation (28), L is the length of the pipe and D is the diameter of the pipe and ν is the kinematic viscosity .
𝑓𝑖 = 64
𝑅𝑒 [-] [27]
𝑅𝑒 = 𝑉𝐷
𝜈 [-] [28]
The friction factor in equation (27) is only for laminar flow and if it is determined that the flow is turbulent the Colebrook-White equation (29) should be used.
1 √𝑓𝑖= −2𝑙𝑜𝑔 ( 𝜀𝑖 3.7𝐷+ 2.51 𝑅𝑒√𝑓𝑖) [-] [29]
Where εi is the pipe roughness and a value of the range of 0.001 – 0.002 can be used for
copper, lead, brass, and aluminium (EngineeringToolBox).
The pressure drop in the stack was calculated similarly, but the diameter this time is the hydraulic diameter and was calculated using equation (30).
𝐷 = 4∗𝐴𝑝 [m] [30]
Where A is the cross sectional area of the stack and p is the perimeter.
With the pressure drops in the pipes and stack known equation (23) can be used to determine the power requirements of the pump, and should be multiplied by 2 since there are two pumps needed in the system.
4
SIMULATION AND RESULTS
After the initial calculations outlined in section (3) it was then possible to optimize the VRB sizing by finding the minimum number of cells to allow for the maximum amount of
electrolyte in 3 m3 and thus meeting the peak power demand of 200 kW and max energy
capacity. As mentioned, two models were designed; the first model determined the
appropriate number of cells and volume for a 200 kW VRB at constant current and flow rate and is discussed below in section 4.1. The reason for having two models is that model 1 will determine the size of the system: number of cells, electrolyte volume, and pump power for a system that requires a constant power of 200 kW. This is done at constant current, which is a common practice for testing batteries, (Megger, 2009), determining as to what flow rate results in a higher energy capacity. Model 2 will use the system parameters calculated from model 1 and simulate conditions applicable like partial loads, which will require the ability of the model to calculate different flow rates and current.
Model 1 – Constant Current and Flow Rate
The first part of the model looks at finding a constant flow rate, which allows for maximum energy capacity, to run the battery at with the parameters in table (6). The flow rate affects the number of reactions occurring in each half-cell and subsequently the SOC over time because with a higher flow rate the number of electrons at the electrode will increase. Since the tank concentration remains unchanged, in regards to the concentration changing in the stack, means that the change in SOC remains substantially small and therefore it is assumed that the transient behavior of the discharge process can be simplified as a steady-state process (Q. Xu, 2013). The flow rate also affects the required pump power, and it is to be determined at what flow rate leads to the least amount of leaching from the battery in order to power the pump.
A voltage profile at each varying flow rate through the complete discharge of the VRB was used to find an average voltage. This voltage was then used to determine the number of cells needed for the battery. Then by using the amount of time taken to discharge the volume was found. In the following subsections the process of determining the parameters of flow rate and pumps, cell stack, power, volume, energy, and efficiency are discussed.
Table 6 : Design Parameters for 200 kW VRB.
Design Parameters
Concentration of Vanadium (M) 1.6 Concentration of H2SO4 (M) 5
Electrolyte Density (kg/m3) 1200
Cross sectional area of cell (m2) 1
Current Density (mA/cm2) 300
Power Capacity (kW) 200
SOC Limits 0.05≤SOC≤0.95
Flow rate and Pumps
The VRB was designed under a constant flow rate so that the flow of electrons across the membrane remains constant. However it was of interest to see if there were any performance gains from increasing this flow rate across the cell. The base flow rate started out at being the minimal flow rate determined from equation (16) and multiples of this was used to determine how the increase in electron flow affects the batteries performance.
Using a numerical approach through a series of loops and iterations in MATLAB a range of flow rates were calculated to determine if there is a flow rate that can be used while not reducing the efficiency of the battery due to increasing power requirements to the pump. This was done by using the average voltage through the discharge cycle for each flow rate to determine the maximum power capacity, which also represents the voltage at 50% SOC. Using the average voltage, as prescribed before, for the design process insures that the
average power of the battery will be 200 kW. This is because as the battery discharges the voltage is dropping and since a constant current is being used will result in the power dropping through the cycle.
When the flow rate is increased the subsequent effect is that there are fewer reactions happening allowing for an increase in initial power output, but as it was shown in equation (16) that the increase in flow rate will cause more reactions to take place over time and therefore driving the SOC down more quickly while maintaining a constant load of 200 kW. By accounting for the additional mechanical power from the pumps for each flow rate shows that there is an optimal flow rate. Figure (8) shows that there is an optimal flow rate at 5 times that of the minimum flow rate, 1.27 L/sec and equates to 6.35L/sec. At this flow rate the power needed to run the pumps is at a maximum and if the flow rate was to be increased from this point a decrease in the power capacity of the battery would be seen.
0 5 10 15 20 25 30 35 40 45 50 -2000 -1500 -1000 -500 0
max power for each flow rate minus pump power
multiple of flow rate
p o w e r (k W )
Figure 8: Optimal Flow Rate.
The effects of flow rate has a significant effect on power output and this can be seen in figure (9), which shows the power generated through discharge cycle of the battery for the
minimum flow rate and optimal flow rate, 5 times that of the minimum flow rate, for a 200 kW VRB.
Figure 9: Effects of Flow Rate.
It can be seen that by increasing the flow rate will also decrease the time of discharge for the battery and effectively decrease the energy potential of the battery. Research done by (Abdul-Yima, 2010) showed that an increase of flow rate above the minimum flow rate increases convection transport of heat from the electrodes to the surrounding battery, which could possibly raise the temperature to unacceptable levels under a heavy load. The increase in heat affects the electrodes and effectively decreases the cell voltage during discharge. The optimal flow rate proved to actually be not optimal because it results in a faster discharge time and lower energy density. Therefore, the flow rate used for the battery remained to be the minimum flow rate of 1.27 L/second, which resulted in a discharge time of 39.39 minutes. This also made it possible to minimize the mechanical power losses to the pump thus
increasing the efficiency of the overall system.
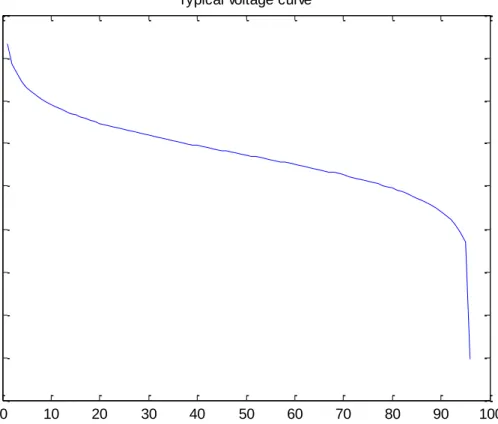
Cell Stack
The power capacity of the battery is dependent upon the number of cells in the stack. An average discharge voltage was determined by taking the average of all voltages through the discharge cycle and then used to determine the number of cells needed. Figure (10) shows how the voltage changes as the battery discharges in one cell, which means that the power output also decreases because the current is constant and power = V * I.
0 10 20 30 40 50 60 0 50 100 150 200 250
Power at varying flow rate
time (min) P o w e r (k W ) Qmin Qmin * 5