IN
DEGREE PROJECT COMPUTER SCIENCE AND ENGINEERING, SECOND CYCLE, 30 CREDITS
,
STOCKHOLM SWEDEN 2016
Statistical Analysis of
Conductor-Musician
Interaction
With a Focus on Musical Expression
JOSEFIN AHNLUND
Statistical Analysis of Conductor-Musician
Interaction
With a focus on Musical Expression
JOSEFIN AHNLUND jahnlund@kth.se
Master Thesis in the field of Machine Learning
Performed at Computer Vision and Active Perception (CVAP), KTH Supervisor: Hedvig Kjellström
Abstract
The kind of interaction occurring between a conductor and musicians while performing a musical piece together is an unique instance of human non-verbal communication. This Musical Production Process (MPP) thus provides an interesting area of research, both from a communica-tion perspective and by its own right. The long term goal of this project is to model the MPP with machine learning methods, for which large amounts of data are required. Since the amount of data available to this master thesis stems from a single recording session (collected at KTH May 2014) a direct modeling of the MPP is unfeasible. As such the thesis can instead be considered as a pilot project which examines pre-requisites for modeling of the MPP. The main aim of the thesis is to investigate how musical expression can be captured in the modeling of the MPP. Two experiments, as well as a theoretical investigation of the MPP, are performed to this end. The first experiment consists of a HMM classification of sound represented by expressive tone parameters extracted by the CUEX algorithm [11], and labeled by four emotions. This experiment complements the previous classification of conducting gesture in GP-LVM representation performed by Kelly Karipidou on the same data set [10]. The result of the classification implicitly proves that expression has been transferred from conductor to musicians. As the first experiment considers expression over the musical piece as a whole, the second experiment investigates the transfer of expression from con-ductor to musician on a local level. To this end local representations of the sound and conducting gesture are extracted, the separability of the four emotions are calculated for both representations by use of the Bhattacharyya distance and the results are compared in search for cor-relation. Some indications of correlation between the representations of sound and gesture are found. The conclusion is nevertheless that the utilized representations of conducting gesture do not capture musical expression to a sufficient extent.
Referat
Statistisk Analys av Interaktion mellan Dirigent och
Musiker
Interaktionen mellan en dirigent och musiker under ett musikframfö-rande är en unik instans av mänsklig icke-verbal kommunikation. Den-na “musikproduktionsprocess” (MPP) utgör därför ett intressant forsk-ningsområde, både ur ett kommunikationsperspektiv såäl som i sin egen rätt. Det läwngsiktiga målet med detta projekt är att modellera MPP:n med maskininlärningsmetoder, vilket skulle kräva stora mängder data. Då den tillgängliga datamängden härstammar från ett enstaka inspel-ningstillfälle (KTH, maj 2014) är en direkt modellering av MPP:n inom detta examensarbete ej möjlig. Arbetet bör istället betraktas som ett pilotprojekt som undersöker förutsättningar för att modellera MPP:n. Huvudfokuset för detta examensarbete är att undersöka hur musikaliskt uttryck kan fångas i modelleringen av MPP:n. Två experiment och en teoretisk utredning av MPP:n utförs i detta syfte. Det första experimen-tet utgörs av HMM-klassificering av ljud, representerat av expressiva tonparametrar framtagna genom CUEX-algoritmen [11] och uppmärkt med fyra olika känslor. Detta experiment kompletterar den tidigare ge-nomförda klassificeringen av dirigentrörelse i en GP-LVM representation av Kelly Karipidou på samma datamängd [10]. Resultatet av klassifi-ceringen bevisar implicit att musikaliskt uttryck överförts från dirigent till musiker. Då det första experimentet undersöker musikaliskt uttryck över musikstycket i sin helhet är målet för det andra experimentet att undersöka överföringen av musikaliskt uttryck från dirigent till musiker på en lokal nivå. För detta syfte tas lokala representationer för ljud och dirigentrörelse fram, separabiliteten mellan de fyra känslorna kalkyleras via Bhattacharyya avståndet och resultaten jämförs på jakt efter korre-lation. Vissa indikationer på korrelation mellan representationerna för ljud och dirigentrörelse kan iakttas. Slutsatsen är dock att de tillämpade representationerna för dirigentrörelse inte fångar musikaliskt uttryck i tillräckligt hög grad.
Contents
1 Introduction 1
1.1 The Musical Production Process . . . 1
1.2 Project Context and Description . . . 2
1.2.1 Focus of the Project . . . 3
1.2.2 Practical Applications . . . 3 1.3 Contributions . . . 4 1.4 Ethical Considerations . . . 4 1.5 Relation to Education . . . 5 1.6 Outline . . . 6 2 Previous Work 7 2.1 The Virtual Orchestra Concept . . . 7
2.1.1 Generating Expressive Sound . . . 9
2.2 The Virtual Conductor Concept . . . 10
3 The Musical Production Process 11 3.1 The Role of the Conductor . . . 11
3.1.1 Controlling of Tempo . . . 12
3.1.2 Capturing the Physical Expression of the Conductor . . . 12
3.2 The Role of the Orchestra . . . 13
3.3 The Interaction . . . 14
3.3.1 Limitations of Previous Systems . . . 15
3.4 Modeling the Musical Production Process . . . 16
3.4.1 The Mapping from Gesture to Sound . . . 16
3.4.2 The Mapping from Sound to Gesture . . . 17
3.4.3 Generating Expressive Sound . . . 17
4 Data and Representation 19 4.1 Representation of Conducting Gesture . . . 20
4.1.1 Baton Representation . . . 20
4.1.2 GP-LVM Representation . . . 20
4.2 Representation of Sound Data . . . 22
CONTENTS
4.2.2 Expressive Tone Parameters . . . 22
4.2.3 Accuracy of the Result . . . 24
5 Exp1: Classification of Emotion in CUEX Space 27 5.1 Method of Classification . . . 27
5.1.1 Training Data and Test Data . . . 28
5.1.2 Clustering of the CUEX Space . . . 28
5.1.3 Assigning Clusters to the Training Data . . . 29
5.1.4 Creating Transition Matrices . . . 30
5.1.5 Creating Observation Matrices . . . 30
5.1.6 Viterbi Algorithm . . . 30
5.2 Results . . . 30
5.3 Conclusions . . . 33
6 Exp2: Local Correlation of Gesture and Sound 35 6.1 Local Representations of Gesture and Sound . . . 35
6.1.1 Labeling of Notes . . . 36
6.1.2 Matching of Tones . . . 36
6.1.3 Finding Corresponding Conducting Sequences . . . 41
6.2 Separation of Emotions in Gesture and Sound . . . 44
6.2.1 The Bhattacharyya Distance . . . 44
6.2.2 BD in CUEX space . . . 45 6.2.3 BD in Gesture Space . . . 47 6.2.4 Visualizations . . . 48 6.3 Correlation Measures . . . 48 6.3.1 Average BD . . . 48 6.3.2 Correlation Matrices . . . 49 6.3.3 Correlation Plots . . . 49
6.3.4 Distance Matrices for Maxima Tones . . . 49
6.4 Results . . . 50
6.5 Discussion of Results . . . 59
6.5.1 Sound Representations . . . 59
6.5.2 Gesture Representations . . . 60
6.5.3 Correlation between Gesture and Sound . . . 61
6.5.4 Limitation of Tonewise Correlation . . . 62
6.5.5 Distance Matrices for Maxima Tones . . . 62
6.5.6 Correlation Plots . . . 62
6.6 Conclusions . . . 65
6.6.1 Reasons for lack of correlation . . . 65
7 Conclusions 67 7.1 Summary . . . 67
7.2 Future Work . . . 68
7.2.2 Further Areas of Interest . . . 69
Bibliography 71
Appendices
A Bhattacharyya Distances
Chapter 1
Introduction
The kind of interaction occurring between a conductor and musicians while per-forming a musical piece together is an unique instance of human non-verbal com-munication. This musical production process thus provides an interesting area of research, both from a communication perspective and by its own right. Through gestures and physical expression the conductor communicates with the musicians and leads the performance of a musical piece in real-time. The gestures them-selves are in part governed by the formal sign language of conducting, and in part an instance of free expression by the conductor. The musicians in the orchestra register and follow (in the best case scenario) the instructions communicated by the conductor’s gestures, and deliver feedback in the form of sound (what we call music). The music feedback will in turn affect the conductor’s future movements, as he shapes the performance in the wanted direction. In short, an interaction in real-time between the two agents: conductor and orchestra, takes place. See Figure 1.1 for a photo of conductor and musicians in action! A short introduc-tion to the musical producintroduc-tion process itself is given below. For readers unfamiliar with the musical terminology, the musical vocabulary available at Naxos website: http://www.naxos.com/education/glossary.asp is recommended.
1.1
The Musical Production Process
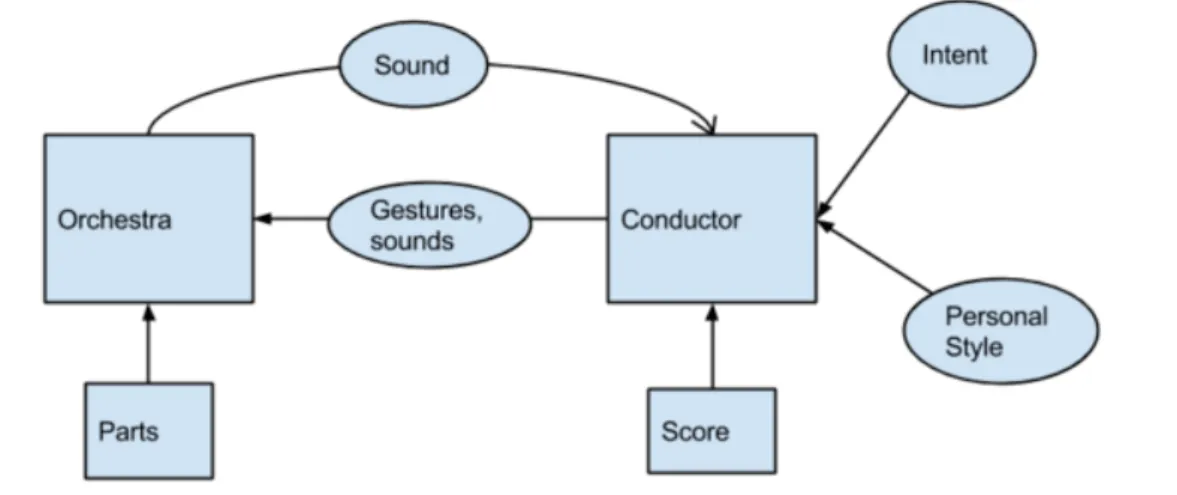
An illustration of the interaction in the musical production process is provided in Figure 1.2. As mentioned, the conductor provides input to the orchestra in the form of gestures, sounds and physical expression and the orchestra delivers feedback to the conductor in the form of sound. This interaction is symbolized in the diagram by the arrows between conductor to orchestra. The gestures of the conductor are further influenced by a number of factors (the incoming arrows to “Conductor” in Figure 1.2). As each musical piece is unique, the set of conducting gestures that it produces is also unique - represented in the figure as the influence of “Score”. Furthermore each conductor has a “Personal Style” to his gestures, and no two conductors perform a gesture exactly the same. As a leader of the musical
CHAPTER 1. INTRODUCTION
Figure 1.1: The Musical Production
Pro-cess in action! Peter Oundjian conducts Toronto Symphony Orchestra at Roy Thom-son Hall, Toronto, June 2014. Source: [13]
Figure 1.2: The whole musical production
process, represented as a block diagram. Ar-rows represent relationships.
performance, the conductor has an “Intention” at each place in the score of how the music should sound - which influences his gestures to express this intention to the musicians. The orchestra in turn is, apart from the stated influence of the conducting gesture, also influenced by score but in the form of their individual notated “Parts” (this is a simplified model of the musical production process where no explicit interaction between musicians in the orchestra is considered).
1.2
Project Context and Description
Ever since the level of technology permitted, various projects have investigated and tried to model this interaction. The goal of these projects have often been to learn some feature of the mapping f (gesture) = sound, that represents how a certain ges-ture maps to a certain sound. As a result it is possible to control the performance of pre-recorded music with gestures as input, benamed as the “virtual orchestra” concept in the continuance of this report. Most commonly, methods are applied to extract the conducted tempo, making it possible to control the tempo of a play-backed musical piece. The mapping from conducting gesture to musical response is in these projects based on prior knowledge about conducting, thus depending on pre-set rules and heuristics to govern the mapping.
Never before has the mapping been learned solely from real-world data in a ma-chine learning context - which is the long-term goal of this project. Large amounts of conducting data with corresponding musical response is needed in order to explore, and learn, the mapping successfully. The amount of data currently available to this project stems from a single recording session, making it possible to explore only a small subspace of the mapping. This can therefore be seen as a pilot project as it investigates the pre-requisites for modeling conductor-musician interaction with machine learning methods.
1.2. PROJECT CONTEXT AND DESCRIPTION
1.2.1 Focus of the Project
While previous projects have modeled more low-level features of the interaction, such as the controlling of overall tempo, the aim of this project is to be able to model more high-level features such as musical expression. It can be argued that the musical expression is at the very core of music itself - and for many practitioners as well as listeners it is the very reason why they practice or listen to music at all. To be able to model the Musical Production Process successfully, the modeling of control of expression is therefore of utmost importance. As described the conductor has an intention about how the music should sound in his mind, that is communi-cated to the musicians through gestural expression. For a working communication the musicians are able to perceive and understand this expression and convert it into musical expression in the sound they produce. The experiments in this master thesis will hence focus on investigating the notion of expression in gesture and sound - how to capture it with suiting data representations and how expression in gesture is transformed into expression in sound through the function f (gesture) = sound. As a part of the same long-term project, an investigation of how to represent ex-pression in conducting gesture was performed in the master thesis “Modelling the body language of a conductor using Gaussian Process Latent Variable Models (GP-LVM)” by Kelly Karipidou prior to this project [10]. In Karipidou’s master thesis high-dimensional data of the conductor’s movement was reduced to a two dimen-sional unit through the use of a GP-LVM. The reduced unit’s ability to represent expression was further measured by performing a classification of the two dimen-sional data labeled by different emotions. As an extension of Karipidou’s work, the first experiment of this master thesis consists of a classification of the same kind - but this time performed on the sound data represented by CUEX parameters [11] (further explained in Chapter 2 and 4)). By comparing results from these two classifications, conclusions can be drawn regarding the general correlation between expression in gesture and expression in sound. The second experiment however fo-cuses on the local correlation between expression in gesture and expression in sound, where local here refers to events occurring at the same point in time. This is done by investigating the local separation of the labeled emotions in the sound as well as the gesture representation. As a further independent part of this master thesis, a the-oretical investigation of the Musical Production Process itself is performed, where important aspects of the process and conditions for modeling it successfully are pre-sented. The result of the experiments and the theoretical investigation brings the long-term goal one step closer, as it reveals important pre-requisites for modeling the Musical Production Process successfully with machine learning methods.
1.2.2 Practical Applications
Once accomplished, a model of the Musical Production Process could have at least three different areas of use:
CHAPTER 1. INTRODUCTION
• An orchestra simulator - where conducting students or laymen can practice their conducting skills with a virtual orchestra
• A conductor simulator - where a conductor model could for example be trained on a famous conductor no longer among us, say Herbert von Karajan, to determine his personal style of conducting. The model could then generate a virtual conductor conducting in the style of Karajan, to be followed by an orchestra.
• An analysis tool - where the interaction of a real conductor and orchestra could be recorded and analysed by the model - for example to determine when and why communication fails between the two. This could be used as a tool in conductor training.
1.3
Contributions
The three main contributions of this thesis are:
• A theoretical investigation of the Musical Production Process, which aims to understand the components of the process itself and outline factors to take into account in order to successfully model it.
• A classification of data in the sound representation which complements the classification of conducting gesture performed by Karipidou in [10]. The result implicitly proves that musical expression was communicated from conductor to musicians.
• An analysis of local correlation between the conducting gesture and sound rep-resentation, in terms of communicated expression. Methods are developed to a) extract local representations for sound and conducting gesture b) measure expressive features in the representations and c) compare the results between sound and conducting gesture in search of signs of local correlation between the two.
Additional contributions includes creation of:
• A method for labeling of notes in a score that facilitates continuous tracking of beats.
• An algorithm for matching of segmented tones to the labeled notes in a score based on pitch and relative onset.
1.4
Ethical Considerations
The project touches on several ethical aspects. As mentioned, to achieve the long term goal and successfully model the Musical Production Process, large amounts
1.5. RELATION TO EDUCATION
of data must be collected. During the collection the output of real musicians and conductors will have to be recorded. Since the source of data is real people, care must be taken to perform the collection and handle the data ethically. Another ethical concern is what effect this model, if achieved, would have on the musical community itself. Would a well performing orchestra simulator be a rival to real orchestras, possibly causing them to go out of work? Is it ethically motivated to replace the intrinsically human activity of performing music together with a partly automated element? And is it at all possible to achieve a model that is perceived satisfactory to performers and listeners, or is the human interaction such an important part of the process that it can not be replaced? The author of this thesis believes that it, as with so much regarding technology, comes down to how the developed technology is being utilized. The ethical stance of the author is that a model of the Musical Production Process should not be developed with the goal of replacing the human interaction of music performance, but to work as a complement to the very same. As the human interaction taking place in the musical production process is highly complex and interesting from a communication perspective - it is believed that a successful model of the same interaction could prove ground breaking for the AI community as a whole. If methods are developed that manages to model this interaction in a satisfactory manner, the obtained knowledge could be utilized in many other research areas regarding communication and interaction. To answer the questions raised above, the author believes that the human interaction in orchestral music performance is such an important part of the experience itself that it can never be fully rivaled by an automated system. An automated system could however constitute an interesting concept in its own - providing entertainment or educational value to users. And as stated earlier, last but not least, a model that replicates the complex human interaction taking place in music performance would provide important general knowledge regarding modeling of interactive and communicative processes that could be transferred to other problems.
1.5
Relation to Education
Many parts of this project relates directly to my education, which includes a Bach-elor in Engineering Physics and a Master in Machine Learning at KTH. Examples of this:
• The project is implemented in Matlab, a programming language which I am familiar with from several courses and projects. Among them courses in Nu-merical Methods, Computer Vision and Physics.
• In the first experiment a Hidden Markov Model is implemented, a concept which I learned about in Artificial Intelligence and Cognitive Systems (ex-change course at Karlsruhe Institute of Technology) among others.
• In the second experiment the Bhattacharyya distance for multivariate distribu-tions is calculated requiring understanding of matrix algebra and probability
CHAPTER 1. INTRODUCTION
distributions, learned in courses about Linear Algebra and Probability Theory among others.
• In the second experiment a Principal Component Analysis (PCA) is per-formed, a concept which was introduced in course Machine Learning.
1.6
Outline
The report is continued with a presentation of Previous Work within the field in Chapter 2, followed by a theoretical investigation of the Musical Production Process in Chapter 3. After a review of the Data used in this project in Chapter 4, the two experiments “Classification of Emotion in CUEX space” and “Local Correlation of Gesture and Sound’ are further explained in Chapter 5 and 6. Here the method, results and conclusions of the respective experiment is presented. The report is concluded with a Summary and proposal of Future Work in Chapter 7.
Chapter 2
Previous Work
In this chapter a time-line of previous projects in the area is presented. The works will later be put into relation to this project in the chapter The Musical Production
Process.
2.1
The Virtual Orchestra Concept
Numerous systems which aim at recognizing conducting gestures, and generating corresponding musical response, have been developed in the last 50 years. A pi-oneering work is the “Radio Baton” with its corresponding “Conductor Program” system, presented in a paper by Max V. Mathews in 1977. In this system a baton is equipped with low-frequency radio transmitters whose signals are received by an array of antennae. The three-dimensional position of the baton is determined and trigger points, which typically corresponds to conducting beats, are detected and transferred to the Conductor Program, together with the continuous three-dimensional gesture. By also specifying trigger points in the MIDI music file which is to be performed, the playback of the file is adjusted so that trigger points from the baton are synchronized with trigger points in the MIDI [1]. The effect is a system where the tempo of a pre-determined musical piece can be controlled by the gestures of a conducting baton.
In 1996 Teresa Marrin developed the “Digital Baton”, a device with eleven sen-sory degrees of freedom. An infrared LED tracking system provided the three-dimensional position of the baton, accelerometers provided the three-three-dimensional acceleration and five pressure sensors provided information about the finger and palm pressure of the user holding the baton [2]. The corresponding software which generated the musical response did not make use of traditional conducting gestures, but developed its own mapping between gesture and sound where higher-level fea-tures in the music could be controlled [5].
CHAPTER 2. PREVIOUS WORK
Japanese researchers Satoshi and Mochida proceeded the next year with an elabo-rate attempt to model the tempo-controlling aspect of conducting, described in “A conducting recognition system on the model of musicians’ process” [3]. A baton is equipped with two accelerometers to detect vertical and horizontal acceleration components. The accelerometers detect right hand conducting gestures and based on this data beat timing (the system supported detection of 1-beat through 5-beat), as well as beat number within the measure, are recognized through a system of pre-trained HMMs. Based on the detected beat input, the tempo of a MIDI music file is controlled. In the system, the recognition process tries to mimic the recognition of a real musician where beat occurrence expectation, given playing tempo and position in score, is an influencing factor.
Again one year later, Tommi Ilmonen tracked conducting gestures with the help of an Artificial Neural Network (ANN) in his master thesis “Tracking conductor of an orchestra using artificial neural networks” [4]. Using a magnetic tracker for motion tracking, fixed on the conductor’s upper body, position and velocity of the conducting gesture is detected and used as input to a multi layer perceptron (MLP). The MLP is trained to output the beat phase of the conducting gesture, which in turn is used to play back a score in the detected tempo. Additionally, simple dy-namic of the score is controlled by heuristic rules on the detected conducting gesture. In 2002 Teresa Marrin presented the sequel to her previous conducting device the Digital Baton, namely the “Conductors Jacket”, further explained in the paper “Synthesizing Expressive Music Through The Language of Conducting” [5]. The Conductors Jacket is a sensor interface in the form of a fitted shirt that contains one respiration sensor and seven EMG sensors, measuring the muscle tension of the wearer in biceps, forearm extensors, hands and the right shoulder. After pre-processing and filtering, beat detection and spectral analysis is performed on the electrical signals from the sensors. Through a set of manually configured mappings the processed signals can be used to control tempo, cutoffs, note-level dynamics and Articulation of a musical piece. The mapping between gesture and sound is learned manually by applying a hypothetical algorithmical mapping and letting performer and audience decide if it “sounds right and intuitive”. This results in an interface where many aspects of musical performance can be controlled - but where the conducting gestures do not necessarily correspond 100% to traditional conducting gestures. The purpose of the Conductors Jacket is thus to use the basis of the conducting technique to develop an “instrument” where computer music can be controlled expressively - rather than modelling the conducting technique itself. Next came “Personal Orchestra”, an exhibit and interactive conducting experience developed for the “House of Music Vienna” in 2004, described further in “Personal Orchestra: a real-time audio/video system for interactive conducting” [6]. Here the movements of an infrared baton control tempo, volume and emphasis on orches-tral section of a pre-recorded musical piece performed by the Vienna Philharmonic.
2.1. THE VIRTUAL ORCHESTRA CONCEPT
Vertical turning-points of the baton are considered beats and control the tempo, whereas vertical gesture size controls overall dynamics. Horizontal direction indi-cates that the orchestral section at this position should be raised above the others. Because of the musical piece being an instance of real and not synthesized music, the system relies on pre-stretched audio tracks in order to control tempo of the performance.
Later the same year, the creators of Personal Orchestra teamed up with Teresa Marrin to create a similar conducting exhibit for the Children’s Museum in Boston, described in “You’re the conductor: A realistic Interactive Conducting System for Children” [7]. With the specific target group being children with no pre-supposed knowledge about conducting gestures, the controlling gestures had to be more gen-eral in character. The x and y coordinates of a robust infrared baton is registered by a camera, and the detected gesture effects the playback of a pre-recorded musical piece performed by the Boston Pops Orchestra. Gesture speed
√
(dxdt +dydt) controls the overall tempo of the performance and gesture size (determined as the distance between subsequent baton turning points) controls the overall dynamics. In this project the audio track is stretched in real-time with a Phase Vocoder Algorithm, which allows for a higher resolution in available tempi than for Personal Orchestra. A different approach was taken by Anders Friberg in 2005, where control of higher-level musical expression was explored in “Home conducting - Control the overall musical expression with gestures” [8]. In the system, gestures are captured by a simple webcam and recognized by tools available in the software platform EyesWeb. The recognized gestures are further mapped to semantic expressive descriptions, de-veloped within the project MEGA, thus aiming to capture emotional expression of the gestures. The semantic descriptions are thereafter used as input in pDM, a rule system for music performance which has support for emotional expression. Given the recognized “emotion” in the gestures, the music performance is being altered to express this emotion. When previous systems have focused on recognizing low-level features of conducting, such as control of tempo and dynamic, this system aims directly at the higher-level feature of emotional expression - however the input ges-tures are not restrained to traditional conducting gesges-tures. Since conducting is a special case of general gesture, subdued to certain constraints, it might not be the case that emotional expression in conducting gesture is recognized as well as emo-tional expression in general gesture. Furthermore, if the goal is to model conducting in itself, the control of lower-level features such as tempo and dynamic is essential. The Home Conducting system does however break interesting and new ground in the area of controlling emotional expression of music with gestures.
2.1.1 Generating Expressive Sound
In the virtual orchestra concept, real-time conducting gestures are used to con-trol recorded or synthesized music. As discussed above, the concon-trol of
pre-CHAPTER 2. PREVIOUS WORK
recorded music requires some sort of interference with the audio track - such as time-stretching algorithms to control tempo. In the case of synthesized music, that is, where each tone of the audio is software generated in real-time as a response to the incoming conducting gesture, the abilities of expressive control can be greater if the right tools are used. In order to control higher levels of expression in the music, apart from overall volume and tempo, the music itself must be describable and quantifiable in expressive parameters.
One assembly of such expressive parameters was proposed in 2007 by Anders Friberg et al. in “CUEX: An Algorithm for Automatic Extraction of Expressive Tone Pa-rameters in Music Performance from Acoustic Signals” [11]. The concept of the CUEX algorithm is to first detect onset and offset for individual tones in the acous-tic signal, and secondly to compute expressive tone parameters for each of these detected tones. The parameters describe the tempo, sound level, articulation, onset velocity (also referred to as “attack”), spectrum, vibrato rate and vibrato extent for each tone in the performance. The CUEX parameters play an important role in this project and will be further explained in section 4.
2.2
The Virtual Conductor Concept
While the problem of building a human-conducted virtual orchestra has been ex-plored by various systems through the years, the reverse problem of creating a virtual conductor followed by human musicians is relatively unexplored [9]. One attempt at this problem is explained in the paper “Teaching Robots to Conduct: Automatic Extraction of Conducting Information from Sheet Music.” from 2014 [9]. In this system, a score is represented in the MIDI file format which, apart from evident features such as tone pitch and tone length, also supports informa-tion about tone dynamic, ensemble dynamic, tempo and time signature. A MIDI parser is consequently developed, which converts the parameters in the MIDI file to requests for conducting gestures. The conducting gestures are embodied by four different types of robots, two humanoid and two non-humanoid. For the humanoid robots, traditional conducting gesture is to some extent used to present the score to the musicians, whereas the non-humanoid robots instruct the musicians using al-ternative representations such as colour bars and numbers. The system is however lacking the most important feature of the musical production process - the interac-tion between conductor and musician. Since the robotic conductors cannot hear the response from the musicians, the process becomes one of a one-way communication. To integrate the interactive component in the model is certainly a challenge, but one we hope that the long-term goal of this project will achieve.
Chapter 3
The Musical Production Process
In this chapter a theoretical investigation of the Musical Production Process itself is carried out. The roles of the conductor and orchestra, and the interaction between them, are discussed. Limitations of previous systems and factors connected to modeling of the process are pointed out. The diagram of the Musical Production Process is once again included in bigger format in Figure 3.1.
3.1
The Role of the Conductor
The role of the conductor in the musical production process can be divided into two functions. Since an orchestra consists of a large number of musicians, it normally needs a common synchronizing device in order for all individual musicians to be able to play in phase with each other. The first function of the conductor is hence to make up this synchronizing device, which through his gestures governs the orchestra into one synchronous performance. But apart from mere synchronization, the conductor is also the artistic leader of the performance. The second function of the conductor is therefore to, through his gestures, deliver a musical interpretation of the score to the musicians and govern the musical aspect of the performance. Lastly it must be stated that these two functions are not completely distinct from each other, as the same gesture typically addresses both issues without a clear distinction between what part belongs to synchronization and what to musical expression. The most important part in the first function is synchronization of overall tempo. It is in this area that the conducting language is most formalized. The gestures for controlling tempo are to a high extent learned in conducting education, and are standardized (even if each conductor has their personal version of how they look). Whereas the gestures to communicate musical expression are less standardized and more free, even if there exists some general guide-lines even here (for example raising your hand might mean raise the sound level and lowering it might mean lower the sound level - these expressive gestures however correlates greatly with general human gestural expression and what it means). It therefore makes sense to separate these two functions when approaching to model the conducting gesture.
CHAPTER 3. THE MUSICAL PRODUCTION PROCESS
Figure 3.1: Diagram over the Musical Production Process as it is considered in this project.
For an explanation of the blocks and arrows see Section 1.1.
3.1.1 Controlling of Tempo
The first function includes setting the overall tempo and communicating it, as well as providing entrance cues for particular instruments when they are supposed to play. This is in the continuation of the report referred to as the controlling of macro tempo. Other features of tempo such as
• tempo changes (e.g. ritardando or accelerando) • fermata and (in some cases) individual tone lengths • rythmical figures
• phrasing
are in the continuation of the report referred to as controlling of micro tempo. Macro tempo is controlled through the gesture of a beat pattern, with which the conductor signals to the orchestra when individual beats are to take place.
3.1.2 Capturing the Physical Expression of the Conductor
While conducting the conductor expresses his musical intentions with his whole body, where arm and hand gestures as well as facial expression are the most in-formative channels of expression. Other signals that the conductor sends to the orchestra can be through sounds, typically no sounding voice is used during a per-formance, but sounds of respiration might be used as a complement to gestures. To capture the whole expression of the conductor, the physical output must be recorded on a very detailed scale - as even visible muscle tensions and facial ex-pressions might signal important information. However projects aiming to model
3.2. THE ROLE OF THE ORCHESTRA
the conducting gesture have previously chosen to focus on one or some channels of this output. The reasons are partly practical, as it requires a multitude of different technology to capture facial expression, muscle tension, respiration and gestures at the same time. For the conductor to be connected with technology through every channel of expression might also disturb the conducting itself, physically and psy-chologically. But the reasons are also data oriented - the more channels of input, the higher complexity of the conducting data and difficulty to process and understand it. As such it is an important task to single out the dimensions of the conductor’s output that are most important for the task. If the task is modeling of tempo, the arm and baton gestures are typically fundamental, whereas modeling of expression might require more fine-level dimensions of output such as facial expression. The data used in this project captures the movement of the conductor’s upper body and as such an important part of his gestural output. However the lack of capturing of facial expression and finer hand movement reduces the level of musical expression contained in the data, which is a limitation.
3.2
The Role of the Orchestra
As mentioned in Chapter 1, the interaction within the orchestra is an important factor in the Musical Production Process. Even though the conductor is the com-mon synchronizer, the musicians have to synchronize their playing with each other. In order to achieve this, a strict hierarchy is implemented in the orchestra, with designated leaders and vice-leaders of each instrument section. The leader of the violin section is thereto the concertmaster, which means the leader of the whole orchestra. Even while following this structure it is not trivial to make up to 100 individual musicians play as one unit, and even in well-trained orchestras it happens that the playing gets out of synch.
As already stated it is part of the conductor’s role to communicate his musical interpretation of the score to the musicians, and it is part of the musicians’ roles to follow it. This musical interpretation does however not contain every detail of how individual instruments are supposed to play - thus leaving space for “local interpretations” for individual musicians of their parts of the score. These inter-pretations should be in line with the global interpretation of the conductor - but since all details are not specified there is also room for personal expression for in-dividual musicians. The interaction between musicians within the orchestra, and the musical interpretations of individual musicians, are however not considered in this project. It is believed that this interaction will have to be modeled separately as the complexity while modeling the interaction between conductor, orchestra and within orchestra at the same time might be too high.
CHAPTER 3. THE MUSICAL PRODUCTION PROCESS
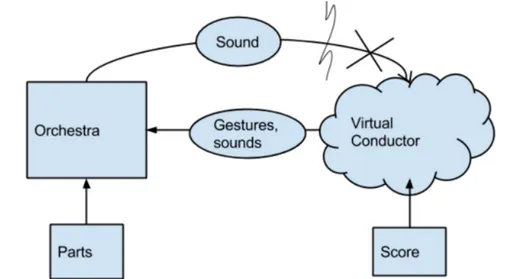
Figure 3.2: Illustration of the virtual conductor concept. The lack of interaction is
repre-sented in the image by breaking the feedback arrow of sound from orchestra to conductor.
3.3
The Interaction
The most important insight is perhaps that the conductor-musician interaction is essentially an instance of human communication. The interaction is dynamic and occurs in real-time - causing the performance of the same piece, with the same con-ductor and musicians - to be a new experience every time. The concon-ductor has the task to lead the orchestra, and looking at it from a temporal perspective, lays one step ahead in time. In order for the musicians to register and react to the conduc-tor’s movements they have to be prior in time. This causes the well-known “lag”; where the orchestral response corresponding to a certain conducting gesture comes later in time. Exactly how long the lag is varies between conductors, and between orchestras, and is something that is worked out automatically and dynamically be-tween a certain conductor and orchestra during the rehearsal work of a musical piece. The length of the lag can also change dynamically over the traversal of a musical piece, where fast tempo generally requires a shorter lag than slow tempo [3]. Moreover sudden changes need to be addressed in good time before they occur, while long sections of homogeneous music with little change can cause the lag to almost disappear (the conducting gestures and the musical response synchronizes itself temporally) [23].
The fact that the orchestral response lies later in time does however not make it a one-way communication (from conductor to musicians only), but the feedback of the orchestra in its turn influences the conductor and his movements. The pro-cess is in its essence one of true interaction where the influence from one agent on the other can not be overlooked.
3.3. THE INTERACTION
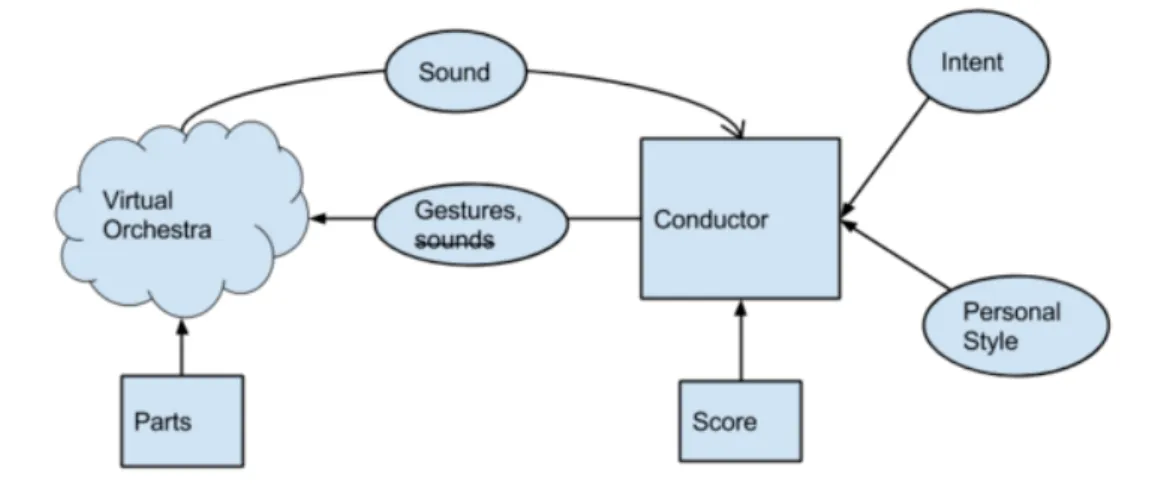
Figure 3.3: Illustration of the virtual orchestra concept. There is, to the authors
knowl-edge, no system which includes the conductor’s sounds as an input to the orchestra - hence “sounds” is overcrossed in the arrow from conductor to orchestra. Even though the system is in some sense interactive (the human conductor hears the sound the virtual orchestra creates and can respond to it), in most realisations the gesture recognition is very limited when compared to the recognition for a real musical production process.
This interaction is perhaps the most complex, and most interesting, feature of the musical production process. It is also the feature that is hardest to model - and previous work in the area has in one or the other way lacked the ability to model the complete interaction between conductor and musician.
3.3.1 Limitations of Previous Systems Virtual Conductor
Previous robot conducting systems have yet not been able to provide feedback to musicians [3], since they do not take the musical response into consideration. The generated virtual conductor has lacked the ability to include the sound of the orchestra as input - thus making the process non-interactive. This is illustrated in Figure 3.2.
Virtual Orchestra
In conducting recognition systems, the system typically recognizes gestures provided by a human conductor in order to generate synthesized music corresponding to the gestures. This is illustrated in Figure 3.3. Since the generated music is audible to the human conductor, the musical response feedback works in this system. In all previous systems, the recognition of the conducting gestures is however severely limited. In no system is control over macro tempo and overall dynamic, as well as micro tempo and note-level dynamics, possible (see Figure 3.3). In the pioneering
CHAPTER 3. THE MUSICAL PRODUCTION PROCESS
system “The Radio Baton” macro tempo and some micro tempo aspects such as tone length are controllable. In many systems macro tempo and overall dynamics are controllable [6], [7], [4], [3]]. For some systems, focus has been on controlling micro tempo as well as note-level dynamic [8], [2], [5] thus providing a higher level of expressive control. In the Home Conducting system however, the input is general gesture and not necessarily conducting gesture [8]. In Digital Baton [2] and Conduc-tors Jacket [5] the aim is indeed to model conducting gestures, but the mapping of conducting gesture to music is made manually. In order to perform well with these tools, one has to learn to control this special version of conducting movements well - and it does not necessarily correspond to the gestures of a real conductor. In this sense, these systems are more similar to instruments in their own right, rather than realistic conduction models.
3.4
Modeling the Musical Production Process
As mentioned in the Introduction, the long term goal of this project is to model the MPP with machine learning methods. That means, to learn the mapping from gesture to sound f (gesture) = sound automatically by revealing and picking up patterns from large amounts of visual conducting data with corresponding sound.
3.4.1 The Mapping from Gesture to Sound
Firstly the mapping between conducting gesture to musical response must be found. A conducting gesture should furthermore always be understood in the context of the score it is performed upon, causing the mapping to be characterized as:
f (gesture, score) = sound (3.1)
This mapping is complex and depends on a number of variables. The conductor’s personal style will cause conducting of the same musical piece to look different be-tween conductors - and the conductor’s intention might even cause the conducting of the same musical piece to look different from day to day for the same conductor. This must be accounted for, which is shown in the model of the Musical Production Process with influencing parameters “Intention” and “Personal Style” in Figure 3.1. In order to account for the above dependencies, data must be collected for dif-ferent conductors and different musical pieces. If not the model would learn a specific conductor’s personal style rather than the general mapping from gesture to sound, which is the “lowest common denominator” between all conductors. In the same way different musical pieces must be recorded, in order to not only learn the relationship between conducting gesture and sound for that particular score. As stated in the Introduction an important feature of the model is to be able to represent musical expression - accounting for the parameter “Intention” mentioned above. This aim goes beyond what previous projects in the virtual conductor field
3.4. MODELING THE MUSICAL PRODUCTION PROCESS
have achieved, as explained in the section about their limitations above. In order to succeed with this aim, investigations about what representations that best cap-ture musical expression have to be performed - which is partly accomplished in this thesis.
3.4.2 The Mapping from Sound to Gesture
As mentioned, the previous projects in the virtual conductor field has lacked ability to use the sound as input. An issue is of course that the performance is driven by the conductor timewise, that is, that the conducting gestures come slightly earlier in time than the corresponding sound. However, when considered in the inverse di-rection, the conducting gestures are formed as a reaction to the sound just previous to now, as the conductor tries to shape the performance in the intended direction. For example, if the sound of the orchestra in the previous instant of time is per-ceived too loud by the conductor, his gestures will be formed to express lowering the volume. A suggestion of how the virtual conductor concept could be made interactive, i.e. how influence of sound could be taken into account when forming virtual conducting gestures, is therefore to learn the following modification of the mapping:
f (scoret, soundt−1) = gesturet (3.2)
That is, how is the score at the actual point of time (the score that is to be expressed by the conductor), together with the sound at the previous point of time, influencing the conducting gesture? If this mapping is learned from enough available conducting data with corresponding sound data, it can be used to generate an interactive virtual conductor. In real-time performance both scoret and soundt−1 is available, since the sound previous to now can be recorded. By using these parameters as input in the learned mapping, generation of gesturet in real-time is made possible.
3.4.3 Generating Expressive Sound
When the mapping of conducting gesture to musical response is learned comes - in the case of a virtual orchestra - the challenge to generate this musical response as sound. In this project the sound data is represented with six CUEX parameters (described further in Data and representation in Chapter 4). If the mapping of gesture to CUEX parameters is learned directly they can, together with the score, be used to generate expressive tones as output. In a real-time user session, gestures from the user would be detected and processed through the mapping - outputting values of the CUEX parameters as a result. These values, together with the pro-vided pitch and tone length from the score, could thereafter be used to generate an expressive tone as response to the gestural input [22]. This possibility to modulate each individual tone with six degrees of freedom makes a detailed musical version of a score possible - but may be too low-level to give good results and perhaps too stale to invoke more emotional concepts of music.
Chapter 4
Data and Representation
Figure 4.1: The four emotions 1. Tender, 2. Neutral, 3. Passionate and 4. Angry
positioned in a Valence (y) Arousal (x) Space. [10]
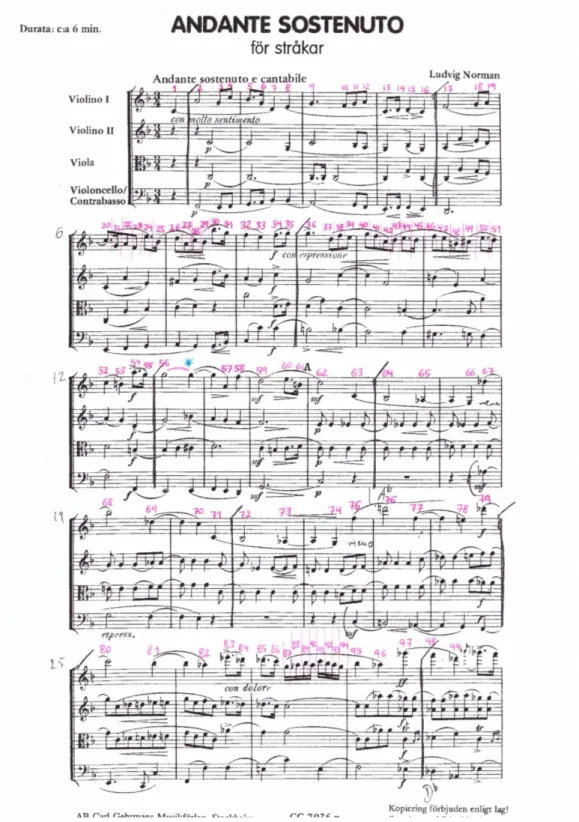
The data used in this project stems from an experiment session with a conductor and a string quartet performed at KTH in May 2014. The motion of the conductor’s upper body and baton was recorded with a Motion Capture (MoCap) system in 120 frames per second. The sounds of the string quartet, consisting of Violin 1, Violin 2, Viola and Cello, was recorded with instrument microphones on separate channels in .wav format. During the session the musical piece Andante Sostenuto op.65 by Ludvig Norman (bar 1-29.5, approximately between 1:10 - 1:50 in length) was performed together by conductor and string quartet 20 times. Each time one of the underlying emotions Tender, Neutral,Passionate or Angry (Figure 4.1) was assigned randomly to the conductor, resulting in 5 performances for each emotion [16]. The conductor in effect changed his way of conducting to express the assigned emotion to the musicians. The musicians were, unaware of the current underlying emotion, to follow the conducting. The goal with the random assignment of emotions was to provoke a variation in expression in both the conducting gesture and sound, as well as obtain labeled data for classification [23].
CHAPTER 4. DATA AND REPRESENTATION
Figure 4.2: Visualization of quaternion, represented by orienta-tion ˆe and rotation θ along this
ori-entation.
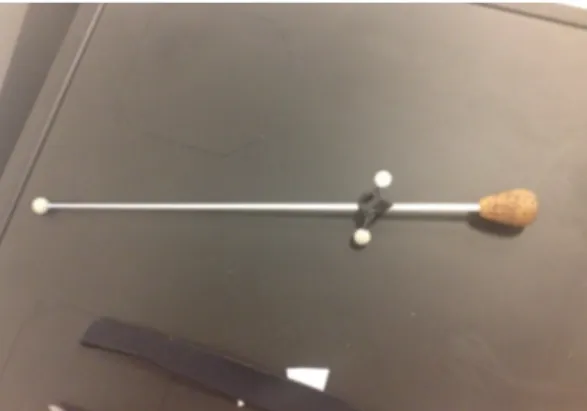
Figure 4.3: The utilized conductor’s baton
with three reflexive MoCaP-markers.
4.1
Representation of Conducting Gesture
In this project, two different representations of the conducting gesture are utilized. The first is Karipidou’s 2-dimensional GP-LVM representation and the second is the six-dimensional movement of the baton (3D rotation and position). These two representations are further explained below.
4.1.1 Baton Representation
The baton is equipped with three reflexive MoCap-markers as is illustrated in Fig-ure 4.3 and is defined as a rigid object in the MoCap system. As the baton is moved in the room the 3-dimensional positions of the markers are triangulated. Based on these positions the mid position (3D position) and rotation (4D quaternions) of the baton as a whole are calculated and saved in .csv format. As the quaternion visu-alization in Figure 4.2 shows, the forth quaternion parameter consists of a rotation along the axis of orientation. As the baton is a rotation symmetric object it is concluded that the rotation along the axis of the baton contains little information of the conducting motion. Hence this parameter is excluded, making the final baton representation of 6 dimensions, 3D position and 3D rotation.
4.1.2 GP-LVM Representation
As mentioned in Section 1.2.1 a first investigation of the conducting data was per-formed in the Master Thesis “Modelling the body language of a conductor using Gaussian Process Latent Variable Models (GP-LVM)” by Kelly Karipidou, prior to this project [10]. In this Master Thesis the conducting data was reduced to a two dimensional unit through the use of a GP-LVM. The procedure is described in the
4.1. REPRESENTATION OF CONDUCTING GESTURE −4 −3 −2 −1 0 1 2 −4 −3 −2 −1 0 1 2 3 latent dimension 1 latent dimension 2
Figure 4.4: Conducting sequences in the two-dimensional GP-LVM representa-tion belonging to the four emorepresenta-tions. The emotions are color-coded as: Tender = yel-low, Neutral = blue, Passionate = green and
Angry = red. Image source: [10]
−4 −3 −2 −1 0 1 2 −4 −3 −2 −1 0 1 2 3 latent dimension 1 latent dimension 2
Figure 4.5: Clustering of the latent space
with 20 clusters. Data belonging to the same cluster is colored the same and the cluster center is marked with a cross. Image source: [10]
following sentences. The positional information of the joints in the conductor’s up-per body as well as the conductor’s baton was concatenated to form a 60-dimensional representation of the conductor’s movement. Thereafter the 24 dimensions of most variance were singled out as the basis for training of the GP-LVM. For technical, as well as theoretical, details about the utilized GP-LVM model referral is made to the Master Thesis itself [10]. After the GP-LVM framework was applied the result was a two-dimensional latent representation of conducting gesture. Sequences be-longing to the four different emotions in the GP-LVM representation are visualized in Figure 4.4. As can be seen in the visualization, and as is stated by Karipidou in [10], there is no clear visible distinction between sequences belonging to differ-ent emotions. This represdiffer-entation’s ability to capture expression in the gestures is measured by performing a classification of the two dimensional data labeled by the four emotions. The first step of the classification is to cluster the latent space, and represent training sequences as the transition between clusters. An illustration of the clustering with the number of clusters being 20 is provided in Figure 4.5. Next a Hidden Markov Model (HMM) is learned on the cluster sequences, and later tested with test sequences, labeled by the different emotions. A summary of the results is that correct classification of the emotions Tender and Neutral is managed, whereas not for Passionate and Angry (the result is later illustrated in Figure 5.10).
Extraction of Latent Space Data
In Exp2 (Chapter 6) sequences of conducting gesture in the GP-LVM representation are required. As the GP-LVM model is non-parametric, methods must be applied to project the 24-dimensional original conducting data into the 2-dimensional latent space. The projection can only be performed point wise [24]. Hence the clustering
CHAPTER 4. DATA AND REPRESENTATION
scheme explained above is re-used to, for each 24-dimensional data point, assign the most probable cluster in latent space. The coordinates of the cluster center is thereafter used as the 2-dimensional latent space representation of the original data point. This procedure is performed for a clustering with 100 as well as 200 clusters, which can be seen as a sampling of the latent space where resolution is limited to 100 or 200 points.
4.2
Representation of Sound Data
The sound data is in this project represented by the CUEX parameters mentioned in section 2.1.1. The processing of the audio files with the CUEX algorithm is in this project performed by Anders Friberg, one of the developers of the same algorithm. A review of how the CUEX algorithm works, based on the material in [11], is presented below. A more in-depth presentation of the theory behind the CUEX parameters can be found in [11].
4.2.1 Onset and Offset Detection
In terms of sound level, the definition of a tone is typically an unbroken signal preceded and followed by silence. However if the tones are played in legato, such a trough of sound level may not be present - instead the change of pitch typically defines the onset of a new tone. Consequently the CUEX algorithm first detects tones as the periods defined by an increase (onset) and decay (offset) of sound level, and secondly - if changes of pitch are detected within these tones (by the YIN algorithm for detection of fundamental frequency [12]) - a further division into shorter tones are made. As a preceding step to the tone parameter extraction it is crucial that the onset and offset detection is correct. A visualization of detected onsets and offsets for a musical phrase is shown in Figure 4.6.
4.2.2 Expressive Tone Parameters
The parameters related to tempo are all calculated based solely on the detected onsets and offsets from the previous step. They are in [11] defined as follows:
• IOI (s), the time interval from a tone’s onset to the next tone’s onset
• Tone Rate (tones/s), the inverse of the IOI and an indicator of the perfor-mance’s tempo
• Articulation (no unit), measure of the proportion of silence to IOI (i.e.
stac-cato vs. legato) calculated as
Articulationn=
toffset,n− tonset,n
IOIn
(4.1) where t stands for time in seconds.
4.2. REPRESENTATION OF SOUND DATA
Figure 4.6: A visualization of the CUEX algorithm’s detected onset, offset, Pitch and
Vibrato Extent for a musical phrase. The analysed final tone frequency level (Pitch) is
visualized as straight line segments and the computed Vibrato Extent as dashed lines. The final onsets and offsets are marked with crosses (x). Image and (part of) caption from [11]
The remaining expressive parameters are computed based on the acoustic signal itself, confined by the detected onsets and offsets from the previous step. They are in [11] defined as follows:
• Sound level (dB), measure of the overall sound level from onset to offset com-puted as the upper quartile
• Attack (dB/s), measure of how fast the tone is attacked. Computed as the derivative of Sound Level around the onset time (2 ms before and after). • Spectrum, measure for estimating the relative proportion of high versus low
frequency content in the tone. After dividing the acoustic signal into a high and low level frequency part (above and below cutoff value 1000 Hz), the
Spectrum is computed as the difference in Sound Level between these two
parts.
• Pitch (midi tone number), computed as the median of the frequency level from onset to offset.
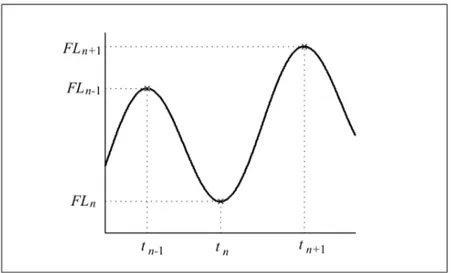
• Vibrato Rate (Hz) and Vibrato Extent (cents), a vibrato defines periodic changes in the fundamental frequency of a tone. The vibrato wave is detected through a number of steps, where the primary one is detection of chains of peaks and troughs in the fundamental frequency. The Vibrato Rate (VR) is computed as
VRn= 1
tn+1− tn−1
CHAPTER 4. DATA AND REPRESENTATION
Figure 4.7: One complete vibrato cycle. The peaks and troughs, used for the calculation
of Vibrato Rate and Vibrato Extent, are indicated with crosses. Image and caption from
[11]
where tn indicates the time instance of the two adjacent peaks/troughs visu-alized in Figure 4.7. The Vibrato Extent (VE ) is similarly computed based on the Frequency level (FL) as
VEn= 1
4|FLn+1− 2FLn+ FLn−1| (4.3)
The variables from these calculations are visualized in Figure 4.6 and 4.7. Since the two vibrato parameters Vibrato Rate and Vibrato Extent always appear together, they are sometimes referred to as simply Vibrato.
In this project, the CUEX parameters of Sound Level, Articulation, Attack,
Spec-trum, Vibrato Rate and Vibrato Extent, are used to represent the expressive features
of each tone. The Pitch, onset and offset are considered to be parameters belonging to score rather than real-time expression (these parameters are however used in preparative steps of Exp2 explained in Chapter ??). The resulting six dimensional CUEX parameter space is in the continuance of the report referred to as “the CUEX space”.
4.2.3 Accuracy of the Result
A number of adjustable parameters governs the detection of the CUEX algorithm [11]. Typically problems with both over and under segmentation can arise in the de-tection of tones. The parameters are tuned in a manner to find the best compromise
4.2. REPRESENTATION OF SOUND DATA
between under and over segmentation [22]. Even though the tuning of parameters in this project was performed by an expert on the subject (Anders Friberg) a perfect segmentation was not achievable.
Segmentation
The result has a problem with over segmentation. To exemplify; for Violin 1 the number of detected tones according to score should be 99, but for the 20 files the average number of detected tones is ∼ 125 (with a standard deviation of ∼ 5.5 tones). This gives rise to some problems in the processing of the CUEX data, which will be addressed further in Chapter 6.
Parameter Detection
There are also issues with the detection of certain CUEX parameters in the re-sult. As mentioned Vibrato Rate and Vibrato Extent are coupled as parameters. More than half of the detected tones has no detected Vibrato, which can of course correspond to that a vibrato was not present - but it is more probable that there for many tones was in fact a vibrato present that was not detected. In the same manner, many tones have a detected Attack corresponding to zero - which is most probably due to faulty detection - since most tones are inclined to have some at-tack, however so small. For the parameter Articulation the over segmentation of the result has an impact. Articulation is defined as toffset,n−tonset,n
IOIn in which both
the offset and IOI depends on the segmentation of tones. If the offset of the tone corresponds to the onset of the next tone, the Articulation of that tone will be 1 (corresponding to legato). If one tone is detected as several tones (which is the case in our over segmented CUEX data), it is apparent that each of these tones will have
Articulation 1, which introduces false information into our data. These issues will
Chapter 5
Exp1: Classification of Emotion in
CUEX Space
In Experiment 1 a HMM-classifier is trained and tested on CUEX data labeled by the four underlying emotions Tender, Neutral, Passionate and Angry. The experi-ment replicates the classification of conducting gesture in GP-LVM representation performed by Kelly Karipidou in [10], which is based on the classification concept explained in the paper “Facial movement based recognition” [14]. The performance of the classification indicates a) if the intention has been communicated from con-ductor to musicians and b) how well the CUEX parameters represent expression. As explained in Chapter 4, the musicians were not aware of the emotion assigned to the conductor at each performance of the musical piece during the experiment. Hence, a perfect classification of the four underlying emotions in the CUEX space implicitly proves that the assigned emotion was communicated from conductor to musicians. At the same time a perfect classification is an affirmation of the CUEX parameters suitability to represent expression in musical data. If the CUEX parameters were not able to capture the expression, which is what separates the underlying emotions from each other, the classification should not be able to replicate a perfect result.
5.1
Method of Classification
For the classification a Hidden Markov Model (HMM) [15] is used. The values of the musical parameters are in the HMM formalism considered observable states, which are in turn considered as noisy observations of the true hidden states. The observable states occurs in a certain sequence in the training and test files. To get a measure of the true hidden sequence of the training files (which is required to construct a transition matrix), each observation’s probability to belong to a certain state is calculated based on the Euclidean distance between the observation and the state in CUEX space. The transition sequences from the training files will therefore consist of a sequence of probability distributions over states, rather than a one di-mensional state sequence. Based on these sequences of distributions, four transition
CHAPTER 5. EXP1: CLASSIFICATION OF EMOTION IN CUEX SPACE
matrices (one for each emotion) are calculated. The Viterbi algorithm is then used to, given a certain observation matrix (based on a test file) and transition matrix, find the most likely hidden state sequence together with its calculated probability. Subsequently, four probabilities for each test file are gathered, and the transition matrix (ergo emotion) giving the highest probability is assigned as the class of the test file (classification is performed). The different steps in the classification are explained below.
5.1.1 Training Data and Test Data
Four of the five files for each emotion are randomly selected as training data, and the remaining file is selected as test data. This results in 16 training files and 4 test files. Because of the Markov Property, that is the assumption that each state in the sequence depends solely on the immediate preceding state, each subsequent pair of tones in the training file is an independent training point. As such the amount of training data is sufficient, even though the number of training files per class is only 4.
5.1.2 Clustering of the CUEX Space
To regard each individual tone as a state in the CUEX space would give rise to a much too fine-grained representation which would not be able to capture general characteristics in the music. The first step is thus to cluster the six-dimensional musical parameter space using k-means clustering on the training data. Each cal-culated cluster c is represented by the vector of its centroid c = (c1, c2, c3, c4, c5, c6)
and represents a state in the CUEX space. The number of clusters, k, are further varied to find an optimal clustering. To perform a non-biased clustering over the six dimensions, each dimension d must first be normalized so that its standard devia-tion σdequals one. This is performed by calculating scale factors sd= σ1d, d = [1...6] and multiplying with all data points.
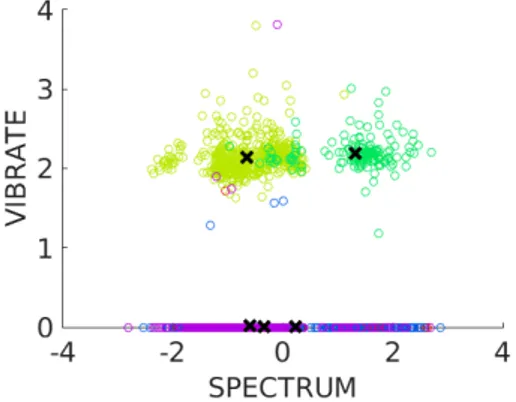
An example of the clustering result for k = 5 clusters, and selected combinations of CUEX parameters, is shown in Figures 5.1, 5.2, 5.3 and 5.4. The CUEX parame-ters displayed in the figures have all been scaled with the above mentioned scaling factors. Data points belonging to the same cluster have the same color, and the five cluster centroids are indicated with crosses. To relate back to Section 4.2.3 we can here clearly see that parameters Vibrato and Attack consists of a large number of zeros (Figure 5.1 and 5.4) and Articulation consists of a larger number of satu-rated values (Figure 5.3). Furthermore some parameters seem to have dominated the clustering result more than others, where for example a clearer separation of clusters can be witnessed for parameters Vibrato Rate and Spectrum (Figure 5.1) than for Sound Level and Attack (Figure 5.2).
5.1. METHOD OF CLASSIFICATION
Figure 5.1: Clustering of CUEX space in
parameters Vibrato Rate and Spectrum.
Figure 5.2: Clustering of CUEX space in
parameters Attack and Sound Level.
Figure 5.3: Clustering of CUEX space in
parameters Spectrum and Articulation.
Figure 5.4: Clustering of CUEX space in
parameters Vibrato Extent and Attack.
5.1.3 Assigning Clusters to the Training Data
For a data point p in the training data, the probability that it belongs to cluster c is calculated as:
P (p, c) = e−||(p−c)||22 (5.1)
where||(p − c)|| is the Euclidean norm in six dimensions defined as
||(p − c)|| = v u u t∑6 i=1 (pi− ci) (5.2)
The probabilities are thereafter normalized so that they sum to 1 for each data point and saved in a n∗ k training matrix M, where n is the number of data points and k is the number of clusters.
CHAPTER 5. EXP1: CLASSIFICATION OF EMOTION IN CUEX SPACE
5.1.4 Creating Transition Matrices
The transition matrix T is a k∗ k matrix, where the cell T (i, j) contains the prob-ability that cluster i is followed by cluster j in the sequence of data points in the training file. The update of the transition matrix works as follows; for every two subsequent data points in the training matrix M , p1 and p2, each cell T (i, j) in the
transition matrix is updated as:
T (i, j) = T (i, j) + (P (p1, ci)∗ P (p2, cj)) (5.3) One transition matrix per emotion is calculated, each describing the characteristic transition probabilities for that particular emotion.
5.1.5 Creating Observation Matrices
First, the test data is normalized through multiplication with the same scaling factors that were retrieved for the training data, sd. Then, for each data point in the test files, the probability that it belongs to each of the clusters is calculated in the same way that is described in Section 5.1.3. This will result in a m∗ k observation matrix O, where m is the number of data points in the test file and k is the number of clusters.
5.1.6 Viterbi Algorithm
The Viterbi Algorithm is used to calculate the probability that a certain transition matrix (emotion) has given rise to a certain observation matrix (test file). For each test file, 4 probabilities (one for each emotion) are calculated. There are in turn 4 test files in total, giving rise to a 4∗ 4 confusion matrix to display the result of the classification.
5.2
Results
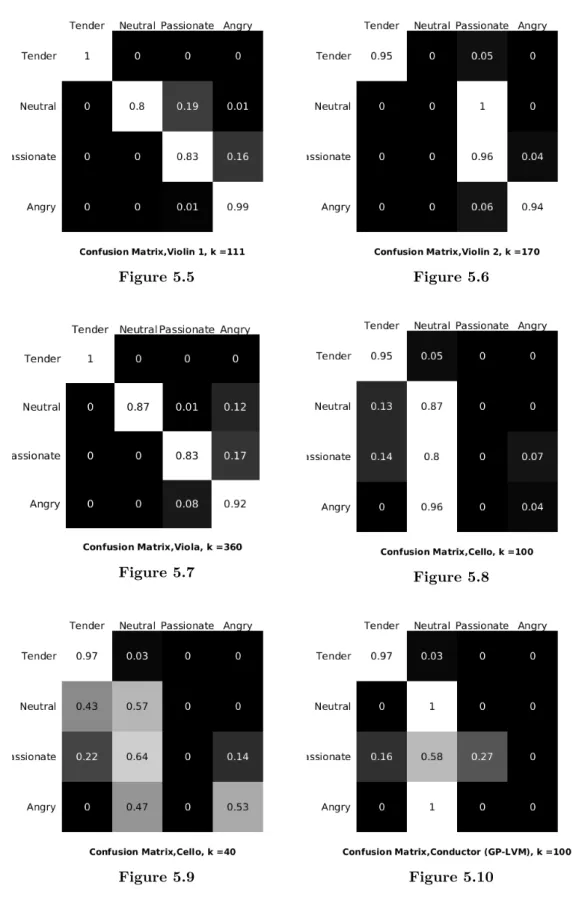
The procedure described above was performed for each of the four instruments (Violin 1, Violin 2, Viola and Cello), methodically increasing the number of clusters from 2 to around 500 (in coarse intervals) in order to find a range of optimal clustering for that instrument. Once such a range was found, it was investigated in finer detail (the intervals between the clusters were decreased) in order to find the optimal number of clusters. The results are presented below as confusion matrices, where the rows represent the ground truth and the columns the classification of the four test files. The presented probabilities have first been normalized for each test file to sum to 1. As the diagonal contains the calculated probabilities for correct classification, the strive is to maximize it in the search for an optimal clustering. The result of the classification of conducting gesture in the GP-LVM representation, performed by Karipidou in [10], is included in Figure 5.10 for comparison.
5.2. RESULTS
Figure 5.5 Figure 5.6
Figure 5.7 Figure 5.8
![Figure 6.5: BD tone24 cuex = [TN: 17 TP: 94 TA: 21 NP: 16 NA: 16 PA: 15 SUM: 177].](https://thumb-eu.123doks.com/thumbv2/5dokorg/5445751.140909/58.892.170.729.288.810/figure-bd-tone-cuex-tn-tp-ta-sum.webp)
