Master Thesis in International Marketing
Date: June 1, 2011
“Reconsideration of Volvo Strategic Planning for
Thai market”
Mamee Wongkorsub – 870715
Wongsatorn Chevamongkol –880116
Supervisor
Erik Bjurström
Examiner
Joakim Netz
i
Abstract
Date: June 1, 2011
Program: MIMA – International Marketing
Course name: Master Thesis (EFO 705)
Title: Reconsideration of Volvo Strategic Planning for Thai market
The authors: Mamee Wongkorsub (870715)
Wongsatorn Chevamongkol (880116)
Group number: 2843
Supervisor: Erik Bjurström
Problem: Volvo is one of the most prestigious car manufacturers in the world. It is well known for its high performance and safety. However, in Thailand, Volvo does not get a good response from Thai customers. The sales volume for Volvo is ranked the twelfth, which acquires less than one percent of the market share.
Purpose: The aim of this study is to identify which factors influence Thai people who are in Generation Y to purchase luxury cars in order to suggest the most effective strategies for Volvo to increase its sales volume among this group.
Method: Quantitative research method via survey was used for this research. The authors form a questionnaire to investigate the perception of Thai people who are in Generation Y towards luxury cars. The five independent variables in this paper are demographic, social influence, personal value, brain identity and country of origin. Buying decision is a dependent variable in this study.
This paper contains both primary and secondary data in order to increase the reliability.
Conclusion: Demographic, social influence, personal value and country of origin are the factors which have a significant relationship with buying decision of luxury cars. Focusing in each factor, gender, occupation and monthly income are three indicators which are significant towards the buying decision of cars in the demographic factor. The indicators of personal value that influence buying luxury cars are materialism, vanity and
ii
consumer ethnocentrism. For brand identity, all indicators have significant relationship with the buying decision of luxury car.
Key words: Luxury cars, Thai consumer behavior, Consumer perception, Volvo, Social influence, Demographic and Country of origin
iii
Acknowledgement
While the authors are doing the thesis, the authors have faced lots of difficulties, confusions and constraints. Therefore, this thesis would not have been possible unless the authors were helped by the following people.
First and foremost the authors offer my sincerest gratitude to my supervisor, Erik Bjurström, who helped and guided the way to do this master thesis. With his experiences, the authors benefitted from his valuable suggestions.
Secondly, the authors would like to sincerely thank group 2865, 2676, 2834 and 2669, who are our main opponent, and others groups in each seminar. Without them, the authors may not find out some errors in this paper.
Thirdly, it is a pleasure to thank to our respondents who devote their time doing an online questionnaire. The authors also would like to think to all friends and family who kindly help the authors spread the questionnaire to their friends
Last but not least, the authors would like to thank to our family who always give support and inspiration during the time we study in Sweden.
iv
Table of Contents
1. Introduction ... 1 1.1 Background Research ... 1 1.2 Volvo Overview ... 2 1.3 Problem Statement ... 3 1.4 Previous Studies ... 4 1.5 Research Question ... 5 1.6 Strategic Question ... 5 1.7 Scope ... 5 1.8 Limitation ... 62. Critical Literature Review ... 7
2.1 Key Words ... 7 2.2 Databases / Websites ... 7 2.3 Theories... 7 2.4 Conceptual Framework ... 13 3. Methodology ... 15 3.1 Topic Selection ... 16 3.2 Data Collection ... 16
3.3 Reliability of Result and Evaluation ... 20
4. Research Findings and Data Analysis ... 21
4.1 Descriptive Statistic ... 21
4.2 Hypotheses Testing ... 29
4.3 Variable Analysis ... 49
5. Conclusion and Recommendation ... 54
5.1 Conclusion ... 54 5.2 Discussion ... 54 5.3 Recommendation ... 56 5.4 Further Studies ... 56 5. Reference ... 58 6. Appendix ... 62
Appendix 1: Questionnaire form... 62
v
List of figures
Figure 1.1: Motor Vehicle Domestic Sales of Thailand from 2006-2010 ... 1
Figure 1.2: Market Share of Passenger Car in February 2011 ... 3
Figure 1.3: Luxury Car Sale Volume in February 2011 ... 4
Figure 2.1: Conceptual Framework ... 13
Figure 3.1: The Research Process ... 15
Figure 4.1.1: The Usage of Car Brand ... 24
Figure 4.1.2: Brand of Luxury Car that Respondents Use ... 24
Figure 4.1.3: The Line Chart of Comparison of Point on Each Luxury Car Brand by Personal Value Factors ... 27
Figure 4.1.4: The Line Chart of Comparison of Point on Each Luxury Car Brand by Brand Identity Factors ... 28
Figure 4.1.5: The Bar Chart of Country of Origin by Luxury Car Brands ... 29
Figure 4.3.1: Variable Relation Analysis of Luxury Car Users ... 50
Figure 4.3.2: Variable Relation Analysis of B.M.W.’s Users ... 51
Figure 4.3.3: Variable Relation Analysis of Mercedes-Benz’s Users ... 52
Figure 4.3.4: Variable Relation Analysis of Volvo’s Users ... 53
vi
List of Tables
Table 2.1: Databases and Websites ... 7
Table 4.1.1: The Frequency and Percentage of Demographic Data by Car User ... 22
Table 4.1.2: The Frequency and Percentage of Social Influencer by Luxury Car User ... 23
Table 4.1.3: The Frequency and Percentage of Significant Demographic Data by Luxury Car User ... 26
Table 4.2.1: The Chi-square Test between Demographic Indicators and Thai Generation Y Car users .... 31
Table 4.2.2: The Chi-square Test between Social Influence and Thai Generation Y Car Users ... 31
Table 4.2.3: The Chi-square Test between Significant Demographic Indicators and B.M.W.’s Users ... 32
Table 4.2.4: The Chi-square Test between Significant Demographic Indicators and Mercedes-Benz’s Users ... 32
Table 4.2.5: The Chi-square Test between Significant Demographic Indicators and Volvo’s Users ... 33
Table 4.2.6: The Pearson Correlation Test between Personal Value and Buying Decision of Thai Generation Y Luxury Car Users ... 34
Table 4.2.7: The Pearson Correlation Test between Five Indicators of Personal Value and Buying Decision of Thai Generation Y Luxury Car Users... 34
Table 4.2.8: The Pearson Correlation Test between Brand Identity and Buying Decision of Thai Generation Y Luxury car Users ... 35
Table 4.2.9: The Pearson Correlation Test between Nine Indicators of Brand Identity and Buying Decision of Thai Generation Y Luxury Car Users... 36
Table 4.2.10: The Pearson Correlation Test between country of origin and buying decision of Thai Generation Y luxury Car User Who are in Generation Y ... 37
Table 4.2.11: The Pearson Correlation Test between Personal Value and Buying Decision of Thai B.M.W.’s Users... 38
Table 4.2.12: The Pearson Correlation Test between Five Indicators of Personal Value and Buying Decision of Thai B.M.W.’s Users Who are in Generation Y ... 38
Table 4.2.13: The Pearson Correlation Test between Brand Identity and Buying Decision of Thai B.M.W.’s Users Who are in Generation Y ... 39
Table 4.2.14: The Pearson Correlation Test between Nine Indicators of Brand Identity and Buying Decision of Thai B.M.W.’s Users Who are in Generation Y ... 40
Table 4.2.15: The Pearson Correlation Test between Country of Origin and Buying Decision of Thai B.M.W.’s Users Who are in Generation Y ... 41
Table 4.2.16: The Pearson Correlation Test between Personal Value and Buying Decision of Thai Mercedes-Benz’s Users Who are in Generation Y ... 42
Table 4.2.17: The Pearson Correlation Test between Five Indicators of Personal Value and Buying Decision of Thai Mercedes-Benz’s Users Who are in Generation Y ... 42
vii Table 4.2.18: The Pearson Correlation Test between Brand Identity and Buying Decision of Thai
Mercedes-Benz’s Users Who are in Generation Y ... 43 Table 4.2.19: The Pearson Correlation Test between Nine Indicators of Brand Identity and Buying
Decision of Thai Mercedes-Benz’s Users Who are in Generation Y ... 44 Table 4.2.20: The Pearson Correlation Test between Country of Origin and Buying Decision of Thai Mercedes-Benz’s Users Who are in Generation Y ... 45 Table 4.2.21: The Pearson Correlation Test between Personal value and Buying Decision of Thai Volvo’s Users Who are in Generation Y ... 46 Table 4.2.22: The Pearson Correlation Test between Brand Identity and Buying Decision of Thai Volvo’s Users Who are in Generation Y ... 46 Table 4.2.23: The Pearson Correlation Test between Nine Indicators of Brand Identity and Buying
Decision of Thai Volvo’s Users Who are in Generation Y ... 47 Table 4.2.24: The Pearson Correlation Test between Country of Origin and Buying Decision of Thai Volvo’s Users Who are in Generation Y ... 48
1
1. Introduction
1.1 Background Research
No one would disagree if someone stated that the car is a crucial, necessary item for today’s life because it gives us an opportunity to go everywhere with freedom, whenever we want to. Car users get several benefits from using cars in daily life or in special occasions. The examples of using a car in daily life can be going to work, or sending kids to school; Traveling upcountry with friends can be categorized as using a car in special occasions.
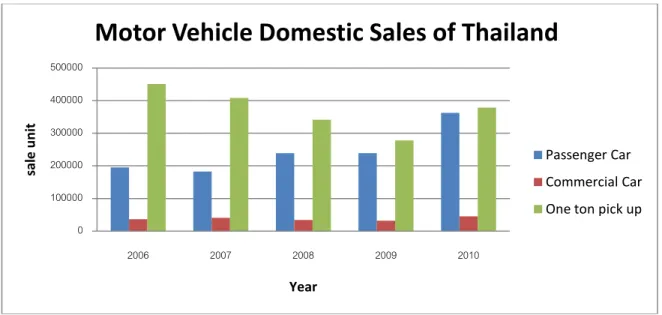
For automobile manufacturers, Thailand is one of the most interesting markets. According to the statistics from Automotive Institute (2011), the sales volume for motor vehicles in 2010 was 786,096 units, which increased from the previous year 43.22 percent. The director of IHS Automotive, Yamamoto (2011) also commented, "Thailand still has a big market for first-time buyers. The market itself is not as mature as countries like Malaysia." Compared with other countries in Southeast Asia, Thailand has the highest number of vehicle sales in 2010 followed by Indonesia and Malaysia (Kate, 2011).
Categorizing automobiles, it can be separated into three groups: passenger car, commercial car, and one ton pickup, as showing in figure 1. Passenger cars have the highest growth rate with 49.05 percent followed by commercial cars and one ton pickup with 39.33 and 28.26 percent respectively.
Figure 1.1: Motor Vehicle Domestic Sales of Thailand from 2006-2010 Source: Automotive Institute, 2011
0 100000 200000 300000 400000 500000 2006 2007 2008 2009 2010 sal e u n it Year
Motor Vehicle Domestic Sales of Thailand
Passenger Car Commercial Car One ton pick up
2
Luxury car is a subset of passenger cars. To get a clear understanding of luxury car, it is worth mentioning its definition. Luxury cars are the vehicles that give luxury, convenience and advantageous features (Carr, 2010). This type of car often comes with high performance, the newest technologies, creative design and attractive appearance (Verma, n.d.; Carr, 2010; Barton, 2011). Luxury cars also create a good brand image and social status to those who acquire it (Carr, 2010). One outstanding characteristic of the luxury car is the high price (Verma, n.d.; Carr, 2010).
From Volvo’s perspective, this car manufacturer has emphasized several criteria to create efficiency vehicles. Volvo has four major values that this company is concerned with, which are: design, environment, quality and safety. These Volvo values are core components of the luxury car characters. In addition, the authors have chosen 2.5 million Baht to be a separator between the luxury and economic car. According to the study from Thanasuta, Patoomuwan, Chaimahawong, and Chiaravutthi, (2009), they stated that 2,690,576 is the average price for Volvo cars. Therefore, Volvo is concluded to be in the luxury car segment. (Volvo, 2011) 1.2 Volvo Overview
Volvo was founded by Assar Gabrielsson and Gustaf Larsson in Gothenburg, Sweden. The reason that these two founders created Volvo was to build cars from high Swedish quality steel and to match with the Scandinavian climate than imported the car from the US. (Auto car) The word “Volvo” is the synonym of quality and security in Swedish which is the origin of the automobile. 14 April, 1927 was the first day that the company sold the first Volvo car. (Volvo Garage, 2011)
On 1959, Nils Bohlin, who is the engineer of Volvo, was creating the new innovation of the three point seat belt, which was the first automobile manufacturer to provide their car with it. Moreover, Volvo has also been the first cars that provide head rests in the front which are used to reduce risks of breaking the neck when accidents occur. That’s why Volvo is known as a safety passenger car. Therefore, safety also becomes the value of Volvo. In addition, the values of Volvo also include quality, ecology and design which are the value of Volvo. (Volvo, 2011) Another thing that Volvo considers is the environment, Volvo has developed numerous models of cars which can reduce the emission of carbon dioxide in the combustion process. At present, Volvo has launched new evolution of car called Hybrid car which can emit the carbon dioxide less than 105 grams per kilometer. (Volvo, 2011)
Quality and design are the two main value of Volvo. Volvo cars have been send to anti seismic building for testing their quality and has been approve in the sustainability of its cars over time and under extreme condition because of Scandinavian design and high quality of Swedish steel. Finally, the design of Volvo has been sober designs which are elegant and functional. However, Volvo realizes that practical is not the only one factor that the customers consider before
3
purchasing. The design of car also plays an important role for customer decision. Therefore, Volvo has design the new model of its cars. (Volvo, 2011)
Nowadays, the Volvo Group is one of the world's leading suppliers of commercial transport solutions. They provide various transportation products like trucks, buses, construction equipments, engines and drive system for boat and industrial applications, in addition to aircraft engine component. (Volvo, 2011)
For the Volvo passenger car, Volvo Group operates their business in 180 countries in order to sell their products by using both wholly owned and independent dealers. They also provide the global service network for handling customer demand and spare parts as well as other services. (Volvo, 2011)
1.3 Problem Statement
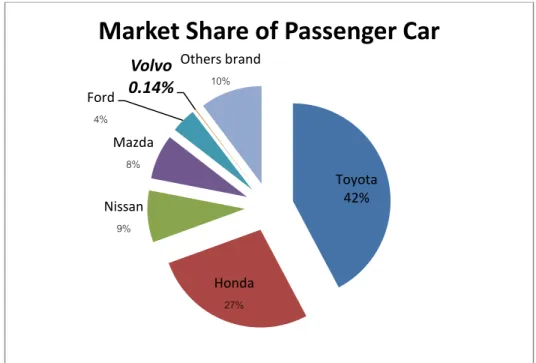
Volvo is one of the most prestigious car manufacturers in the world. It is well known for its high performance and safety (Svensson, 2006). The company also focuses on developing its products
in the sustainable and environmental friendly way. However, in Thailand, Volvo does not get a good respond from Thai customers as showing in figure 1.2. It shows Thailand market share for passenger car in February 2011. This sale volume for Volvo car in this month is ranked in the twelfth which acquire less than one percent in market share. In addition, if focusing only luxury car segment, Volvo is ranked in the third in market share. However, the sale volume of Volvo is approximate eight times less than Mercedes Benz and five times less than B.M.W. who are the first and second rank in Thailand luxury car market share which is showed in figure 1.3.
Figure 1.2: Market Share of Passenger Car in February 2011 Source: Toyota, 2011 Toyota 42% Honda 27% Nissan 9% Mazda 8% Ford 4% Volvo 0.14% Others brand 10%
4
Figure 1.3: Luxury Car Sale Volume in February 2011 Source: Toyota, 2011
We would like to investigate what are the factors that make Volvo have less sales volume in the Thai market. In order to answer this strategic question, we formed research questions. By answering the research questions, it would lead us to understand what criteria lead Volvo to have less sales volume than others car manufacturers, Volvo can use this information to improve and reconsider its strategic planning in the Thai market.
1.4 Previous Studies
In order to generate an interesting research question and strategic question, the authors searched for relevant literatures in order to find factors that may be related with buying decisions of luxury cars.
According to Creusen’s study, it claims that different in demographic affect to buying behavior. The result shows that females concern in symbolic aspect more than male. He also states that the higher income, the more expectation for symbolic aspect. In additional, the symbolic aspect affect to young people only for social significant product. However, people who have high education level are less concern on symbolic aspect. (Creusen, 2010)
The study of young Chinese customer shows that dealer staff and internet are the first and second sources for Beijing customers for finding car’s information, followed by friend and family. In additional, the result shows that young Chinese people want to be accepted by their group. Therefore, they buy luxury cars in order to express their social status. For Thai customers, people
0 50 100 150 200 250 300 350 400 450
Mercedes Benz B.M.W. Volvo
Sal e u n its Car manugacturer
Sale Volume for Luxury Car
Jan Feb
5
who acquire European cars are concerned as reliability, good reputation and high status (Baltas and Saridakis, 2010, Thanasuta et al, 2009). (Donyan and Xuan, 2008)
Car characteristics are compound of attribute features, which is relate to luxury and comfort, and safety features (Baltas and Saridakis, 2009). Business customers and private customers have different criteria for making a decision on buying cars. Focusing on private customers, they are concerned with symbolic benefits rather than functional benefits because the car seems to be less different in term of product as the improving in technology. (Anurit, Chasarkar, and Newman, 2008) On the other hand, Baltas and Saridakis (2010) mention that car users concern in both functional and symbolic benefit.
Country of origin influences in evaluation of the product and buying decision. Moreover, country of origin is linked with quality of the product and brand image. So different in brand image and country of origin affect to customer willingness to pay. For Thai customers, they put high value on European car especially from Germany. (Thanasuta et al, 2009)
1.5 Research Question
In order to answer the aim and propose of this study, the authors have formulated the research question by relying on the background and problem statement as the following:
What are the factors that influence Thai people in generation Y to purchase luxury cars?
1.6 Strategic Question
This is our strategic question. Following this strategic question, Volvo may increase its passenger car sale in Thai Generation Y segment.
What should Volvo do in order to sell more cars among Thai people who are in Generation Y? 1.7 Scope
We will mainly focus on the criteria of consumer behavior that makes Volvo has less sale volume than the other luxury car manufacturers. According to statistic from Toyota (2011), it shows that Volvo sales for passenger car are ranked in the third lower than Mercedes-Benz and BMW. So this article will focus on Volvo passenger car only and neglect Volvo commercial car and one ton pickup car.
This paper investigates on the perception of Thai people toward luxury car. The focus group of this report Generation Y and live in Bangkok, Thailand. This sample group is in period of seeking for own car and has enough purchasing power to own a luxury car.
6
1.8 Limitation
These questionnaires are conducted online to reach Thai respondents who live in Bangkok, so we cannot meet every group of target. However, the good points of online survey are the cost reduction and time saving.
We cannot get the information and opinions from all people who live in Bangkok, so some population of Bangkok are chosen to be a sample group in the paper.
Due to limitations of time and the location, the authors have some constraints about spreading the questionnaire. As the authors live in Sweden while doing this thesis, we chose Google Spreadsheets program to create an online survey and spread to the authors’ friends and family. Then, the authors asked them to spread the questionnaire to their friends. Most of the authors’ friends are age between 20-25 years old, so the sample group of this questionnaire has high frequency on people who are between 20-25 years old.
7
2. Critical Literature Review
Methods for the critical literature review
In this part, we will explain briefly how we find the related literatures and theories. 2.1 Key Words
These keywords are used in order to find related literatures.
Luxury cars
Thai consumer behavior
Consumer perception Volvo Social influence Demographic Country of origin 2.2 Databases / Websites
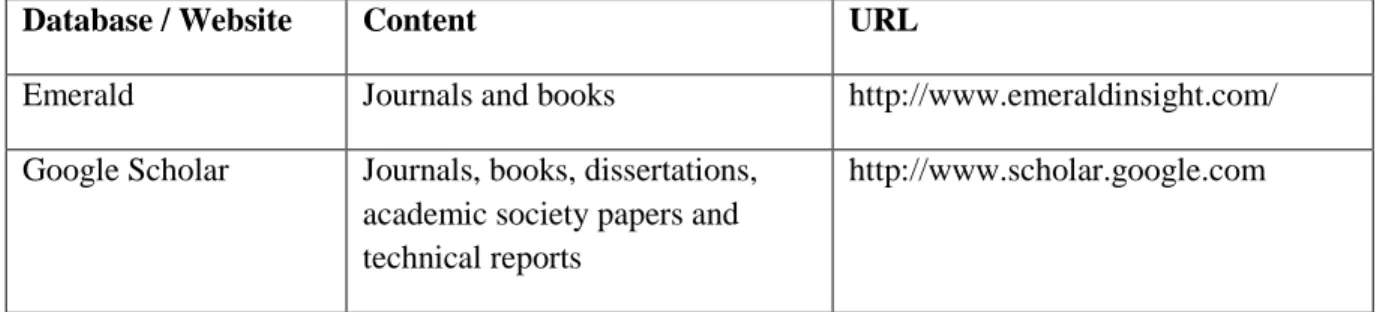
The articles we selected were found from the following online databases:
Database / Website Content URL
Emerald Journals and books http://www.emeraldinsight.com/
Google Scholar Journals, books, dissertations, academic society papers and technical reports
http://www.scholar.google.com
Table 2.1: Databases and Websites
Source: Own Illustration 2.3 Theories
2.3.1 Demographic
With a difference in demographics, customers may think and behave in different ways and lead to various alternative decision making. Therefore, the authors chose five demographic factors that have a high potential influencing in buying decision which are gender, age, occupation, education and personal income.
Gender: If we would like to categorize people by demographic, gender is one of the most factors that social and behavioral research uses (Fugate & Philips, 2010). Moreover, Evans, Jamal and Foxall (2009) pointed that, “the male and female brains might work differently”. People in one gender might interest in one kind of product while another gender might not interest in it.
8
Therefore, when people are going to buy a luxury car, gender might influence on their decision-making and shopping behavior.
Age: Many traditional literatures recommend researcher to use age in the analysis of consumer behavior (Hernandez, Jimenez and Martin, 2010). In this research, the authors focus on Thai people who born between 1977 and 1994 or Thai generation Y people. According to Evans et al (2009), the people who are generation Y is materialists, brand-orientated, risk-taker, keen on business and hedonism, so they concern more about their image which is the major objective of the people who purchase luxury brand.
Occupation: Thailand is the country that has a low individualism in the Hofstede’s cultural dimension, so we could infer that Thailand is a high collectivism country (cited in Usunier, 1996). With high collectivism people always stay with their friends, so this kind of people may try to orient them to match with their colleagues.
Education level: Janssen & Jager (2003) commented, “People from same status may have the same valuable information for decision making.” Education level could be counted as one of the status, so the authors would like to know whether the people in the same level of education will have the same tendency when they make a decision making or not.
Personal income: People who have a high income often get a better opportunity of living (Green & Nelson, 2007). With high income, they can buy product that they desire. Therefore, people with a high income may have a high potential to buy a luxury car.
From demographic theory, the authors relate it with this study and formulate some hypotheses as follow;
Hypothesis1: The demographic data and buying decision of Thai car users who are in generation Y are not independent.
Hypothesis3: The significant demographic data and Thai B.M.W.’s users who are in generation Y are not independent.
Hypothesis4: The significant demographic data and Thai Mercedes-Benz’s users who are in generation Y are not independent.
Hypothesis5: The significant demographic data and Thai Volvo’s users who are in generation Y are not independent.
2.3.2 Social influence
When people strive to maintain their social status, they allow themselves to be acceptable among their group. Therefore, social influence is a tool to help them be accepted in their society. As many previous studies prove, individuals’ attitude and intentions are affected by social influence. Moreover Hofstede stated that Thai people are a collectivism (cited in Usunier, 1996). Hence,
9
they may imitate others’ decision or behavior from this reference group (Wang & Chuan-Chun lin, 2011). Reference group can be a person or group of people who give a significant influence on your decision. For the importance of reference group, it also depends on what kind of product it is. The reference group has a high important if it is a luxury product and people use it in public. In contrast, if it is a necessity product that people use it in private, the reference group are less in important. (Evans et al, 2009)
Luxury brand and product always have prestigious value, social reference and the construction of one’s self attach with the product, so people who use luxury product in public can seldom illustrate sign of group membership (Wiedmann, Hennings and Siebels, 2007). Hence, using luxury product or luxury car can be another way to represent their social status which reflects the image of success and prestige (Nueno and Quelch, 1998). Therfore, social influence may play an important role for inspire people to purchase luxury car to be acceptable among their group. Social influence theory has three social processes that affect individual behavior which are compliance, identification and internalization. When individuals listen and orient himself to match with opinions of people who are important to him, it is called compliance. The next one, identification is the way that individual does things to follow the norm and community. The last process, internalization, reflects that an individual accepts the influence because of the congruence of his values with those of group members. (Zhou, 2011)
From social influence theory, the authors relate it with this study and formulate a hypothesis as follow;
Hypothesis2: Social influence and buying decision of Thai car users who are in generation Y are not independent.
2.3.3 Personal Value
Every people try to be acceptable among their society, so internal and social value are the factors that boost people to buy a luxury product. People buy products in order to impress the others which are the internal personal value. It will reflex the good image in society. (Eagly and Chaiken 1993; Weidmann and Hennigs 2007) Hence, there are many elements that influence people purchasing luxury brand such as consumer ethnocentrism, materialism, conformity, the need of uniqueness and vanity.
Consumer Ethnocentrism
The consumer ethnocentrism is the preferable attitudes toward domestic products than foreign products. The consumer ethnocentrism is one of the indicators that show consumption pattern which people prefer to consume the product from same country or region rather than consume the foreign brands. The high level of consumer ethnocentrism means that the people in that
10
country flavor products from similar culture country rather than products from different culture country. (Watsons and Wright, 2000)
Materialism
Materialism is the beliefs that wanting to acquire the material object in term of type and quantity of the purchased product (Richin and Dawson, 1992). Materialisms are people who wear high cost clothes, possess high-tech products and drive luxury cars. They think that the symbol of success and wealthy people is the money (Buzzle, 2010). Therefore, if this kind of people think Volvo is a luxury cars, they are going to buy it too fulfill their need. They may consume Volvo because ideal social self theory. Ideal social self is the reflection that customers would like other to see them (Evans et al, 2009, p.141).
Conformity
Conformity is the social impact that occur from the changing behavior to be acceptable in the society or group. In addition, the conformity plays a major role for influencing society (Mcleod, 2007). Schutte and Ciarlante (1998) commented that people try to purchasing product that interpret their status, especially Thai teenager people who concern a lot for their image. They would buy the luxury products or cars in order to be accepted by their friends.
The Need of Uniqueness
The need of uniqueness is different from non-conformity because a non-conformity person means the person who don’t concern about social norm and social approval (Tepper and Hoyle, 1996). But the uniqueness person is the people who want to be different from the other. Therefore, people tend to buy the luxury product or luxury car because they belief that luxury product are not own by many people due to, most of the luxury brand are trying to produce their product in small volume. (Dubois and Paternaut, 1995)
Vanity
The luxury product can reflect the appearance of the user so, vanity is another factor that involve with the concerning factor to buying luxury brand. Vanity is the relation between the physical appearance and the concern of appearance. Vanity can define as the overwhelm concern of physical appearance and also personal achievement. (Netemeyer, 1995)
From personal vale theory, the authors relate it with this study and formulate some hypotheses as follow;
Hypothesis 6: There are relationships between personal value and buying decision of Thai luxury car users who are in generation Y.
Hypothesis 9: There are relationships between personal value and buying decision of Thai B.M.W.’s users who are in generation Y.
11
Hypothesis 12: There are relationships between personal value and buying decision of Thai Mercedes-Benz’s users who are in generation Y.
Hypothesis 15: There are relationships between personal value and buying decision of Thai Volvo’s users who are in generation Y.
2.3.4 Brand Identity
The theory from Lancaster (1966) mentioned that customers buy feature rather than product which quite consistency with theory from Evans et al stated customers buy benefits of the product not physical product. Feature can be categorized in to two groups which are functional benefit and symbolic benefit. According to the study from Anurit et al. (2008) business customer concern for the functional benefits such as a large engine, high horse power, quicker acceleration, and higher maximum speed. On the others hand, end user customers look for on experiential or symbolic benefits from the car brand.
The perceived image of the car is the crucial factor that helps customers makes their decision (Anurit et al., 2008). Once car manufacturers can create a strong brand to customer mind, they get both short-term and long-term benefit (Thanasuta, et al., 2009). Customers can recognition of the brand then gain a short-term benefit. For the long-term, car manufacturers can persuade these customers be a loyalty customer and generate profit from them.
Attitude toward brand is one factor that helps customers make a decision. Attitude is built from pass experience and present experience. The different in attitude come from different in demographic, geographic, psychographic, or lifestyle (Anurit et al., 2008; Evans et al., 2009). In some case, attitude can come purely from information without experience. Customers may have a positive attitude toward some luxury car brands such as Ferrari, Aston Martin, and Bentley, though none of them have ever driven before and does not have enough purchasing power to buy them. For customers who high have purchasing power they may not perceiver Mercedes Benz, B.M.W. and Volvo as a luxury car and neglect these brands. (Anurit et al., 2008)
From brand identity theory, the authors relate it with this study and formulate some hypotheses as follow;
Hypothesis 7: There are relationships between brand identity and buying decision of Thai luxury car users who are in generation Y.
Hypothesis 10: There are relationships between brand identity and buying decision of Thai B.M.W.’s users who are in generation Y.
Hypothesis 13: There are relationships between brand identity and buying decision of Thai Mercedes-Benz’s users who are in generation Y.
Hypothesis 16: There are relationships between brand identity and buying decision of Thai Volvo’s users who are in generation Y.
12
2.3.5 Country of Origin
Country of origin is defined by many scholars. Country of origin is the place where the product originated from or where the headquarter are located (Johansson et al., 1985; Ozsomer and Cavusgil, 1991; Thakor and Kohli , 1996). Some researchers are not focus on the country of the origin; instead they focus on where the product is made in or where it is assembled (White, 1979; Han and Terpstra, 1988; Papadopoulos, 1993). Country of origin is linked with the quality of the product. According to the study from Schooler (1965), he stated that customers often judge quality and performance of products from country of origin. For the car, customer often perceive car from Germany as a high quality car (Anurit et al., 2008; Thanasuta, et al., 2009). Country of origin is not only in a positive perception, but the negative and unexpected consequences are also included. Many studies point that customers are biased and not trust on product produced from developing country (Coredell, 1991; Hampton, 1997). Many researchers comment that the consumers’ perception of country of origin is important for customers’ decision then actually quality and performance (Thakor and Kohli, 1996; Lim and O’Cass, 2001; Jo et al., 2003). Customers may think that cars from Germany have high quality than Japan car, but it may not true in all case.
From country of origin theory, the authors relate it with this study and formulate some hypotheses as follow;
Hypothesis 8: There are relationships between country of origin and buying decision of Thai luxury car users who are in generation Y.
Hypothesis 11: There are relationships between country of origin and buying decision of Thai B.M.W.’s users who are in generation Y.
Hypothesis 14: There are relationships between country of origin and buying decision of Thai Mercedes-Benz’s users who are in generation Y.
Hypothesis 17: There are relationships between country of origin and buying decision of Thai Volvo’s users who are in generation Y.
13
2.4 Conceptual Framework
Figure 2.1: Conceptual Framework Source: Own Illustration
In this part, the authors combine all of theories that relate to this research and generate our own model. We will conduct own questionnaire based on the conceptual frame work. As we study the perception of Thai people who are in generation Y toward luxury car, there are many factors that affect customers’ buying behavior.
People who are different in demographic factor may act or behave in different ways. Therefore, this study focuses five factors of demographic which are gender, age, educational level, occupation, and monthly income. The reason that the authors chose these five factors because they have a high potential that they may affect consumer behavior of buying luxury car.
Since, the target group of this research is Thai people in Generation Y who like to try a new thing and wants to be accepted by social or their group. Social influence like friend and family recommendation may plays a crucial role affecting consumer behavior on buying luxury car. Due to this reason, personal value is another factor always affect to customer behavior. The personal value consists of consumer ethnocentrism, materialism, conformity, the need of uniqueness and vanity. The authors would like to investigate that what component of personal value that influent to buying decision on luxury car.
Luxury car is the product that brand identity and country of origin are often important for customers’ decision making. Moreover, brand identity and country of origin are the two factors
Demographic
Social Influence
Personal Value
Brand Identity
Country of originCustomer behavior in buying a luxury car
Factors that affect luxury car buying behavior of
Thai generation Y people
14
that affect in customer’s perception and attitude. As the authors mention in the previous part, attitude and perception are more important nowadays. Therefore, the authors would like to recheck this assumption and develop them in this paper.
From the previous, those five factors is the factor that may affect to the purchasing intensions. So we will combine those purchasing intensions and the perception of Volvo among Thai generation Y people to figure out the reason why Volvo have less sale volume than other luxury Europeans car.
15
3. Methodology
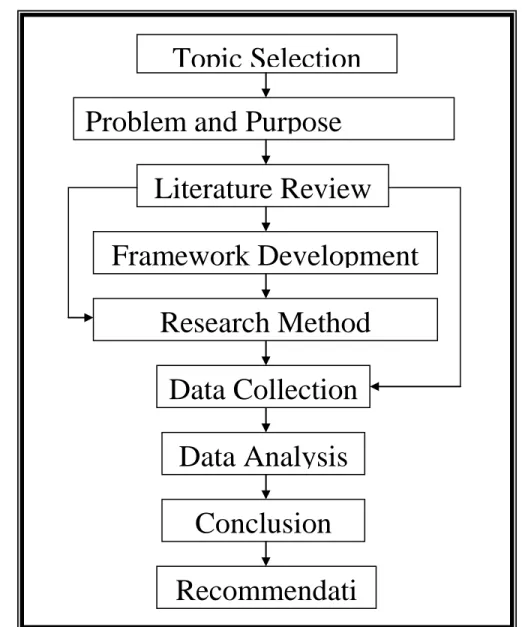
Figure 3.1: The Research Process Source: Own Illustration
Overall Process
From figure 3.1, there are nine processes when the authors do this thesis. The first process begins with selection topic. The authors will finding and searching topic that they interest and having background in that field. According to Fisher (2007), Six-stage process for choosing topic is concerned in this process. After selection topic, the authors generate the problem and purpose of writing this thesis that are related with the topic. Afterward, the authors search for theories and assumptions that involve with the topic and problem statement from academic journal, articles and books. The authors use those academic materials to support their research statement. Then, we will build up our own framework for guiding the research process. After that, we decided the
Topic Selection
Problem and Purpose
Indication
Literature Review
Framework Development
Research Method
Selection
Data Collection
Data Analysis
Conclusion
Recommendati
on
16
research method that is the most suitable and effective way for collecting and analyzing data. Subsequently, the authors collect and then analyze the data by link with the selected theories. Finally, we draw the conclusion and give the recommendation.
3.1 Topic Selection
The initial thought of this study come from the authors’ own interest in luxury cars. As the authors study in Sweden which is the origin of Volvo, so Volvo is the first choice that comes up with the authors mind. In a daily life in Sweden, the authors see many Swedes uses Volvo car along the street. However, In Thailand, Volvo does not popular among Thai customer. The small amount of Volvo market share can be an evident. From the authors’ basic knowledge about luxury cars, it inspired us to learn and study more about the customer behavior of luxury car among Thai people. The authors are wondering that what the factors that causes Volvo is less popularity than top two leader brands car manufacturers.
The authors select Bangkok, Thailand as the main area of study. The reason that the authors chose Bangkok because it is the capital city of Thailand and people in this city has the highest income per capita when compare to others province (National Statistic Office, 2011). When people have high income, they have more potential to buy luxury car. Thailand is chosen because this country is an attractive market for car manufacturers due to the unsaturated market for car, high growth rate of vehicle sales, and the highest vehicle sale volume in Southeast Asia (Automotive Institute, 2011; Kate, 2011). Access to the data is another issue that the authors concern. As the authors are Thai people and we have friends and connection in Bangkok, Thailand. If the authors select Bangkok as a main area of study, we can collect and gather information easily and conveniently.
The Y generation is chosen to be our sampling group because they are the new generation of Thai people and most of them searching for their own car. According to Evans et al., the people in this generation are materialists, brand-orientated, risk-taker, keen on business and hedonism. Furthermore, they are concerning on their appearance and searching for social status in order to be acceptable by their community. If Volvo understands needs of generation Y and targets this group as a main customer, it may boost the sale volume and generate a long run benefits with this customer group.
3.2 Data Collection
In order to increase the reliability, this paper contains both primary and secondary data. The authors form a questioner for investigate the perception of Thai people who are in Generation Y toward luxury car for the primary data. Journals, articles and books are used to support our result and analysis as a secondary data.
3.2.1 Primary Data
For primary data, we form a questionnaire, which is a combination of qualitative and quantitative data, which relates to our strategic question and the theoretical framework in this paper.
17
Survey
A survey is a tool that help researcher collect and gather the individual’s information. The survey can focus on both factual information and opinion of the participants. The advantages of using survey are collecting a larger amount of data in short time, cheaper than other data collection technique, and can be used to collect a wide range of topics that researcher is interested (Cherry, n.d.). According to Bryman (2008), Survey is suggested to use in collecting a large population while doing an interview is more suitable for a small group of sample group. Hence, we choose to develop the surveys in form of questionnaire. We use questionnaire as an indicator to examine our sample group about the perception toward luxury car and Volvo.
The main objective of doing a survey is to create questions that all participants will interpret and understand in the same way. Therefore, the authors try to write questions as short as possible with plain English in order to not create a confusing feeling to participants.
Sampling strategy
For the number for sample group, the authors choose theory from Taro Yamane to decide the appropriate number of the sample group. Yamane generated the formula to calculate number of population as follow; 2 1 Ne N n When n = Sample size N= Population size
e = The error of sampling
* 95 % of confidence level and 0.05% of level of significant are chose for this report.
According to statistic from National Statistical Office (2010), people who are age between 15-35 and live in Bangkok is 1,760,263 people. The authors assume this group of people is a Generation Y, so the number of Population size is 1,760,263. For the error of sampling, this study allows the error of sampling on 0.05; the sample size show as follows;
] ) 05 . 0 ( * 1760263 [ 1 1760263 2 n ) 0025 . 0 * 1760263 ( 1 1760263 n
18 6575 . 4401 1760263 n 95795 . 399 n
From above calculating, it can conclude that the number of sample size should be 400 people. However, the respondents in this paper are 523 due to the reason that most of the first 400 respondents are not a luxury car user. The authors decided to collect more questionnaires to increase the number of luxury car user in order to increase the reliability of this paper.
Methods of Spreading the Questionnaires
According to our observation about Generation Y which the authors assume that this group uses internet in daily life. Hence, online questionnaire is applied, the online questionnaire can create accurate, fast response, lower cost and reduce biased. We develop our questionnaire by use Google Spreadsheets program which is the free service website and easy to access as well as answering the questionnaire. After we create our own online questionnaire, we sent online questionnaire to our focus group by social network like Facebook and Twitter. Simultaneously, we also ask them to forward our questionnaire to their friends and colleagues who have high potential to buy luxury cars. When our respondents already submit the questionnaire, the result will directly send to the authors e-mail and the result was shown in form of graphs and charts. The authors use questionnaire to measure five independence variables which are demographic, social influence, personal value, brain identity and country of origin. Buying decision is a dependence variable in this study. This questionnaire is composed of 21 questioned and they are built from dichotomous questions, multiple choice questions, checklists, rating scales, and likert scales. Most of the questions are pre-coded questionnaire. However, the authors also add open-ended questionnaire in some questions in order to get new ideas from respondents as following;
Measuring variable
X1= Demographic X2= Social Influence
X3= Personal Value independent variable X4= Brand Identity
X5= Country of Origin
Y= Buying Decision dependent variable
As Fisher (2007), suggested that questionnaire should be arranged in a logical structure and should be separated into parts because it is easier for respondents to follow. Therefore, this questionnaire is divided into five parts which are general information, social influence, personal
19
value, Thai Perception and Attitude toward Volvo and luxury car and Demographic Information as follow;
Part1: general information
The main purpose of this part is to examine respondents that they are a luxury car customer or not. When researchers know this information, they can give more focus on this customer only in order to develop the strategy to match with their needs. Most of the questions in this part are dichotomous question. However, the authors also add open questions, the question asking the brand of car, and multiple choice questions, the question asking about the price of luxury car, in order to get useful information for this research.
Part 2: Social Influence
Questions in this part are formed to investigate whether the social pressure influence in individual decision or not. The questions in this part are dichotomous question, multiple choice question and likert scales. The authors have an assumption that customers are pressured by society when they search for information. The authors would like to know who help them make their decision, who is the most important reference group for customers to make their decision and how important is the information in decision process of customers.
Part 3: Personal Value
In this part, it can be separated into two main theories which are personal value and country of origin. For the question 7-8, they measure country of origin. Personal value is measured in question 9-14. For personal value, it is divided into five important points which aim to measure consumer ethnocentrism, materialism, conformity, the need of uniqueness and vanity.
All of questions in this part are likert scales because this kind of questionnaire is used to ask people about opinions and attitudes (Fisher, 2007). The authors use five point rating scale between strongly disagree to strongly agree to evaluate participants’ opinion toward these criteria.
Part 4: Perception and Attitude toward Volvo and luxury car
As a reason that this part evaluates perception and attitude, the questions in this part are also formed in likert scales. The main purpose for this part is to investigate perception of Thai people toward Volvo passenger car and ideal luxury car. The authors, then, analyze and match the criteria that Volvo already has to show as a Volvo’s strong point. On the other hand, the authors also find and develop some criteria that Volvo does not process in order to be better in satisfying customers’ needs and be more attractive for customer.
Part 5: Demographic Information
The demographic information is set in the last part of this questionnaire. As Fisher (2007) mentioned that if the researchers are going to ask for demographic information about the respondent, they should ask for it at the end of the questionnaire since people are more likely to
20
answer the personal questions if they have already invested time and effort in completing the rest of the questionnaire. Although, this part is at the end of the questionnaire, it does not mean it less important. This part is like a filter to examine those respondents is the target group for this study or not because this study focuses on people who are in Generation Y only. In additional, the authors also have an assumption that demographic is also one factors that may affect customer evaluation of alternative choices stage in conceptual framework. Most of the questions in this part are multiple choice question but the authors also add dichotomous question in the question asking respondents’ gender.
3.2.2 Secondary Data
For the secondary data, it could be categorized into three parts which are theory part, Volvo background and information part, and car industry part. For theory part, the authors find articles that support our statement from many sources such as text book and academic website. The Maladalen University online database (Emerald) is used to search for related journals and literatures. The authors also relate several theories from Consumer Behavior book in this paper as a reason that this paper study about the perception. For the Volvo background, most information comes from Volvo Company’s website. Several kinds of sources are used in car industry part. The authors got the overall statistics of Thai automotive industry from Automotive Intelligent Unit website. Some news and articles about Thai car industry are also used to support and make the authors statements more reliable.
3.3 Reliability of Result and Evaluation
Since each question and answer choice have its own meaning so, we have to coded each questionnaire in different letter and number which represent value. Therefore, we choose Statistical Package for Social Sciences (SPSS), which has been widely used in analyzing statistic data, to generate and analyze our raw data that make our data more reliable.
For the reliability and validity of this questionnaire, the authors check from alpha and sampling adequacy. The reliability and validity values for quality research should more than 0.7 and 0.5, respectively (DeVellis, 1991). The alpha for this questionnaire is 0.8253 which is higher than 0.7 and the sampling adequacy is 0.522 which also higher than 0.5, so both of reliability and validity are accepted in this paper (Appendix 2).
21
4. Research Findings and Data Analysis 4.1 Descriptive Statistic
For this part, some results from the questionnaire are chosen in order to explain the background knowledge and information that related to further parts of this paper.
4.1.1 Demographic Statistic
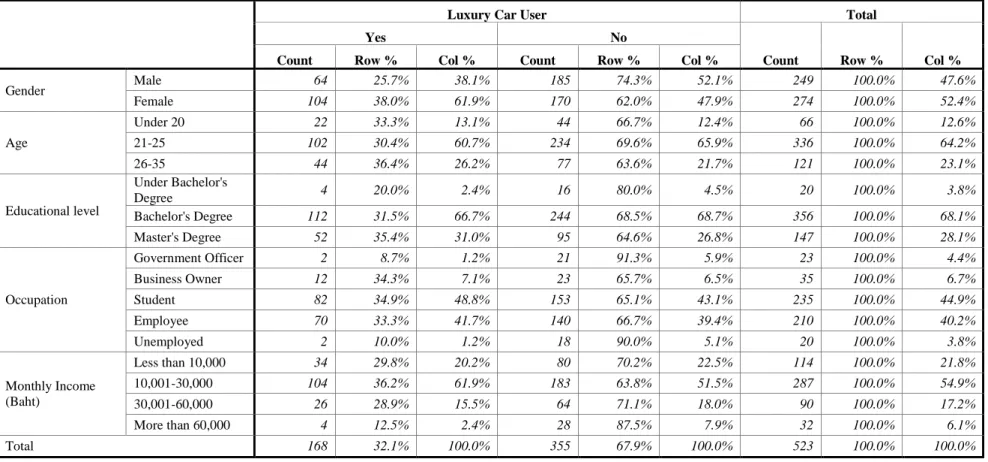
According to table 4.1.1, the total number of respondents are 523 which separated by demographic categories. From this sample group, 168 respondents are a luxury car user accounted for 32.1% and other respondents are non luxury car user with 67.8%.
The proportion of the gender with these respondents is quite balance. As 249 respondents are male (47.6%) and other respondents are female (52.4%). For the luxury car user, female has a higher percentage of using luxury car (38%) than male (25.7%).
The highest frequency of age range in this sample group is 21-25 years old (64.2%), followed by under 26-35 years old (23.1%) and under 20 years old (12.6%) respectively. Focusing luxury car user, 26-35 year old group has the highest rate of using luxury car with 36.4%.
Education levels of Thai people who are in Generation Y in this sample group are divided as Bachelor Degree for 68.1%, then Master Degree or higher and under Bachelor’s Degree with 28.1% and 3.8% respectively. Master’s Degree educational level has the highest percentage of using luxury car (35.4%) when compare with Bachelor’s Degree (31.5%) and under Bachelor’s Degree (20%).
Most of respondents occupation are student (44.9%) followed by Employee (40.2%), business owner (6.7%), government officer (4.4%), and unemployed (3.8%). Student, Business owner, and Employee are the top three occupations that have high percentage of using luxury car.
22
Luxury Car User Total
Yes No
Count Row % Col % Count Row % Col % Count Row % Col %
Gender Male 64 25.7% 38.1% 185 74.3% 52.1% 249 100.0% 47.6% Female 104 38.0% 61.9% 170 62.0% 47.9% 274 100.0% 52.4% Age Under 20 22 33.3% 13.1% 44 66.7% 12.4% 66 100.0% 12.6% 21-25 102 30.4% 60.7% 234 69.6% 65.9% 336 100.0% 64.2% 26-35 44 36.4% 26.2% 77 63.6% 21.7% 121 100.0% 23.1% Educational level Under Bachelor's Degree 4 20.0% 2.4% 16 80.0% 4.5% 20 100.0% 3.8% Bachelor's Degree 112 31.5% 66.7% 244 68.5% 68.7% 356 100.0% 68.1% Master's Degree 52 35.4% 31.0% 95 64.6% 26.8% 147 100.0% 28.1% Occupation Government Officer 2 8.7% 1.2% 21 91.3% 5.9% 23 100.0% 4.4% Business Owner 12 34.3% 7.1% 23 65.7% 6.5% 35 100.0% 6.7% Student 82 34.9% 48.8% 153 65.1% 43.1% 235 100.0% 44.9% Employee 70 33.3% 41.7% 140 66.7% 39.4% 210 100.0% 40.2% Unemployed 2 10.0% 1.2% 18 90.0% 5.1% 20 100.0% 3.8% Monthly Income (Baht) Less than 10,000 34 29.8% 20.2% 80 70.2% 22.5% 114 100.0% 21.8% 10,001-30,000 104 36.2% 61.9% 183 63.8% 51.5% 287 100.0% 54.9% 30,001-60,000 26 28.9% 15.5% 64 71.1% 18.0% 90 100.0% 17.2% More than 60,000 4 12.5% 2.4% 28 87.5% 7.9% 32 100.0% 6.1% Total 168 32.1% 100.0% 355 67.9% 100.0% 523 100.0% 100.0%
Table 4.1.1: The Frequency and Percentage of Demographic Data by Car User
23
the overall demographic results, more than half of respondents have an average income per month is about 10,000-30,000 Baht (54.9.%) which followed by range less than 10,000 Baht, 300,001 to 600,000 Baht and more than 60,000 Baht with the percentage of 21.8%, 17.2% and 6.1%, respectively. Focusing on luxury car user, respondents who have a monthly income about 100,001-300,000 has the highest percentage of using luxury car.
4.1.2 Social Influencer Statistic
Luxury Car User Total
Yes No Count Row % Col %
Count Row % Col % Count Row % Col %
Social Influencer Myself 28 41.8% 16.7% 39 58.2% 11.0% 67 100.0% 12.8% Family 118 31.1% 70.2% 261 68.9% 73.5% 379 100.0% 72.5% Friends 14 23.7% 8.3% 45 76.3% 12.7% 59 100.0% 11.3% Others 8 44.4% 4.8% 10 55.6% 2.8% 18 100.0% 3.4% Total 168 32.1% 100.0% 355 67.9% 100.0% 523 100.0% 100.0%
Table 4.1.2: The Frequency and Percentage of Social Influencer by Luxury Car User
Source: Own Illustration
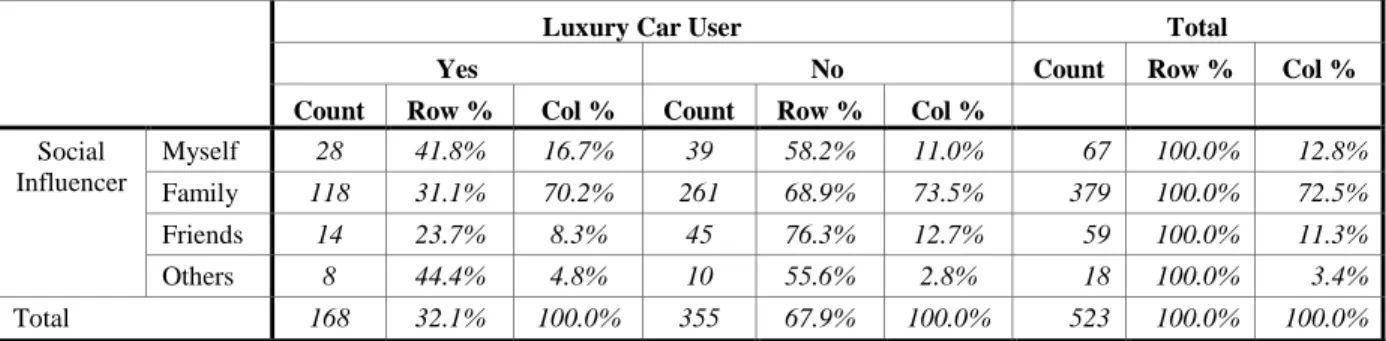
According to table 4.1.2, the authors focus on social influencer. Family is the most popular social reference that respondents ask for the opinions before purchasing car (72.55%). The second and third ranks of social influencer are himself/herself and friends with almost the same percentages which are 12.7% and 11% respectively. For the others reference, it is ranked in the last priority with only 3.4%. For more information about others, social media and colleagues is the popular alternative social referents on those respondents ask for opinions.
Same as overall sample group, respondents using luxury car get most influence for buying car from their family (70.2%) followed by himself/herself (16.7%), friends (8.3%), and others (4.8%). However, the result of the social influencer for respondents who are non luxury car user have some different. For this group, family still remains in the first priority of social influencer but friends are more important in social influencer than himself/herself.
24
4.1.3 Statistic of Car Used in Thailand
Figure 4.1.1: The Usage of Car Brand Source: Own Illustration
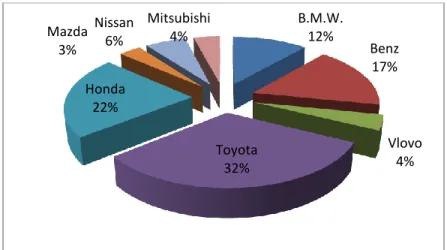
According to figure 4.11, it shows statistics of cars that the respondents use. Although the sample group from this study has 523 people and some of these respondents may not have their own car, the total car that the respondents use is 401 units with 163.3%. Because the authors give respondents opportunity to chose more than one brand if they possess more than one car, the percentage in this topic area can be over 100%. For the result of this sample group, Toyota is the brand of car that most respondents use (47.6%) followed by Honda (32.9%), Benz (24.9%) and B.M.W. (17%). The reliability of data collection from this sample group is quite high because it is in conformity with the statistic from the secondary data in figure 1.2. Both of them show that Toyota and Honda are the leader of Thai passenger car.
4.1.4 Statistic of Luxury Car Used in Thailand
Figure 4.1.2: Brand of Luxury Car that Respondents Use Source: Own Illustration
B.M.W. 12% Benz 17% Vlovo 4% Toyota 32% Honda 22% Mazda 3% Nissan 6% Mitsubishi 4% B.M.W. (L) 33% Benz (L) 48% Volvo (L) 12% Others 7%
25
In figure4.1.2, the authors focus on the number of luxury car user only. Benz, B.M.W., Volvo, Lexus and Porsche are considered as the luxury car in this research. From 168 respondents, they possess 206 units of luxury cars. Benz is the leader in the volume which is 100 units followed by B.M.W. (68 units) and Volvo (24 units). Lexus and Porsche are categorized in others group which these respondents use these brands for 14 units. This primary data (table 4.4 and figure 4.2) also match with the secondary data that we use in the beginning of this report (figure1.3: Luxury car sale volume for February 2011). Therefore, the authors could mention that the data collection from this questionnaire is a reliability data.
4.1.5 Statistic of Significant Demographic Factors on Luxury Car User
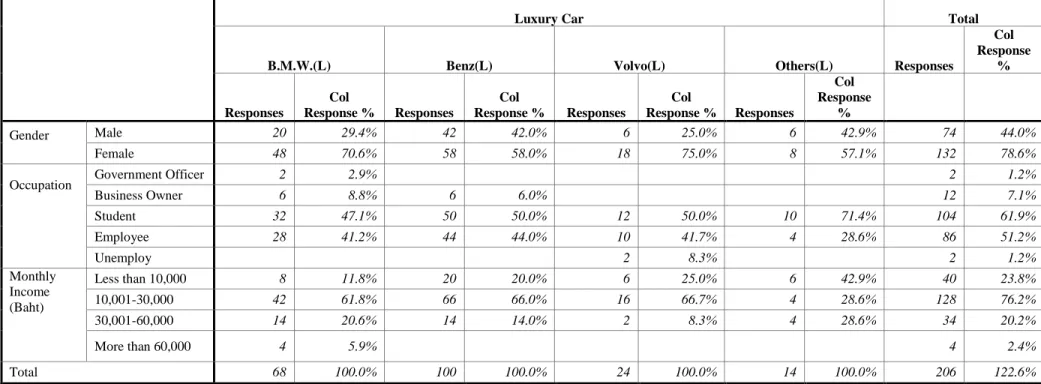
According to table 4.2.1 in hypothesis1, which the authors show in the next part, gender, occupation, and monthly income are significant factors in this study. Therefore, the table 4.1.3, it focuses on luxury car brands and the demographic factors that are significant in this paper only. For the gender factor, female has higher percentage of using luxury car than male for the entire luxury car brand. Focusing on the top three luxury car brands, the percentage that female uses luxury car has a huge different than male. However, this is one exception on Benz brand.
For overall of occupation factor, Student has the highest percentage of using luxury car (61.9%) followed by employee (51.2%), business owner (7.1%). Government officer and unemployed are the two occupations that have least percentage of using luxury car with only 1.2%. For this sample group, student and employee are two occupations using all brands of luxury car. If focus in each brand, student and employee are still in the first and second occupation that has high percentage of using luxury car in all brands.
For monthly income factor, the range of income between 10,001-30,000 Baht has the highest percentage of using luxury car for all brands of luxury car. Focusing in this range of income, it dominants more than 60% for all of the top three luxury car brands. B.M.W is the only one luxury car brand that respondents have in all ranges of income level. The other two luxury car brand, they do not have any responses in the range of income more than 60,000 Baht.
26
Luxury Car Total
B.M.W.(L) Benz(L) Volvo(L) Others(L) Responses
Col Response % Responses Col Response % Responses Col Response % Responses Col Response % Responses Col Response % Gender Male 20 29.4% 42 42.0% 6 25.0% 6 42.9% 74 44.0% Female 48 70.6% 58 58.0% 18 75.0% 8 57.1% 132 78.6% Occupation Government Officer 2 2.9% 2 1.2% Business Owner 6 8.8% 6 6.0% 12 7.1% Student 32 47.1% 50 50.0% 12 50.0% 10 71.4% 104 61.9% Employee 28 41.2% 44 44.0% 10 41.7% 4 28.6% 86 51.2% Unemploy 2 8.3% 2 1.2% Monthly Income (Baht) Less than 10,000 8 11.8% 20 20.0% 6 25.0% 6 42.9% 40 23.8% 10,001-30,000 42 61.8% 66 66.0% 16 66.7% 4 28.6% 128 76.2% 30,001-60,000 14 20.6% 14 14.0% 2 8.3% 4 28.6% 34 20.2% More than 60,000 4 5.9% 4 2.4% Total 68 100.0% 100 100.0% 24 100.0% 14 100.0% 206 122.6%
Table 4.1.3: The Frequency and Percentage of Significant Demographic Data by Luxury Car User
Source: Own Illustration
27
4.1.6 Personal Value Statistic
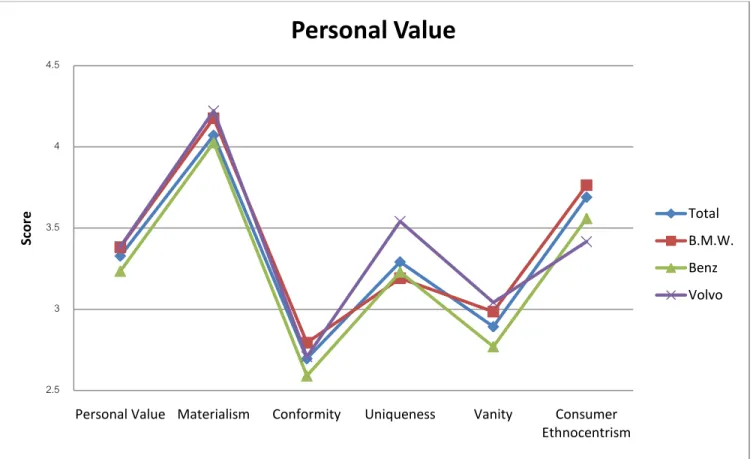
Figure 4.1.3: The Line Chart of Comparison of Point on Each Luxury Car Brand by Personal Value Factors
Source: Own Illustration
According to figure 4.1.3, the average score for personal value is 3.286 point. B.M.W and Volvo personal value score are above the mean which are 3.3824 point and 3.3861 point respectively. However, Benz’s score in personal value is 3.2325 which lower than the mean. Comparing with this top three luxury car brand, B.M.W. has the highest score in conformity (2.7941 point) and consumer ethnocentrism (3.7647 point). For other factors, Volvo brand has the highest score. For materialism, uniqueness and vanity, Volvo gets 4.2222 point, 3.5417 point and 3.0417 point respectively. Except consumer ethnocentrism that Volvo has the lowest score, Benz has the lowest score for the rest factors in personal value.
2.5 3 3.5 4 4.5
Personal Value Materialism Conformity Uniqueness Vanity Consumer Ethnocentrism Sc o re
Personal Value
Total B.M.W. Benz Volvo28
4.1.7 Brand Identity Statistic
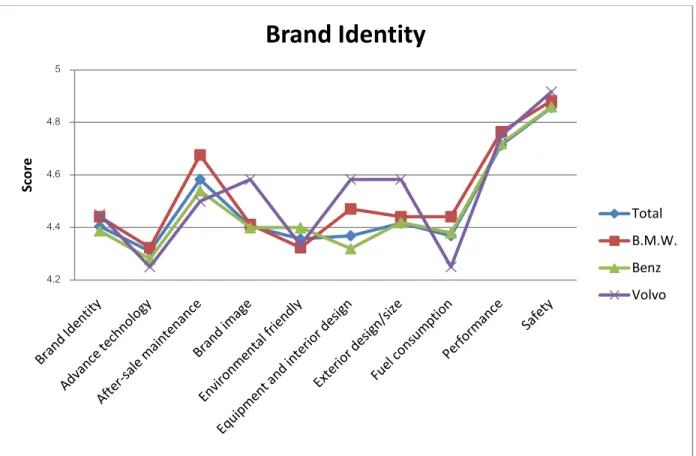
Figure 4.1.4: The Line Chart of Comparison of Point on Each Luxury Car Brand by Brand Identity Factors
Source: Own Illustration
According to figure 4.1.4, the average point for brand identity is 4.4048 point. Volvo has the highest score which is 4.5 point followed by B.M.W. (4.4412 point) and Benz (4.388 point). Comparing in each component, B.M.W. has the highest score on advance technology (4.3235 point), after-sale maintenance (4.6765 point), fuel consumption (4.4412) and performance (4.7647 point) but brand image and environmental friendly are two components that B.M.W. has the lowest scores, which are 4.4118 point and 4.3235.
For Benz, environmental friendly is the only one factor that this brand has the highest score (4.4 point). Brand identity, equipment and interior design, exterior design/size, performance and safety are factors that Benz has the lowest point.
Volvo has the highest score in four factors. Volvo’s brand image, equipment and interior design, exterior design/size score is quit higher than other brands. Although the safety score is not much different from others competitors, Volvo get 4.9167 from 5 point in safety factor which is very
4.2 4.4 4.6 4.8 5 Sco re
Brand Identity
Total B.M.W. Benz Volvo29
high. However, the disadvantage for Volvo is advance technology, after-sale maintenance and fuel consumption. Fuel consumption factor is worried for Volvo because the score is a huge behind other competitors.
4.1.8 Country of Origin Statistic
Figure 4.1.5: The Bar Chart of Country of Origin by Luxury Car Brands Source: Own Illustration
According to figure 4.1.5, the average point of country of origin is 3.6369. Therefore, there is only B.M.W. brand that the country of origin’s point is above the average which is 3.6912 point. The others two brands, Volvo and Benz get the score for country of origin 3.5833 and 3.53 respectively.
4.2 Hypotheses Testing
In this part the author will analyze the result of the questionnaire that collects from those 523 despondences. Then the authors form hypotheses that are related with the literature review part and test them in order to figure out which factors are significant and affect to the buying decision of Thai luxury car customer who are in Generation Y.
The questionnaire that the authors decide composes of 21 questions to examine five factors that have a high potential to affect consumer behavior in purchasing luxury car. The questionnaire has several types of answer as check list, dichotomous answer, open answer, likert scales answers. So the authors have to use various formulas to proof the hypothesis as follow:
3.4 3.45 3.5 3.55 3.6 3.65 3.7 3.75
Country of Original
30
Chi-square test: Chi-square test use to determine the significant level between those expected frequencies and observed frequencies in one or more categories. We use the significant level for testing hypothesis. In this research, the 95 percent confident interval is constructed so we can reject the hypothesis at the 0.05 level. (Sharp, 1979)
Pearson Correlation Test: Pearson Correlation test uses to Pearson determine the relationship and strength of the association between two variables. We use Pearson Correlation with quantitative or continuous data. (University of the West of England, 2006)
The level of the significant of p-value can be classified in to nine levels which are; Very strong positive relationship (are +.70 or higher)
Strong positive relationship (+.40 to +.69) Moderate positive relationship (+.30 to +.39) Weak positive relationship (+.20 to +.29)
No or negligible relationship (+.01 to +.19, -.01 to -.19) Weak negative relationship (-.20 to -.29)
Moderate negative relationship (-.30 to -.39) Strong negative relationship (-.40 to -.69)
Very strong negative relationship (-.70 or higher) (University of the West of England, 2006)
Hypothesis 1: The demographic data and buying decision of Thai car users who are in generation Y are not independent.
The authors formulate this hypothesis to examine that are demographic indicators, which are gender, age, education level, occupation and monthly income, have a significant relationship with buying decisions of Thai car users who are in generation Y or not.