IN
DEGREE PROJECT ENVIRONMENTAL ENGINEERING, SECOND CYCLE, 30 CREDITS
,
STOCKHOLM SWEDEN 2020
Analysis of floodplain population
dynamics in the USA
from 1790 to 2010
FIROZA AKHTER
Analysis of floodplain
population dynamics in the USA
from 1790 to 2010
FIROZA AKHTER
Supervisor
LUIGIA BRANDIMARTE
Examiner
JOAKIM RIML
Supervisor at Uppsala University
MAURIZIO MAZZOLENI
Degree Project in Environmental Engineering and Sustainable Infrastructure KTH Royal Institute of Technology
School of Architecture and Built Environment
Department of Sustainable Development, Environmental Science and Engineering SE-100 44 Stockholm, Sweden
Sammanfattning
Flodslätter är viktiga platser för samhällets ekonomiska samt sociala utveckling och har varit det sedan är lång tid tillbaka, även om de från och till har drabbats av olika katastrofer såsom översvämning och erosion. Översvämning är en av de största naturliga katastrofer som sker i USA. Ungefär 10 % av befolkningen bor i 100- och 500-års flodslätter som emellertid förändras på grund av olika anledningar, inklusive översvämningar. I denna studie undersöks den tillfälliga relationen mellan översvämning, relaterad skada, olika ingripande åtgärder och fattigdomsnivå med en befolkningsdynamik i flodslättsområden. Vidare sker denna undersökning i tre olika nivåer – nationellt: USA som ett helt land, stats-nivå: Arkansas och län: Sebastian County, Arkansas där de olika dynamikerna i de tre nivåerna jämförs. På den nationella nivån utvärderades befolkningsdynamiken med avseende på flodslätten till den totala populationen och befolkningstillväxt. Resultatet visar att befolkningsdynamiken förändras beroende på om den betraktas ur ett nationellt, statligt eller läns perspektiv. Ur ett nationellt perspektiv flyttar flodslättsbefolkningar till olika områden med tiden. Ur ett statligt perspektiv är flodslättsbefolkningar känsliga mot översvämningar, skada och olika ingripande åtgärder. På länsnivå, utöver översvämningsrelaterade variabler, är flodslättsbefolkningar känsliga mot andra socio-ekonomiska faktorer som inte behöver vara relaterade till översvämningar. Resultatet indikerar således att översvämningar inte alltid behöver vara den faktorn som styr befolkningsdynamiken i flodslättsområden på den lokala nivån samt beslutet att flytta till en flodslätt påverkas av olika socio-ekonomiska faktorer, inklusive översvämning. På den nationella nivån kan däremot både påverkan av översvämningar och relaterade variabler på befolkningsdynamiken i flodslättsområden observeras.
Abstract
Floodplain is an important location for the economic and social development of society throughout history, although it afflicted by different disasters like floods and bank erosion from time to time. Population dynamics and distribution trends have important effects on the landscape and society. Population dynamics in floodplains influenced mostly by the flood events and related human activities to protect themselves and the properties. Thus, floodplain population dynamics is vital to understand human-nature relationships, disaster risk assessment, flood forecasting and flood damage costs in the floodplains. Economic losses and fatalities due to flood events increase with increased flood frequency and flood magnitude. Extreme hydrological changes are responsible for such changes in the flood events. Population growth, urbanization and developmental activities worsened the situation further in the floodplain areas. Learning effect, i.e. flood memory is noticeable after the flood which diminishes with time, however, levee, which is a popular flood protection measure, causes further reduction of learning effect. Researchers suggest that levees create a false sense of safety and can influence the mobilization of floodplain population. Several pieces of research indicate that along with flood events and intervention measures, inundation depth, durations, flood type (coastal/ riverine), economic, technological and political characteristics of the societies influence flood memory, hence, influence floodplain population dynamics. However, long term floodplain population dynamics and how it is related to different flood-related, i.e. hydrological and sociological variables are yet to be confirmed. Flood is one of the major natural disasters in the United States. About 10% of the population lives in the 100-year and 500-year floodplain of the United States. This study carried out to investigate the long-term trend of floodplain population dynamics in the USA and how the dynamics changes from country to state to county level considering Arkansas State and Sebastian County to observe the difference. Also, the relationships of floodplain population dynamics with hydrological and sociological variables such as flood events, damage, intervention measures and poverty assessed in the national, state and county level. Then the dynamics of the national level, the state (Arkansas) level and the county (Sebastian) level were compared to identify changes in dynamics from macro to micro-scale. Floodplain population dynamics evaluated in terms of population growth rate and the ratio of floodplain population to the total population from 1790 – 2010. The median centroids of the population growth rate from 1790 – 2010 were estimated to observe the changes in the central tendency of the population growth rate in the total area and in the floodplain overtime to locate the typical place of floodplain population growth. High-resolution raster image (1 km x 1 km) of historical population data and a high-resolution raster image (250 m x 250 m) of floodplain data were analysed using ArcGIS to evaluate floodplain population dynamics. Historical data regarding flood events, damage, structural and non-structural flood intervention measures and poverty from available databases were extracted, processed and analysed to establish the relationship among population dynamics, hydrological and social variables. Finally, the population dynamics of the three levels were compared statistically and discussed for changes. It is found that the central tendency of the total population growth rate and floodplain population growth rate of the USA shifts from east to west direction. The central tendency of the overall population growth rate located near the lower Mississippi river basin in the 1800s. It is consistent near the geographical centroid of the USA in Kansas since 1900. For the floodplain population, the central tendency of the growth rate stayed consistent in Arkansas from 1910 – 2010, i.e. in the lower Mississippi river basin. This location indicates the floodplains in Arkansas was preferable for floodplain population settlement for many decades. Change in floodplain population proportion of the whole country USA from 1790 – 2010 shows that the proportion of floodplain population is more than 80% during the initial years of settlement. Then it reduced to less than 40% over time. At the state level – Arkansas, the proportion of floodplain population is also more than 80% during initial settlement and reduced to less than 60% over time for counties with high percentage floodplain area. Flood events, structural and non-structural protection measures influenced floodplain population dynamics over time and learning effect, i.e. social memory of flood found was seven years. At the county level- Sebastian county, Arkansas, the proportion of floodplain population varies significantly with a variance of 0.04 and a standard deviation of 0.19. The ratio of floodplain population in Sebastian was 29% in 1820, which increased and decreased over the years and about 70% in 2010. In addition to flood events, different intervention measures, the floodplain population dynamics in the Sebastian county are influenced by the social, economic and political phenomenon, examining which is out of the scope of this study. The learning effect of flood seems to be eight years in the case of Sebastian county. The population dynamics influenced by a different social, geographical, economic, political and hydrological phenomenon which makes it a complicated system to comprehend within the present scope of the study. The result shows that the floodplain population dynamics can vary for different geographical scale. Therefore, the geographic extent should also need to consider while using population dynamics in flood disaster management and mitigation strategy development, policy formulation and implementation. Keywords
Acknowledgements
At first, I would like to express my heartfelt gratitude to my supervisors Luigia Brandimarte and Maurizio Mazzoleni, for their consistent guidance and support through their experiences and expert knowledge. I also thank them for providing plenty of encouragement throughout the research project that helps me to complete it within the stipulated time.
I would also like to thank Md. Ashraf Uddin, director-general, Governance Innovation Unit (GIU) Prime Minister's Office, Bangladesh, and the whole GIU team for providing me with a scholarship and continuous support for the last two years which help me financially to complete my master’s program.
I would like to thank my friends and colleagues in Sweden and Bangladesh for their continuous encouragement and support that helps me to continue my study in Sweden. Finally, I would like to thank my parents, who always encourage me in my studies no matter what the situation is. Also, thanks to my husband, MD Didarul Alam Tusher, for his continuous help, support and patience throughout the study; and to my 11- month old daughter, Arya Arfiyaz who unknowingly sacrificed her enjoyment with her mother to let her complete this thesis.
Table of contents
1 Introduction ... 1
Background ... 1
Problem Definition, Research Questions & Objectives ... 4
Literature Review ... 7
Flood risk and society ... 7
Human response to flood ... 8
Methods of assessing population dynamics in floodplain ...10
Floodplain population in the United States ... 12
2 Methodology ... 13
Data Collection ... 13
Country-level: the USA, Floodplain Population Dynamics Estimation ... 15
State-level: Arkansas, the temporal relationship of floodplain population dynamics with flood events, damage, interventions ... 17
County-level: Sebastian, the temporal relationship of floodplain population dynamics with flood events, damage, interventions ... 18
Comparison of floodplain population dynamics from the country (USA) to state (Arkansas) to the county (Sebastian) level ... 19
3 Results ... 20
Country-level: the USA, Total and Floodplain Population Dynamics ... 20
State-level: Arkansas, temporal relationship with flood events, damage, interventions ... 27
County-level: Sebastian County, Arkansas, temporal relationship with flood events, damage, interventions ... 40
Change in floodplain population dynamics from country to state to the county level: ... 45
4 Discussion ... 47 5 Conclusion ... 52 References... 57 Appendix I ... 61 Appendix II ... 64 Appendix III ... 65 Appendix IV ... 66 Appendix V ... 71 Appendix VI ... 73 Appendix VII ... 74
List of figures
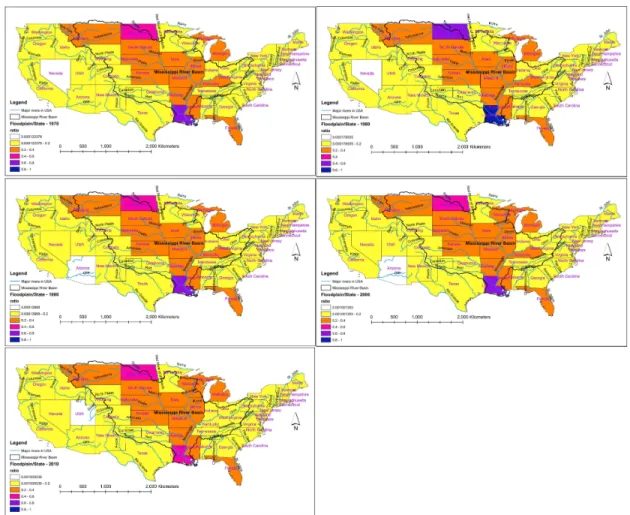
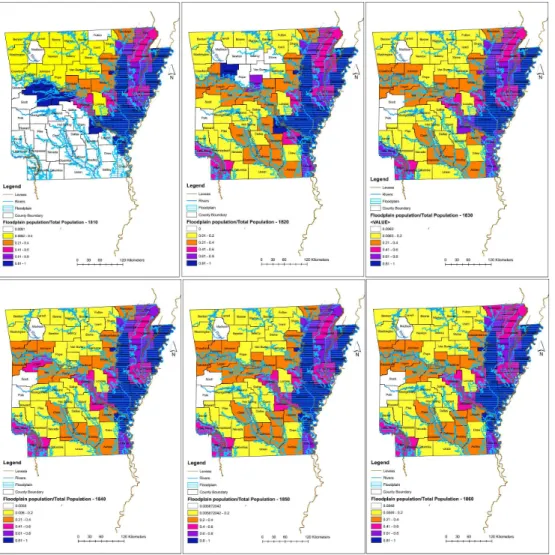
Figure 1: Type of built-up land in floodplain (BLF) area, (a) Edge-expansion, (b) Leapfrogging, (c) Infilling (Han et al., 2020) ... 11 Figure 2: The picture shows the total population and floodplain population dynamics in the USA in terms of growth rate and temporal change in the central tendency of the growth rate in terms of the median centroid. In the inset, the zoomed-in figure shows the difference in the location of the median centroid of the total population growth rate and floodplain population growth rate from 1790 – 2010. ... 20 Figure 3: Temporal change in total population, floodplain population and growth rate ... 21 Figure 4: The figure shows the ratio of floodplain population to the state population for the whole USA (1790 - 1860) starting from 1790 on the top left to right direction consecutively. The ratios classified in 6 classes and shows in 6 different colours – 1. No data (White); 2. 0 – 0.2 (Yellow); 3. 0.2 – 0.4 (Orange); 4. 0.4 – 0.6 (Pink); 5. 0.6 – 0.8 (Purple); 6. 0.8 – 1.0 (Blue). (Continued to next page) ... 23 Figure 5:The figure shows the ratio of floodplain population to the state population for the whole USA (1870 - 1960) top left to right direction consecutively. (Continued to next page) ... 24 Figure 6: The figure shows ratio of floodplain population to the state population for the whole USA (1970 - 2010) starting from 1790 on the top left to right direction consecutively. The ratios are classified in 6 classes and shows in 6 different colors – 1. No data (White); 2. 0 – 0.2 (Yellow); 3. 0.2 – 0.4 (Orange); 4. 0.4 – 0.6 (Pink); 5. 0.6 – 0.8 (Purple); 6. 0.8 – 1.0 (Blue). ... 25 Figure 7: Temporal change in population and floodplain to the total population ratio in the contiguous USA from 1790 to 2010. ... 26 Figure 8: This figure shows the state with county boundaries, floodplain area, river and levee locations in Arkansas state. ... 28 Figure 9: The figure shows the ratio of floodplain population to the county population for Arkansas state (1810 – 1860) starting from 1790 on the top left to the right direction. The ratios classified into six classes and shows in 6 different colours – 1. No data (White); 2. 0 – 0.2 (Yellow); 3. 0.2 – 0.4 (Orange); 4. 0.4 – 0.6 (Pink); 5. 0.6 – 0.8 (Purple); 6. 0.8 – 1.0 (Blue). (Continued to next page) ... 33 Figure 10: The figure shows the ratio of floodplain population to the county population for Arkansas state (1860 – 1950). The ratios classified into six classes and shows in 6 different colours – 1. No data (White); 2. 0 – 0.2 (Yellow); 3. 0.2 – 0.4 (Orange); 4. 0.4 – 0.6 (Pink); 5. 0.6 – 0.8 (Purple); 6. 0.8 – 1.0 (Blue). (Continued to next page)... 34 Figure 11: The figure shows ratio of floodplain population to the county population for Arkansas state (1990 – 2010) starting from 1990 on the top left to right direction consecutively. The ratios are classified in 6 classes and shows in 6 different colors – 1. No data (White); 2. 0 – 0.2 (Yellow); 3. 0.2 – 0.4 (Orange); 4. 0.4 – 0.6 (Pink); 5. 0.6 – 0.8 (Purple); 6. 0.8 – 1.0 (Blue). ... 35 Figure 12: This figure represents the relationship of floodplain population dynamics in terms of the total population, floodplain population, total population growth rate, floodplain population growth rate and floodplain to the total population ratio with flood events, damage value in thousand USD, structural protection measure (i.e. levee construction, related legislations and decisions) non-structural protection measure (i.e. flood insurance initiation, different decisions related to flood insurance)... 38 Figure 13: Temporal change in floodplain population and flood damage values in million USD. The top left picture (a) shows the total floodplain population, and flood damage occurred with values over 10 million USD. The top right picture (b) shows the same damage values with floodplain population growth rate. The bottom picture (c) shows the same damage values with floodplain population ratio. ... 39 Figure 14: The picture shows Floodplain population change with communities joined in the flood insurance program over time from 1970 to 2010. ... 39 Figure 15: Relationship of floodplain and state poverty percentage to the population dynamics (total population) from 1990 to 2010. ... 40 Figure 16: Sebastian County, Arkansas, its floodplain area and location of levees. ... 40 Figure 17: Trendline of floodplain population to the total population ratio from 1820 – 2010 ... 41 Figure 18: Floodplain population dynamics with flood events, structural and non-structural flood protection measures. Total population, floodplain population, population growth rate (total and floodplain), the ratio of the floodplain to the total population plotted with flood events, structural protection measures (levee) and non-structural protection measures (flood insurance). ... 41
Figure 19: Floodplain population dynamics with flood damage value in a million USD. In the top left picture (a), total floodplain population, and flood damage plotted. In the top right picture (b), the floodplain population growth rate plotted with approximate flood damage in USD rounded to nearest million USD. In the bottom figure (c), the floodplain population ratio plotted with approximated flood damage in USD rounded to nearest million USD. ... 42 Figure 20: This figure shows the total floodplain population over time with the cumulative percentage of communities joined in the flood insurance program over time. ... 42 Figure 21: Poverty percentage plotted with a total population of Sebastian county and floodplain. . 43 Figure 22: Comparison of floodplain population dynamics that change from country-level of United states to state level in Arkansas and the county level in Sebastian. ... 46
List of Tables
Table 1: Datasets used for spatial and temporal analysis of floodplain population dynamics, historical flood events and intervention measures ... 14 Table 2: Variance and standard deviation in the temporal change of floodplain population dynamics in terms of the floodplain to the total population and floodplain population growth rate from the country (USA) to the state (Arkansas) to the county (Sebastian) level ... 46
Abbreviations
BLF Built-up land in the floodplain CBavg Characteristic average brightness
CRS Community rating system
FEMA Federal Emergency management agency ICC Increased cost compliance
LMRB Lower Mississippi river basin MRC Mississippi river commission NFIP National Flood Insurance program
NOAA National Oceanic and Atmospheric Administration NWS National Weather Service
Pre-FIRM Structures constructed before the effective date of an initial Flood Insurance Rate Map (FIRM) or on/before December 31, 1974
SHELDUS Spatial Hazard Events and Losses Database for the United States USA United States of America
USD US Dollar
1 Introduction
Background
From the earliest known civilisations, humans have settled in floodplain areas. For example, Mesopotamia and Egypt had developed in the fertile riparian regions of the Tigris and Euphrates and Nile rivers. Ecological conditions and geographical location of these floodplains offered favourable conditions for the cultural organization, agricultural development, trade, and economic growth that influence the choice of the area (Di Baldassarre et al., 2010). At present, due to the evolution of food production, water and communication technologies, infrastructure systems, and shifts in economic policies (pre-modern to capitalist), societies do not require to rely on the direct proximity to the floodplain for developmental activities (Di Baldassarre et al., 2013). Nevertheless, till present floodplain areas are the location of some largest urban settlements (McGranahan et al., 2007); nine of the ten largest urban agglomerates in the world (United Nations, 2012) are in the deltas or floodplain areas (Di Baldassarre et al., 2013). Over time land-use patterns changed in composition, and the size of the settlement and its ecological impact increased significantly. Therefore, every year more than 100 million people get affected by flooding and considered as the most damaging natural hazard (Ohl and Tapsell, 2000; Opperman et al., 2009; Di Baldassarre et al., 2013). Increasing population in the floodplains is one of the main reasons for increases in the flood risks, together with considerable changes in climate(Milly et al., 2002; Di Baldassarre et al., 2010). Flood risk is different among different population groups, which can be distinguished by the availability of resources to the population groups for prevention, mitigation, and recovery from flood events (Masozera et al., 2007). Di Baldassarre et al. (2013), argued that sufficient understanding of the dynamics of flood risk is still lacking, preventing the formulation of sustainable and equitable floodplain management strategies. They also stated that understanding flood risk dynamics and managing floodplains related challenges requires a transdisciplinary research approach that uses theories and understandings from both natural and social science perspectives.
Flood risk is the result of the possibility of flooding of human interests, such as industries, properties, and valuables of the societies. (Samuels et al. 2006; Collenteur et al., 2015). Typically, flood risk is a combination of chances and characteristics of the flood event, populations, and assets that is subjected to flooding and the capacity of that society to cope up with that event (UNISDR 2011; IPCC 2012; Collenteur et al., 2015). There are several protection measures that human society adopts against flooding. The first method is to protect the lands from flooding through engineering structures, such as building dykes, levees, and any such structural flood protection measures. It lowers the flood hazard. The second method involves adaptation to flooding events; for example, an increased level of flood forecasting initiative reduces vulnerability to flooding. The third method is reducing flood exposure, which includes relocating from high-risk areas or stopping or reducing human settlements in flood-prone areas (Collenteur et al., 2015).
The conventional approach to address the flood risk is the first method, which is the implementation of structural flood protection measures, such as levees, dykes, or flood-control reservoirs. Structural protection measures significantly reduce the probability of flooding at the time of implementation (Di Baldassarre et al., 2018). People feel safer with the introduction of flood protection measures such as levees. The perception of flood risks changes in the presence of structural measures (Collenture et al., 2015). According to the excellent presentation (Rogers, 2004) about the ‘evolution of levees along the lower Mississippi,’ it has been found that people tend to increase levee height, extend levee length, renovate and improve design continuously to mitigate increasing flood risk. However, many scientists identified structural flood protection measures as an issue in floodplain management, as an increased feeling of safety induced by flood protection can increase the level of settlements and high-value assets in the floodplain, which ultimately will increase the risk of exposure (Di Baldassarre et al., 2018). For the second method, an increase in flood warning time and experience gained by the population increase coping capacity to the flood risk (Wind et al., 1999; Collenture et al., 2015). A case study on flood damage analysis in Meuse River (in Belgium and Netherlands) for 1993 and 1995 flood shows that, for two consecutive flood events, damage for the second flood event is lower than that of the first event. Also, it is true
even when the second flood event is hydrologically comparable to the first flood event (Wind et al., 1999; Collenture et al., 2015). The reason for such reduction in flood damage in case of a second flood event is due to improvement in risk awareness, preparedness and organizational emergency management. This improvement triggered after the first flood event, which ultimately reduces vulnerability, damage and reinforces flood protection infrastructure (Kreibich, H. et al., 2017). Thus, the vulnerability of the floodplain population reduces through coping with the flood events (Collenture et al., 2015). For the third method, there is a possibility to regulate the urbanization of floodplains if favourable conditions exist (Collenture et al.,2015; Raymond et al., 1981). However, encroachment regulation is not much effective in restricting urban developments (Pottier et al. 2005; Collenteur et al., 2015). Such rules are effective after experiencing the result of a flood event by the community. Usually, the assumption is that people and institutions become more aware after a flood event and limit people from settling there. Collenteur et al. (2015) show that the relationship between flood event and population dynamics is not as straightforward as hypothesized. Floodplain population dynamics may influence by many drivers such as economic, crisis, wars and shows a different pattern in different socio-economic contexts.
Population data represent an essential component in studies focusing on human– nature dynamics, disaster risk assessment, and environmental health (Leyk et al., 2019). Floodplain population dynamics is an important subject matter from a technical, social, and economic point of view. With structural protection measures, the population moving into floodplain are at higher risk when a major flood event occurs (Di Baldassarre, 2018). Although structural measures bring economic benefit to these areas, the damage value in the case of a large flood event can cause a significant financial burden on a country (Di Baldassarre, 2018). In different studies, floodplain population dynamics investigated differently. Collenteur et al. (2015) used historical population growth rate in the USA floodplain and showed the relationship between population growth rate with property damage. The availability of sufficient data is an essential factor for analyzing population dynamics, which is sadly not easy to find for most of the countries. Therefore, researchers use different indicator-based approach to evaluate floodplain population dynamics. Han et al.
(2019) used built-up land in floodplains (BLF) to assess the impacts of BLF growth modes (e.g., patch sizes and expansion types) on flood vulnerability. BLF is a vital indicator of the socio-hydrological system, and its dynamics are crucial to understanding and managing flood risk. Nighttime lights provide a novel data source for the detection of urban expansion of an area (Xu et al., 2016). Mård et al. (2018) used nightlight data to understand the relationship between long-term changes in human proximity to rivers and the occurrence of catastrophic flood events. At present, very high-resolution population density map makes it easier to evaluate flood exposure and analyze local flooding and human tendency to avoid harm in an area (Smith et al., 2019). For the thesis purpose, floodplain data used from GFPLAIN250m, a global high-resolution dataset of Earth’s floodplains (Nardi et al., 2019) and the gridded population data from the reconstruction of high-resolution human population distribution raster of the USA by Fang et al. (2018) to evaluate floodplain population dynamics.
Evaluation of human-environment interactions and understanding their temporal dynamics is possible through using high-resolution spatial information about historical population distribution. However, limited data availability makes it complex to reconstruct human population distribution over timescales of centuries. United States of America (USA) has census records of its population since 1790. In their study, Fang et al. (2018) used a parsimonious model based on natural suitability, socioeconomic desirability, and habitability to generate 1-km decadal population maps for the conterminous US from 1790 to 2010. The availability of historical data in grid format makes the USA suitable for analysing historical floodplain population dynamics.
Problem Definition, Research Questions & Objectives Problem definition
As mentioned before, to understand human–nature interrelationships, disaster risk assessment (Leyk et al., 2019) and to estimate and forecast damage cost due to flooding, it is required to evaluate floodplain population dynamics. With the enhanced frequency and magnitude of floods due to extreme hydrological changes,
economic loss and fatalities caused by floods have increased significantly (Jongman et al., 2014; Alfieri et al., 2016; Di Baldassarre et al., 2017). The situation aggravated if the population growth, urbanization, and development activities take further place in the floodplain areas (Di Baldassarre et al., 2017). The learning effect is the most significant right after the flood, and very few effects left after two to three years (Bubeck et al., 2012; Collenture et al., 2015). The construction of levees creates a feeling of safety, which can influence the mobilization of people in the floodplain (Collenture et al., 2015). Therefore, flood events and intervention measures both shape the floodplain population dynamics. However, which variables influence the population dynamics the most is not yet clear. In fact, Bubeck et al. (2012) show that flood memory varies in different societal contexts. These variabilities are the result of impacts of the flood events, inundation depth, durations, and the coastal or riverine type and also, economic, technological and political characteristics of societies (Collenture et al., 2015).
Therefore, it is essential to know floodplain population dynamics to evaluate people exposed to flood risks and how different measures impact this dynamic throughout time. As mentioned before, studies conducted to understand this dynamic in different countries. Income data, property value, housing type were evaluated inside and outside of floodplain at Austin, Texas, to understand the vulnerability of the people living in the floodplain (Lee et al., 2014). Flood exposure evaluated using high-resolution population data for different developing countries like Burkina Faso, Cambodia, Ghana, Haiti, Madagascar, Malawi, Mexico, Mozambique, Philippines, Puerto Rico, Rwanda, South Africa, Sri Lanka, Tanzania and Uganda to estimate population living in 10-, 100-and 1000-year floodplain (Smith et al., 2019). Collenture et al. (2015), studied USA population dynamics in two levels. A large-scale county-level population growth rate trend was evaluated for the whole USA and develops a relationship between property damage at the county level due to flood events and population growth for the period of 1960 - 2010. For the second level, a case study conducted at a reach of the Mississippi River and the territory, which was affected by flooding in 1993 to understand the similar relationship at a micro-scale and compare the results with a large scale analysis (Collenture et al. 2015). Qiang (2019) used the FEMA flood zone map and showed spatial trends nationally for the
USA population in 2015 and local deviations in and outside of the flood zone. Although there is a substantial quantity of research conduct on this topic, some questions remain to be answered. Such as, what is the long-term trend of floodplain population in the USA? How the population grows in the floodplain historically? What were the driving factors for changes? What do the relationships of floodplain population change with flood events and protection measures? Is there any change in the population dynamics after a large flood event? Is there any change in dynamics from a large scale to a smaller scale?
For this study knowledge gap is identified from the literature review and which is the temporal distribution of floodplain population dynamics and how it changed historically in the case of the USA. What is the trend of the population living in floodplain compared to the total population and how the floodplain population change throughout time? Thus, the thesis aims to analyze the temporal nature of floodplain population dynamics at three different administrative levels of the USA - country, state, and county level. Also, tried to understand the relationship between population dynamics with different flood events occurred and damage caused due to floods and flood protection measures implemented.
Research questions
1) How does floodplain population dynamics change from country to state to county level in the USA from 1790 to 2010?
2) What are the relationships of flood events, related damages, flood protection measures, and poverty with the floodplain population dynamics in a selected study area?
Research objectives
1. Estimation of floodplain population dynamics at the country level: Contiguous US 2. Estimation of floodplain population dynamics at the state level: Arkansas, temporal relationship with flood events, damage, interventions
3. Estimation of floodplain population dynamics at County level: Sebastian, temporal relationship with flood events, damage, interventions
4. Comparison of the floodplain population dynamics from country to a state to a county level.
Literature Review
The purpose of the literature review is to identify previous research done in this subject, what methods did they use, and what the results are. The study topic is interdisciplinary, and the result of each study can vary for different societal and geographic contexts. A literature review helps to understand the subject of interest and the knowledge gap within. Literature explored is segregated into two categories - population dynamics in floodplains in different countries and human response to flood risk. Various studies show the relation of floodplain population dynamics and social response to the flood accordingly—brief of these studies given in the following sections.
Flood risk and society
Winsemius et al. (2016), in their study, integrates existing global flood risk projections, socio-economic development dynamics, and climate change. The predictions based on an ensemble of climate model outputs, socio-economic scenarios, and a state-of-the-art hydrologic river flood model combined with socio-economic impact models. The result of the study had shown that global socio-economic damages increase faster than global financial wealth. Also, Willner et al. (2018) showed the relation between river floods and loss in GDP on a global scale. Alfieri et al. (2016) assessed four measures as an adaptation strategy for future river flooding in Europe that will increase due to climate change and socio-economic drivers. The steps were - an increase in flood protection levels, reduction of the peak flows, reduction of vulnerability, and relocation. Using the hydrological and hydraulic models, the authors estimated population affected and expected damage from flood for selected return periods. The study found that the use of rising flood protection only reduces the frequency of small flood and exposes society to less frequent but catastrophic floods, which take long recovery processes. Therefore, adaptation
efforts should favour measures targeted at reducing the impacts of floods, rather than trying to avoid them (Alfieri et al., 2016).
Human response to flood
Human response to flood investigated by using a modelling approach to mathematical represents the complex human-flood interactions. For example, in Di Baldassarre et al. (2015), the authors proposed a socio-hydrological model to explain the floodplain population dynamics associated with the flood risk. The model adopts the concept that after a flood event, the community builds memory. As a result, either population density reduced in the floodplain or the community build or heightened the levees to protect floodplain. The memory of flooding decays with time, and population density increased after a certain time. In this study, they use this model to investigate the dynamics of flood and society and found that it provides useful insights into flood risk management. The result of the study shows that flood-poor periods are also a matter of concern for societies adopted flood protection structures as they tend to lower the memory of flooding and therefore increase societal vulnerability in case of catastrophic flood events. The study suggests long-term risk awareness measures in a vulnerable area. The same model applied was applied to Rome to represent the dynamics in Rome (Italy) along the Tiber river (Di Baldassarre et al. 2017). The study divided into two parts. Firstly, a sociohydrological study carried out by using long time series of hydrological (extreme flood events) and social (human population dynamics) processes, along with information about human interactions with the environment (flood defence structures). Secondly, the result compared with the result of a socio-hydrological model (Di Baldassarre et al. 2015) simulating the dynamics emerging from the mutual shaping of floods and societies. The result shows that the said socio-hydrological model captures the increasing floodplain population density in Rome that occurred in the 20th Century after the construction of floodwalls. However, other external drivers, like climate, economic growth, regional trends, have a major impact on flood risk dynamics. Sometimes population movement from/ to the floodplain is not related to flood risk (Di Baldassarre et al., 2017). The result is consistent with the result of another study done by Collenteur et al. (2015). This study used regression analysis to show the relationship among population census data, flood hazard, related property damage
and inflation rate. The study conducted on two-level. One is evaluating the relationship flood event, property damage, and population growth in the counties of the United States. In the second level, a case- study analysis done of the 1993 Mississippi flood in St. Louis city of Missouri. The analysis used Satellite image of flood extent and raster format of population census data. Flood-affected block group and percentage of flooded block calculated using GIS. The population growth in the flooded area and the unaffected area was calculated, showing the difference in growth between the two. The calculation of the share of the population living inside and outside the floodplain, enabling the comparison through time. The study results of the first level shows there is a positive relation between flood events, property damage, and population growth. The case study results showed that the learning effect exists, and it can build up at an institutional and community level. Also, the learning process is sensitive to the system changes, such as structural measures (e.g., levees) taken to prevent flooding (Collenteur et al. 2015). In 2018, an interdisciplinary research agenda proposed by esteemed researchers in this field regarding the exploration of untended consequences of structural flood protection (Di Baldassarre et al. 2018). They evaluate the issues of structural flood protection measures. Such as, Communities are exposed to the potentially catastrophic and less frequent flood events (White, 1994; Tobin, 1995; Burby, 2006; Kates et al., 2006; Burton and Cutter, 2008; Montz and Tobin, 2008; Scolobig and De Marchi, 2009; Ludy and Kondolf, 2012; Di Baldassarre et al., 2013a, b; 2015; Wenger, 2015; Di Baldassarre et al., 2018). Higher protection levels trigger increased urbanization which will then require even higher protection standards (Di Baldassarre et al., 2015). Also, structural flood protections generate a sense of security among the protected people, which can reduce preparedness, thereby increasing vulnerability (Tobin, 1995). The authors stated, there are very few studies focused on increased vulnerability, such as the false sense of security caused by the presence of levees. Thus, it is still not identified what the social, technical, and hydrological conditions influence the emergence of the levee effect and to what extent. Therefore, they suggested a research agenda comprising of three components - (1) comparative analysis of a large dataset of different case studies, (2) long-term monitoring of exposure and vulnerability dynamics, and (3) utilization and development of new
methods to explore the long-term dynamics of flood risk changes and unravel the primary mechanism generating levee effects (Di Baldassarre et al. 2018).
Methods of assessing population dynamics in floodplain
Population growth rate: Relationship between population growth rate and other variables such as damage and inflation rate checked using regression analysis (Collenteur et al., 2015). The population growth rate calculated using the following equation –
Growth rate = ((Population X year - Population (X – 10) year)/ Population (X – 10) year) x 100 …(1)
In this study, ordinary regression analysis used to assess the relationship between population growth rate, flood event, and property damage.
Nighttime light data: Mård et al. (2018) and Soto Gomez et al. (2015) used nighttime light data to compute human proximity change from the river. Nighttime light data used were the series of global Nighttime Lights Composites from 1992 – 2013, freely available from the US National Oceanic and Atmospheric Administration (NOAA). The data were in a raster format with 30-arcsecond resolution. The values of each cell correspond to brightness, which represents with dimensionless numerical integer value ranging from zero to 63. As per the study of Soto Gomez et al. (2015), nightlight images analyzed in several steps. At first, the distribution of cells analyzed as per brightness values. Histograms plotted for the cell values, and any potential temporal trend in the histograms identified. Then changes of lit areas were evaluated by calculating the ratio of the lighted cells to the total number of cells. Then the general brightness trend was estimated. Characteristic average brightness (CBavg) derived from the ratio of summation of the brightness values of all the cells to the summation of the total number of cells. The changes of CBavg over time were analyzed to determine if any noticeable trend could be identified (Soto Gomez et al., 2015). Xu et al., 2016 used integrate nightlight data, vegetation index and land surface temperature data to evaluate urban expansion in China between 1992 – 2015 to see the urban land expansion in China.
Built-up land in floodplains (BLF) computation: Built-up land in floodplains (BLF) is a vital indicator of the socio-hydrological system, and its dynamics are crucial to understanding and managing flood risk. It is the developed area for city or settlement in the floodplain. There are different type of BLF, such as edge expansion, leapfrogging, infilling (Fig. 1). Edge expansion is the expansion of the developed area, i.e. city area or settlement area along the edge of the BLF without any flood protection (Fig. 1). Leapfrogging is the patched development without flood protection in the floodplain outside the BLF (Fig. 1). Lastly, infilling is a new development within a flood protected BLF area (Fig. 1). The study used floodplain data from hydrodynamic model, urban land expansion in China and build-up land data from the Global Human Settlement (GHS) data. They used several formulas to expansion type of built-up land in floodplain and relationship between BLF growth and flood occurrence. Among different kinds of BLF discussed, both the leapfrogging and the edge-expanding BLFs are significantly associated with flood occurrence, while the infilling type is not (Fig. 1). The patch size and expansion type can thus influence the vulnerability of BLF patches (Han et al. 2020).
Figure 1: Type of built-up land in floodplain (BLF) area, (a) Edge-expansion, (b) Leapfrogging, (c) Infilling (Han et al., 2020)
Euclidean distance measurement: Euclidean distance method in ArcGIS was used with a satellite image for population density and water bodies to evaluate the closeness of community to the water body (Kummu et al., 2011).
Floodplain population in the United States
NYU Furman Center analyzed population and housing data and provided a summary of demographic and housing condition in the floodplain of the United States. In the report published by NYU Furman centre, “Data Brief: U.S. population in floodplains”, poverty rate, ethnicity, the age distribution of the people living in 100 – and 500 – year flood plain in the USA elaborated. This analysis based on population data from 2011 – 2015. In 2011 – 2015, 5% of the total population in the USA lived in the 100-year floodplain, which is around 15 million people. Approximately 10% of the total population, i.e. 30 million people lived in combined 100 – and 500 – year floodplain in the same period (Peri, Rosoff and Yager, 2017). The population living in USA 100-year floodplain is about 41 million, i.e. the total population exposed to severe flooding risk is 2.6 – 3.1 times higher than the previous estimate shown (Wing et al. 2018). This exposure will increase further in future, which can be exacerbated by the future climate change (Wing et al. 2018). “Housing in the US floodplain” report of FEMA who is responsible for administering the national flood insurance program (NFIP), did not take into account the future sea-level change estimates while measuring flood risks for the country. Therefore, more vulnerable people exist who live in the actual flood-prone area but not identified by FEMA. Masozera et al. (2006), did a case study about the impact of Hurricane Katrina across different income group in New Orleans. The research shows, the areas that had moderate or worse damage had a 29.2% poor population of compared to 24.7% in the undamaged or limited damaged area. About 21.8 million people in the United States live in the 100-year floodplain during 2015, and most of the exposure is near oceans or rivers (Qiang, 2018). The study also showed, at the national scale, poor population are more likely to reside in flood zones than outside. At the local level, poor people tend to live in flood zones in inland areas, while coastal flood zones are more occupied by wealthier and older people (Qiang, 2018). Hence, vulnerability increases for the people living in the flood zone of the USA.
2 Methodology
The goal of this research is to evaluate of the relationship between floodplain population dynamics in the US and the historical occurrence of flood events, related damages, protection measures, i.e. levee construction and flood insurance and poverty status in the floodplains. For this purpose, the floodplain population dynamics evaluated using spatial analysis methods to unravel the human-flood dynamics. Available data of flood events, damages and flood protection measures since 1790 collected from the freely accessible database, research papers and official documents to conduct this study.
The analysis conducted at three levels: 1) the US level.
2) State-level – Arkansas.
3) County-level - Sebastian County, Arkansas. Data Collection
Data analysis is the most important part to show the relationship between historical datasets of the flood events with historical population dynamics. Therefore, data collection is a significant part of this thesis. Data sets collected from the freely accessible sources from U.S. Geological Survey (USGS), National Oceanic and Atmospheric Administration (NOAA), Census.gov, Spatial Hazard Events and Losses Database for the United States (SHELDUS) and different research articles and official documents. The required datasets, their types and sources described in Table 1.
Table 1: Datasets used for spatial and temporal analysis of floodplain population dynamics, historical flood events and intervention measures
Sl
No. Data Description Data Type Source/Reference Link 1
Population data for the whole USA from 1790 - 2010 Raster (1km ×1km grid data)
Fang, Y. and Jawitz, J. W. (2018) ‘Data Descriptor: High-resolution reconstruction of the United States human population
distribution, 1790 to 2010’, Scientific Data, 5, pp. 1–15. doi: 10.1038/sdata.2018.67.) https://doi.or g/10.6084/m 9.figshare.58 03110.v1 2 Floodplain boundary of US Raster (Geo Tiff format)
Nardi, F. et al. GFPLAIN250m, a global high-resolution dataset of Earth’s
Floodplains. Sci. Data. 6:180309 doi: 10.1038/sdata.2018.309 (2019). https://doi.or g/10.6084/m 9.figshare.66 65165.v1 3 Administrativ e boundary (Country, state, county) Shapefil e
Environmental Systems Research Institute (ESRI) – Country, State
Arkansas GIS office, The Department of Transformation and Shared Services, Little Rock, Arkansas – County boundary
https://www. arcgis.com/h ome/item.ht ml?id=54000 3aa59b047d7 a1f465f7b1df1 950https://gi s.arkansas.go v/ 4 North America Rivers and Lakes Shapefil e
Science base catalogue, U.S. Geological Survey
(USGS) https://www.sciencebase.g ov/catalog/it em/get/4fb55 df0e4b04cb9 37751e02?file s.metadataFir st=true#attac hed-files-section 5 Flood events (1833 – 2010) Excel, Researc h Article, Book
Federal Emergency Management Agency (FEMA)1: Data from 1953 – 2010
Arkansas Historical Association. Park, H. (1943). The Arkansas River Floods of
1943. The Arkansas Historical Quarterly, 2(3), 202-213. doi:10.2307/40030594. Data from: 1833 – 1950
BARRY, J. M. (1997). Rising tide: the great Mississippi flood of 1927 and how it changed America. New York, Simon & Schuster.
fema.gov https://www. jstor.org/stab le/40030594 ?seq=1#meta data_info_ta b_contents 6 Structural intervention (Levee construction, related policy formulation) (1849 – 2010) Course presenta tion, CSV file,
Levee construction policies and regulations related presentation by David Rogers for Course: Evolution and Development of Flood Control Engineering (GE 4001),Department of Geosciences and Geological and Petroleum Engineering, Missouri University of Science & Technology: – 1849 – 2010
fema.gov. 2020. History Of Levees. [online] National levee database of USACE: 1938 – 2010 https://web. mst.edu/~rog ersda/levees/ https://www. fema.gov/me dia-library-data/1463585 486484-d22943de488 3b61a6ede15a a57a78a7f/Hi story_of_Lev ees_0512_50 8.pdf
Sl
No. Data Description Data Type Source/Reference Link
<https://leve es.sec.usace.a rmy.mil> 7 Non-structural intervention introduction (Flood insurance provision) Official docume nt
Federal Emergency Management Agency (FEMA)
A Chronology of Major Events Affecting the National Flood Insurance Program
https://www. fema.gov/me dia-library-data/201307 26-1602- 20490-7283/nfip_ev al_chronolog y.pdf 8 Flood insurance claim (1978 – 2010) Databas e file
FIMA NFIP Redacted Claims Data Set https://www. fema.gov/me dia-library/assets /documents/ 180374 9 Community Participation record in NFP Text
Federal Emergency Management Agency
Community Status Book Report, Arkansas https://www.fema.gov/cis/ AR.html
10 Flood damage data (1955 – 2000)
PDF, CSV file
State-level flood damage data: Pielke, Jr., R.A., M.W. Downton, and J.Z. Barnard Miller, 2002: Flood Damage in the United States, 1926-2000: A Reanalysis of National Weather Service Estimates. Boulder, CO: UCAR.
County-level flood damage data: Hazards and Vulnerability Research Institute. (2012). The spatial hazard events and losses database for the United States, version 9.0. Columbia: University of South Carolina.
https://scien cepolicy.color ado.edu/floo ddamagedata /full_report.h tml http://www.s heldus.org. 11 Poverty percentage Excel U.S. Census bureau Census.gov
1"FEMA and the Federal Government cannot vouch for the data or analyses derived from these data after the data retrieved from the Agency's website(s) or Data.gov.
Country-level: the USA, Floodplain Population Dynamics Estimation
In this thesis, floodplain population dynamics for the whole USA evaluated in terms of population growth rate and the ratio of floodplain population to the total population. The population growth rate in each decade from 1790 to 2010 computed using equation (1) for the total population and the floodplain population in the contiguous USA. To visualize the Spatio-temporal change of population growth rate in each decade, the central tendency of the growth rates computed. Central tendency describes the typical value of growth rates in each decade. The population growth rate can vary from place to place, and there are possibilities of the presence of extreme outliers in the data. Thus, the median centre calculated to reduce the effects
of outliers and skewed data on the central tendency. The location of the median centroid is the point where Euclidean distance is minimum for all features in the datasets. Thus, the median centroid point for population growth rate indicates the location where most of the population growth occurs in that decade. Therefore, the change in the position of median centroid over time shows where more people tend to move-in than the other areas and how it changed with time. The ratio of the floodplain population to the total population of any decade indicates the proportion of the floodplain population in a particular area. Increase or decrease in the ratio shows an increase or decrease of the floodplain population in the area. The change rate of the total population also observed along with the floodplain population to the total population ratio to get the idea of how the floodplain population change with time.
For the calculation, gridded data of the total population in the USA from 1790 – 2010 used. The data reconstructed with a resolution of 1 km x 1 km (Y. Fang et al. 2018). Floodplain population extracted from the entire population using floodplains boundaries data. A global high-resolution raster data of earth’s floodplain with 250 m resolution also used in this study (Nardi, F. et al., 2018) to identify floodplain boundary. Both the population and floodplain data processed in ArcGIS. Floodplain
raster was converted to the vector format to get the floodplain boundary shapefile. This floodplain boundary later used to extract floodplain populations from population raster using ‘extract raster using mask’ option. The extracted floodplain population raster and total population raster data used to calculate the total population growth rate and floodplain population growth rate from 1790 – 2010 using growth rate computation formula presented in equation (1). “Raster Calculator” from spatial analyst tool used for the purpose. The growth-rate raster files then used to calculate the median centroid of the population growth rate for each decade to observe the central tendency of population growth in each decade. The median centroids calculated for +/- 100% growth rate, i.e. over or below 100% population growth rate not considered for computing median centre. The limitation set to avoid errors that can occur from unusually high or low values generated during calculation from decimal cell values of float point raster.
The ratio of the floodplain population to the total population calculated in two steps - at first “Zonal statistics” tool was used to calculate the sum of floodplain population and the total population for each state. Then those population sum values were added to the attribute tables of the state boundary shapefile. “Field calculator” was used in the attribute table to calculate the ratio. The ratio of floodplain population to the total population represented in the maps for each decade. Change is ratio was classified in 5 separate classes 0 – 0.2, 0.2 – 0.4, 0.4 – 0.6, 0.6 – 0.8 and 0.8 – 1.0. The trend line for the floodplain population to the total population ratio along with the total population of each decade plotted to observe the temporal change in floodplain population to the total population for each state.
State-level: Arkansas, the temporal relationship of floodplain population dynamics with flood events, damage, interventions
Population dynamics in the floodplain of Arkansas state evaluated using the temporal change in total state population, floodplain population, the growth rate of floodplain population and floodplain to total population ratio. Total population and floodplain population growth rate for Arkansas calculated using equation (1). The population ratio calculated using the same method used for the whole United States. The maps showing the change in the floodplain to the total population ratio also created following similar classification as used for the entire country. Floodplain to the total population ratio trendlines plotted for the counties in Arkansas to observe the variation of the ratio in each decade in the counties.
The plot of historical records of flood events, related damage flood protection measures, with floodplain population dynamics, shows changes in temporal relationships between them. Flood event records before the 1950s collected from different pieces of literature and from 1950 to onward flood event records obtained from FEMA disaster database (Table 1). All the received files have complied in an excel sheet. Damage data collected from a report published based on the National weather service’s recorded data since 1955 – 2010 (Table 1). Levees considered as a representation of structural flood protection measures for this study purpose. Levees usually constructed after any related act approved or policy formulated. Therefore, such data collected from official documents or literature (Table 1). National Levee
Database is managed and maintained by US Army corps of engineers, is the only integrated source levee data where detail record about levee found. Construction year of levees found in national levee database. However, this data is available from the 1950s. Prior to that decade, levee records collected from the literature. Flood insurance incorporated as a non-structural flood protection measure in this study and data about flood insurance found in FEMA (Table 1). Events related to flood insurance, insurance claim record from 1977 – 2010, the time when communities joined flood insurance program were collected. Poverty data is available since 1960 as state or county-wise summary. Before 1990, there was no record beyond county level. Therefore, poverty in floodplain data is available for three decades (1990 – 2010).
For flood events, structural and non-structural flood protection measures, records were aggregated as a dichotomous variable (“0” and “1”) for each year and the damage data used as the monetary value in USD. The damage value per year is the summation of the total damage value in case of multiple flood events occurred in any year. Poverty percentage data used here provided as a decimal value. Graphs plotted with the total population, floodplain population, floodplain population growth rate, floodplain to the total population ratio against the damage value in USD, flood events, structural & non-structural protection measures to observe the relationship and how the population dynamics change after each event. Graphs also plotted with floodplain poverty percentage against floodplain population dynamics to observe any steady relationship between them.
County-level: Sebastian, the temporal relationship of floodplain population dynamics with flood events, damage, interventions
Change in the temporal relationship of floodplain population dynamics with the flood events, damage and protection measures observed for Sebastian County using the same procedure that followed for analysing the relationship at the state level.
Comparison of floodplain population dynamics from the country (USA) to state (Arkansas) to the county (Sebastian) level
The ratio of floodplain population to the total population and growth rate of floodplain population for the whole USA, Arkansas State and Sebastian County plotted for the year 1790 – 2010. Variance and standard deviation calculated for floodplain population to the total population ratio from 1790 – 2010 in the USA, Arkansas state and Sebastian county to compare the changes in the ratio and growth rate values. The changes from the country-level (USA) to the state (Arkansas) to the county level (Sebastian) discussed using associated information available from the literature.
3 Results
Country-level: the USA, Total and Floodplain Population Dynamics Temporal change in the total and floodplain population growth rate:
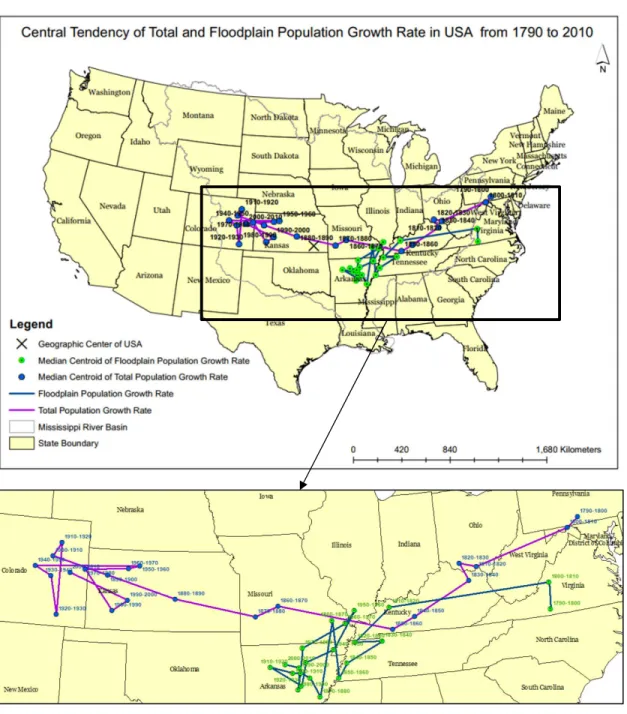
Figure 2: The picture shows the total population and floodplain population dynamics in the USA in terms of growth rate and temporal change in the central tendency of the growth rate in terms of the median centroid. In the inset, the zoomed-in figure shows the difference in the location of the median centroid of the total population growth rate and floodplain population growth rate from 1790 – 2010.
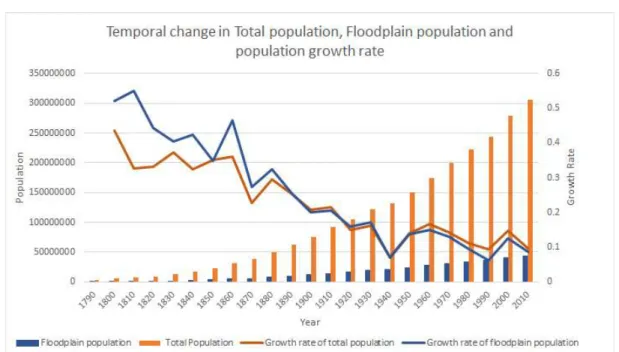
Figure 3: Temporal change in total population, floodplain population and growth rate
The growth rate of the total population and floodplain population for the contiguous USA calculated from 1790 to 2010. The central tendency of the growth rates for each decade evaluated using median centroid (Fig. 2). The location of the central tendency indicates that in the early 1800s, the significant portion of the total population settles and grows in the north-east side of the country. The total population growth rate was higher in that part. Later the central tendency of the total population growth rate shift towards the south-west direction and the median centroid locations were consistent in the Colorado and Kansas State, west side of the geographic centre of the USA at Kansas from 1900 to 2010 (Fig. 2). The result of central tendency and the location of median centroid indicates that from 1900 to 2010 the total population growth rate is almost similar all over the country with slightly higher population growth in the west side of the country (Fig. 2).
For floodplain population, the temporal change in the central tendency of growth rate is also like the total population growth rate, which shifts from east to west direction (Fig. 2). However, the central tendency of the floodplain population growth is a little southward position than that of the total population in the early 1800s. Then in the next decades, the central tendency of the floodplain population growth rate shifts towards the south-west direction and remain consistent at or around
Arkansas state from the 1900s to 2010 (Fig. 2). This shift in central tendency over time implies that most of the floodplain population grows at or around the Arkansas state in other words in the lower Mississippi river basin in the last 110 years.
Both total and floodplain population growth rate stabilized from 1930 and onwards (Fig. 3). At the beginning of settlements, i.e. in 1790 the difference in the total population and the floodplain population was negligible which increases with time, and the floodplain population grows at a slower rate than that of the total population. From 1800 to 1850, the growth rate of the total and floodplain population shows an inverse relationship like pattern (Fig. 3). From 1810 – 1850, when the total population growth rate increased, the floodplain population growth rate decreased and vice versa. From 1860 to 1900, both growth rate follows a reciprocal relationship while after 1900 to 1950, both total and floodplain population growth rate remains similar. From 1960 to 2010 both growth rate (total and floodplain) values remain similar with slight variation (Fig. 3)
The ratio of floodplain population to the total population:
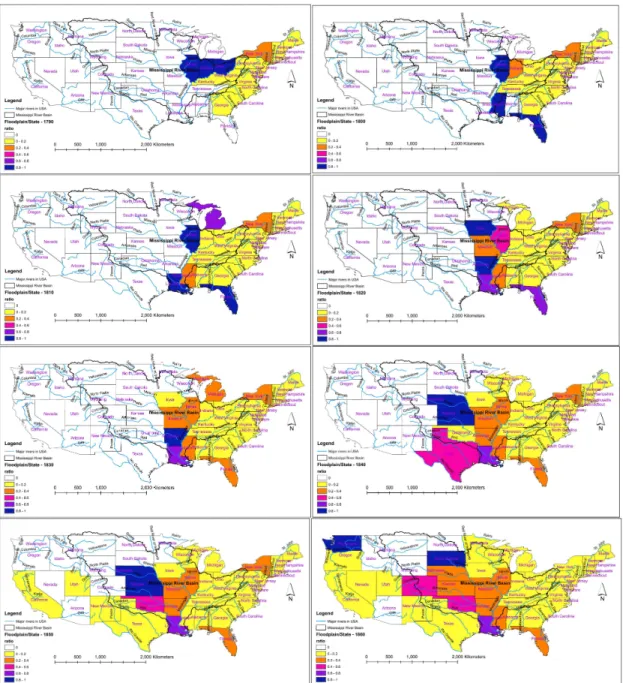
The floodplain population to the total population ratio shows the comparison of the population living inside and outside the floodplain. High value can indicate that in a specific area, more people reside inside the floodplain than the outside of a floodplain area. The overall trend of floodplain population ratio is to have high value when the population starts to settle in an area which tends to reduce in later decades (Fig. 4, 5 and 6). When people began to settle in the country in 1790, more than 80% population of Ohio, Indiana and Illinois were living in the floodplain. The floodplain population proportion dropped below 40% for Ohio and Indiana states later in 1800 and for Indiana states in 1830. The ratio remains below 40% for these states in the rest of the decades till 2010. In Arkansas, Florida, Iowa, Kansas, Louisiana, Mississippi, Nebraska, Ohio, South Dakota, and Washington follows a similar trend in floodplain population ratio. There the floodplain population ratio was more than 80% at first that later dropped below 40% in further decades for all states except Louisiana where average floodplain population ratio remains 66% approximately (Fig. 4, 5, 6). Except for these states, other states also showed a similar pattern of having high floodplain population ratio at first and decreasing trend later on. The
only exception found in North Dakota, where floodplain population ratio shows an increasing trend of 0.31 to 0.49 from 1890 to 2010. Trendline of the floodplain to the total population ratio for each state added in Appendix III. The temporal change in maximum, minimum and variance of the ratios for each state provided in Appendix VI.
Figure 4: The figure shows the ratio of floodplain population to the state population for the whole USA (1790 - 1860) starting from 1790 on the top left to right direction consecutively. The ratios classified in 6 classes and shows in 6 different colours – 1. No data (White); 2. 0 – 0.2 (Yellow); 3. 0.2 – 0.4 (Orange); 4. 0.4 – 0.6 (Pink); 5. 0.6 – 0.8 (Purple); 6. 0.8 – 1.0 (Blue). (Continued to next page)
Figure 5:The figure shows the ratio of floodplain population to the state population for the whole USA (1870 - 1960) top left to right direction consecutively. (Continued to next page)
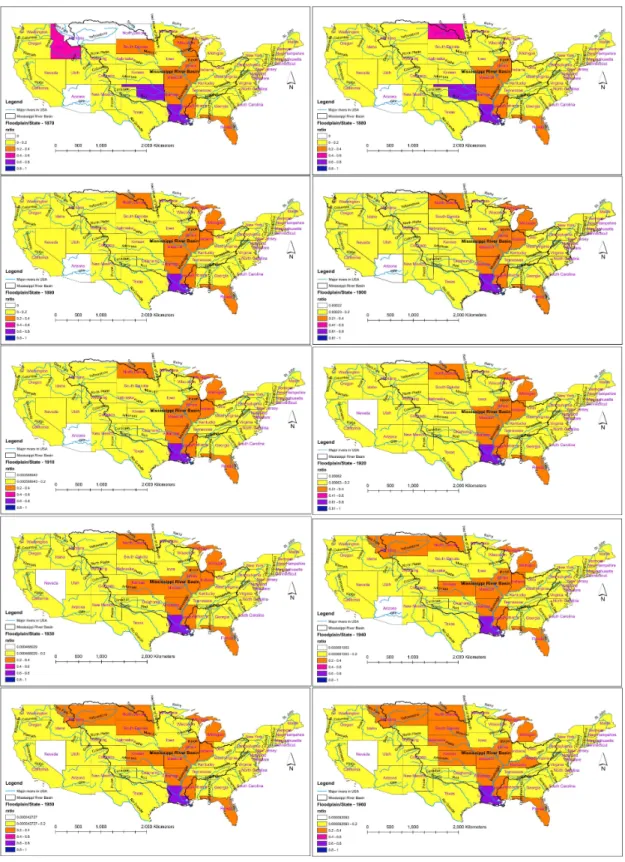
Figure 6: The figure shows ratio of floodplain population to the state population for the whole USA (1970 - 2010) starting from 1790 on the top left to right direction consecutively. The ratios are classified in 6 classes and shows in 6 different colors – 1. No data (White); 2. 0 – 0.2 (Yellow); 3. 0.2 – 0.4 (Orange); 4. 0.4 – 0.6 (Pink); 5. 0.6 – 0.8 (Purple); 6. 0.8 – 1.0 (Blue).
With small variation in few states (North Dakota, South Dakota, Louisiana, and Arizona) the floodplain population ratio remains consistent for the whole United States from 1890 to 2010. The result indicates that the proportion of floodplain population was high in the early years of settlements which reduced and stabilized in later decades. The result also showed that the variance of floodplain population ratio is higher in the states lies in the Mississippi basin than that of the states outside the Mississippi river basin (Fig. 5, 6 and 7 and Appendix VI). Floodplain population ratio plotted for each state to visualize variability in the last 220 years and added in Appendix III. For twenty states, the floodplain to the total population ratio was very high at first, then there is a sharp drop and later remain consistent (Appendix III). Temporal change in population growth rate (total and floodplain) indicates that floodplain population was not constant throughout the entire time (Fig. 3). Rather
the growth rate varies significantly in the 1800s and the early 1900s in the floodplain. After the 1950s, the total and floodplain population growth rate becomes approximately similar (Fig. 3). However, the proportion of floodplain population starts to stabilize from 1890. This difference indicates that the population tends to settle in the floodplain and changed throughout time. The result suggests that more people moved-in outside the floodplain than inside the floodplain. The result also confirms from the plot of temporal change in total population, floodplain population and proportion of the floodplain population for the whole country from 1790 to 2010 (Fig. 7). The plot shows the proportion of total floodplain population in the USA was higher from 1870 to 1970 which is different from the result derived from the state-wise change in the floodplain population ratio (Fig. 4, 5, 6, 7). Therefore, the population dynamics vary significantly with geographic scale, and the results might not be able to reflect the exact dynamics through statistical analysis only fully.
Figure 7: Temporal change in population and floodplain to the total population ratio in the contiguous USA from 1790 to 2010.
State-level: Arkansas, temporal relationship with flood events, damage, interventions
Description of Arkansas State, flood events, related damages, and interventions: Arkansas is a state in the West South-central sub-region of the United States (USGS, 2019). The total land area of the state is 134771.274516 sq. Km (Census.gov, 2020). Total floodplain area of this state is 42,550 sq. Km, which is about 32% of the total state area. Settlement starts in Arkansas from 1820 with 100% of the population settled in the floodplain. The floodplain population ratio dropped to 0.25 in 1840, which gradually increased to 0.39 in 1950 and then continued to decline till 2010 to 0.28. Other than the Mississippi river, there are Arkansas, Red, White, Black, Ouachita and Saint Francis river (Fig. 8) in Arkansas which makes it exposed to frequent flooding from time to time. Arkansas located at the west side of the lower Mississippi basin and have rich fertile soil which makes it an attractive location for agricultural production. The eastern and central Arkansas has a notable concentration of crop production (Arkansas Crops & Commercial Horticulture, Production & Verification, 2020). Thus, historically this place was famous for agricultural activities, especially for cotton production, which shapes the history of population in this area (Ambrose, 2001). Although the area is significantly flood-prone, due to its suitability for agricultural production, Arkansas was always an attractive place for settlement in the 1800s and early 1900s. People took different structural flood protection measures since 1840 to protect their valuable agricultural lands. Despite various flood protection measures, the economy of Arkansas always suffered, which is visible from its poverty percentage. The percentage of poverty in Arkansas was still higher than that of the whole country since 1960 (Census.gov). Thus the relationship of flood events, damage and different protection measures with the floodplain population dynamics in Arkansas state is evaluated in this study.
Figure 8: This figure shows the state with county boundaries, floodplain area, river and levee locations in Arkansas state.
Flood events in Arkansas:
Due to geographic location, Arkansas frequently flooded throughout its history. Flood event record collected from two sources. From literature for the floods occurred before 1950 and from the Federal Emergency Management Agency (FEMA) database after 1950, as FEMA started to record flood events since 1950. Research