Ageing and Savings
MASTER THESIS WITHIN: Economics NUMBER OF CREDITS: 30 points
PROGRAMME OF STUDY: Economic analysis AUTHOR: Huizheng Chi
JÖNKÖPING May 2020
Master Thesis in Economics
Title: Ageing and Savings - Evidence from OECD countries and BRICS countries Authors: Huizheng Chi
Tutor: Almas Heshmati Date: 2020-05-18
Key terms: Ageing, Savings rate, Population structure, Children and elderly dependency ratio, OECD, BRICS.
Abstract
Increasing longevity and falling fertility have increased interest in financing retirement age and have increased the burden of old age in an ageing society. This research is based on data from 41 countries of OECD and BRICS, between 1995 and 2017. By employing the fixed-effect estimation method, this study is to test and compare the relationship between the child and old-age dependency ratios, life expectancy and savings rate of these countries. The two groups of countries represent developed (OECD) and emerging (BRICS) countries with different level of development and states of ageing. The estimation results show that the savings rate of OECD countries can be explained by the old-age and child dependency ratios and life expectancy, but life expectancy has a greater impact on the savings rate. However, although the savings rate in BRICS countries is also positively affected by life expectancy, the impact of child dependency ratio is much greater than life expectancy. But, the effect of old-age dependency ratios on savings is insignificant in BRICS countries.
Table of Contents
1.
Introduction ... 1
2.
Background ... 3
3.
Literature Review ... 4
3.1
Dependency ratio and Savings rate relationship ... 5
3.2 Life expectancy and Savings rate relationship ... 8
3.3 Hypotheses ... 10
4.
Methodology and Data ... 11
5.
Analysis of the Result ... 17
5.1 Empirical result ... 17
5.2 Discussion of the results ... 21
6.
Conclusion ... 24
References ... 27
List of Figures
Figure 1.The child and old-age dependency ratio in BRICS and OECD in 1995-2017. ... 4
List of Tables
Table 1. Descriptive statistics of the data, NT=41x23=943 observations. ... 12Table 2. Results of fixed effects. ... 19
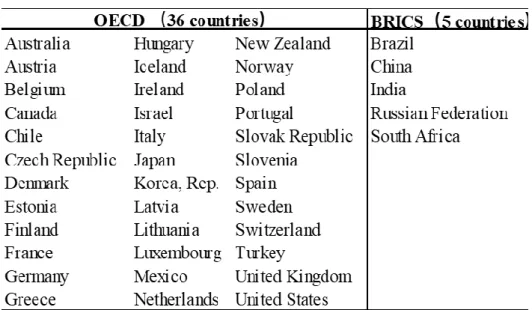
Appendix
Table A 1. List of countries ... 31Table A 2. Correlation matrix ... 31
Table A 3. Descriptive statistics (OECD countries), NT=36x23=828 observations. ... 32
Table A 4. Descriptive statistics (BRICS countries), NT=5x23=115 observations. ... 32
List of abbreviations
BRICS Brazil, Russian Federation, India, China, South Africa ILO International Labour Organization
IMF International Monetary Fund
OECD Organisation for Economic Co-operation and Development UNDP United Nations Development Programme
1. Introduction
The savings rate is one of the most studied issues in macroeconomics and it has important implications for understanding many economic phenomena. The neoclassical theory of economic growth argues that national savings are the key determinant of long-term economic growth (Solow, 1956). Subsequently, the endogenous growth theory proposed by Romer (1986) and Lucas (1988) also supports that higher savings rates lead to higher economic growth rates. The main source of capital accumulation is savings, and a country that regularly has a high and balanced savings rate can provide a corresponding incentive for economic growth. According to the life cycle theory, the ageing of the population reaches a certain stage, which affects the savings rate and the size of savings in the society as a whole (Modigliani and Brumberg, 1954). Savings is an important source of investment and capital accumulation, and a decrease in savings means a corresponding decrease in the source of investment funds, thus weakening the incentive for economic development. Thus, the relationship between population ageing and savings is an important aspect of the relationship between population ageing and economic development. This paper aims to examine the relationship between population ageing and savings.
Population ageing affects a country’s savings (Modigliani and Brumberg, 1954). According to the life cycle theory, the saving behaviour of individuals at different ages is different. When they are young, individuals need to save to meet the consumption needs of old age. Therefore, the distribution of the age structure of the population in society, that is, the proportions of child and old-age populations can affect the total savings of the society. However, some scholars find that age-based life-cycle theories fail to explain saving behaviour and that increasing life expectancy is an important factor in explaining high savings rates in East Asia (Lee, Mason & Miller, 2000; Tsai, Chu & Chung, 2000; Li, Zhang & Zhang, 2007). The increase in life expectancy implies an extension of the period of old age that individuals are in. This requires workers to save more when they are young to live longer in later life. However, increased life expectancy exacerbates the problem of an ageing population, leading to an increase in the number of people who do not save relative to saving, thereby reducing the overall saving rate (Li et al., 2007).
There is no unified conclusion on the impact of changes in age structure on the savings rate or the impact of changes in life expectancy on the savings rate, and there are few articles that combine the two to analyse the impact on the savings rate (e.g., Li et al., 2007; Pascual-Saez, Cantarero-Prieto & Manso, 2020). In contrast to previous articles, the focus of the independent variables in this paper is on the child and old-age dependency ratios and life expectancy. Furthermore, there are no articles considering the correlation between savings rates and ageing in the BRICS group. The first research object in this paper is to examine the relationship between population ageing and savings rate from perspectives of life expectancy and dependency ratio in BRICS countries and OECD countries. There are some reasons why it is interesting to examine and compare the BRICS group. Since the 2008 financial crisis, global economic growth has slowed sharply. Although most economies are affected by the global financial crisis, some emerging countries are less affected than some developed countries (World Bank, 2018). Therefore, these emerging countries have recovered faster from the financial crisis, especially the influence of Brazil, Russia, India, China, South Africa (BRICS) (World Bank, 2018). One of the important driving forces of rapid economic growth is the demographic dividend generated by the demographic transition (Lee and Mason, 2006). The demographic dividend is defined as: the workforce outpaces the dependent age population (children and elderly), which is beneficial to economic growth (Mason and Lee, 2006; Lee and Mason, 2006). However, the demographic dividend disappears as the population gradually ages (Mason and Lee, 2006). When the total of children and the elderly exceeds the workforce, the demographic dividend disappears gradually, thereby reducing the potential for long-term economic growth.
The second object here is to compare the impact of BRICS and OECD ageing on savings. Compared with OECD countries, BRICS countries face the problem of ageing later. Thus, the impact of population ageing may not be fully reflected in BRICS. Examining the general relationship between population factors and savings in OECD countries can help to understand the mechanism of the change in population structure and its effects on savings. Understanding the regularity it presents in OECD countries, can be used to make inference about the developing ageing and its effects in BRICS countries.
To investigate the two research purposes, this paper specifies a panel data model to provide empirical support for the relationship between child and old-age dependency ratios and life expectancy and savings rate across the two country groups. This shed lights on the ageing-saving relationship accounting for the level of development and demographic and economic characteristics of the sample countries. The estimation results show that the savings rate of OECD countries can be explained by the old-age and child dependency ratios and life expectancy, but life expectancy has a larger impact on the savings rate. In BRICS countries, although the savings rate is also positively affected by life expectancy, the impact of child dependency ratio is much greater than life expectancy. At the same time, the effect of old-age dependency ratios on savings is insignificant in BRICS countries.
The remainder of the study is structured as follows. The second part is the background introduction. The third part is about the literature review. Section 4 gives data and model specifications. Section 5 presents and discusses the empirical results. Section 6 summarizes the results and gives some policy implications.
2. Background
Both developed and developing countries have experienced an ageing crisis to varying degrees. The most commonly used indicators are the child dependency ratio and the old-age dependency ratio, which measure the degree of old-ageing in a country. The child dependency ratio refers to the proportion of the population aged 0-14 in the working-age population of 15-64, and the elderly dependency ratio refers to the proportion of the population aged over 65 in the working-age population of 15-64 (World Development Indicators, 2020a; 2020b).
As shown in Figure 1, the average old-age dependency ratio of OECD countries is significantly higher than that of the BRICS countries, while the average child dependency ratio is very low.Many OECD countries have experienced an ageing population earlier. Due to the declining fertility rate and the continuous increase in the average life expectancy of the population, the proportion of the elderly population has continued to rise (OECD, 2019a).
Although the degree of ageing in the BRICS countries is less than that in the OECD countries, the BRICS countries generally have a trend of rising elderly dependency ratios and declining child dependency ratios. Specifically, India, South Africa and Brazil have the highest child dependency ratios and the lowest old-age dependency ratios. Russia’s old dependency ratio is the highest, but its child dependency ratio is the lowest. At the same time, the child dependency ratio in China is relatively low, but the old-age dependency ratio is relatively high.
Although the degree of ageing in OECD countries is higher than that in BRICS countries, the degree of ageing in BRICS countries is gradually increasing. Development of the child and old-age dependency ratio in BRICS and OECD is shown in Figure 1. The two groups of countries differ by the level and temporal patterns of development of the two dependency ratio indicators.
Figure 1.The child and old-age dependency ratio in BRICS and OECD in 1995-2017. Source: World Bank’s World Development Indicators database.
3. Literature Review
The impact of population ageing on the savings rate of residents has been studied by scholars to varying degrees, but there is no uniform conclusion. Most countries face the
2 0 3 0 4 0 5 0 6 0 C h ild d e p e n d e n c y ra te 1995 2000 2005 2010 2015 YEAR
South Africa Russian
India China
Brazil OECD (mean)
5 1 0 1 5 2 0 2 5 3 0 O ld d e p e n d e n c y ra te 1995 2000 2005 2010 2015 YEAR
South Africa Russian
India China
problem of ageing, so it is necessary to study this issue more in-depth. Generally speaking, the effect of ageing on the savings rate is mainly divided into two aspects. One is the impact of changes in the dependency ratio on the savings rate, and the other is the impact of the increase in life expectancy on the savings rate. The following literature review is mainly described in terms of these two impacts associated with dependency and life expectancy.
3.1 Dependency ratio and Savings rate relationship
The life cycle hypothesis is proposed by Modigliani and Brumberg (1954). The life cycle hypothesis focuses on studying the impact of a family’s entire income on the individual’s consumption expenditure and saving rate at various stages in its life. This theory, combined with Friedman’s (1957) permanent income hypothesis, constitutes the basis of the modern consumption function theory, namely the life cycle-permanent income hypothesis.
The life cycle hypothesis assumes that consumers are rational and will pursue utility maximization as an objective. On the premise of following the principle of maximizing utility, Modigliani and Brumberg (1954) proceed from personal consumption behaviour. They believe that rational consumers will reasonably distribute their lifetime income and arrange the ratio of savings to consumption such to maximize utility from consumption while working and later retirement. At the end of their lives, the income will be completely consumed to maximize utility. Consumers are faced with risks such as future income losses, longevity beyond expected, and imperfect credit markets influencing returns on saving. Consumers must first save before they can consume evenly across their lifetimes.
To obtain maximum utility over a lifetime, consumers should allocate their consumption and savings over a lifetime. The life cycle hypothesis divides a person's life into three periods, namely, youth, middle age and old age. When people are young, their incomes are also lower, so they have to take on debt to consume and are negative savings. In the middle age, people are around 40 to 60 years of age. Their income peaks so they can repay the debts that they borrowed for their original consumption and save for their future retirement when their income decreases. In the old age, people’s income decreases and
they start consuming their savings from their middle age. According to this theory, the propensity to consume increases if the proportion of young and old people in the society increases and decreases if the proportion of middle-aged people in the society increases (Modigliani and Brumberg, 1954).
According to Modigliani’s simplified model, the savings rate should have the following relationship with the old-age dependency ratio and the child dependency ratio (Modigliani, 1970):
𝑆 = (𝐷 + 𝑅)/𝐿 + (𝑊/𝐿) ∗ 𝑑𝑒𝑝𝑦𝑜𝑢𝑛𝑔 − (𝑊/𝐿) ∗ 𝑑𝑒𝑝𝑜𝑙𝑑
Where S is the savings rate, W is the working years, individuals start working at age D, retire for R number of years, L is the years of survival, 𝑑𝑒𝑝𝑦𝑜𝑢𝑛𝑔 is the young dependency ratio, 𝑑𝑒𝑝𝑜𝑙𝑑 is old-age dependency ratio. According to the life cycle
hypothesis, the working-age population will allocate their income to the current consumption, child-rearing and pension reserves, and this age group will make positive savings, while children and the elderly will make negative savings. The perpetrator’s savings show a ‘hump-shaped’ during their lifetime, that is, they save less in childhood and old age. The most savings are in the middle age. From the perspective of the whole society, the meaning of the life cycle hypothesis is that the savings rate has nothing to do with per capita income, but depends on the long-term income growth rate and population structure. When a country’s child dependency ratio and old-age dependency ratio are relatively high, the savings rate will be lower. Savings is directly related to the age structure of the entire society (Modigliani and Brumberg, 1954).
In terms of empirical research, Leff (1969) first uses the relationship between population structure and savings effect based on cross-sectional data for empirical research. The data contains 74 countries, which is divided into two sub-samples of 27 developed and 47 underdeveloped countries. The empirical results of all countries verify the life cycle hypothesis. Since then, some empirical studies find a statistically significant negative correlation between them (e.g., Davis, 2007; Loayza, Schmidt-Hebbel & Servén, 2000). Loayza et al. (2000) use aggregated least squares panel data and the generalized method of moments (GMM) to study 150 countries. They find that the increase of the child dependency ratio and the old-age dependency ratio reduce private savings, but the
negative impact of the elderly dependency ratio on the private savings rate is more than twice the child dependence ratio on the private savings rate.
Several studies have challenged the results of Leff's (1969) analysis (Adams, 1971; Ram, 1982; Kelley and Schmidt, 1996). These criticisms arise primarily from the data processing, variable settings, sample composition, and estimation methods of the savings test equations for the population burden effect. For example, based on Leff’s simple analytical framework, Kelley and Schmidt (1996) analyse three sets of cross-sectional data of 89 countries in the 1960s, 1970s, and 1980s. They find that only the data from the 1980s are consistent with the expected results of the life cycle model, and the data from other periods do not show a significant burden effect.
However, some cross-panel researches confirm that the life-cycle theory is supported in Asia or less developed countries, but not in developed countries. Bosworth and Keys (2004) analyse the age structure and saving rate of 88 countries and find that the age structure has an important effect on the saving rate. The conclusion of the study is nationally different. For OECD high-income countries, the impact of demographic variables on the savings rate is not important. For East Asian and Latin American countries, demographic variables have a significant impact on savings. Subsequently, Bosworth and Chodorow-Reich (2007) conduct a panel data analysis method to study 85 countries. They find that an increase in the old-age dependency ratio in Asian countries leads to a reduction in the national savings rate, but industrialized countries are not significant. Cavallo, Sánchez and Valenzuela (2018) use OLS to analyse the impact of ageing on savings from the annual data of 1963-2012 for 100 countries. They find that although the old-age dependency ratio is significantly negative for the world’s savings, this negative influence comes from Asia.
In addition to cross-sectional analysis, many time-series studies in Asia and less developed countries support the life cycle theory. For example, Apergis and Christou (2012) use cointegration and causality analysis to analyse the long-term and short-term relationships between dependency ratios, domestic savings rates and GDP per capita in African countries. The results of the study show that the dependency ratio has a statistical significance and negative impact on the savings rate of African countries. But, using the fixed-effects method and GMM, Brookins, Ahmad, Ahmad and Saeed (2015) assess the
impact of the population structure of Pakistan, India and Bangladesh on household savings rates. The results show that although the child dependency ratio is significant and has a negative impact on the household savings rate, the old-age dependency ratio does not significantly affect household savings. However, Boateng, Agbola and Mahmood (2019) use a two-step instrumental variable generalized moment method (2SIV-GMM) to analyse 44 sub-Saharan African countries and find that the coefficient of the old-age dependency ratio is significantly negative, while the child dependency ratio is positive and significant.
However, some scholars have come to a different conclusion: Kraay (2000) uses the 1978-1989 urbanization of China as the basis for his study. The effect of the dependency ratio on the savings rate is statistically insignificant in the rural panel data. Horioka and Wan (2007) obtain a mixed result using provincial panel data for China from 1995 to 2004: the effect of population ageing on savings is not significant for the overall sample and the urban sample, but it is significant for the rural sample.
3.2 Life expectancy and Savings rate relationship
The standard life cycle theory largely ignores the basic fact that changes in the savings rate are caused by changes in the age structure of the population and factors that extend life. Compared with savers, the high population burden does increase the number of negative savers, which leads to a decline in total savings and total savings rate, but it ignores the ability of rational subjects to redistribute economic resources and coordinate life-cycle behaviour. This means that the assumption of exogenous savings trends implied by life cycle theory may be unreasonable. Consumers with rational expectations will actively adjust their savings and consumption behaviours at the working-age when they realize that they live longer. The motivation for preparation may lead to an increase in the savings rate.
Yaari (1965) earlier constructs a theoretical model to discuss the life-cycle decision-making of rational actors in the case of uncertain lifespan. In his model, to keep the consumption level in old age from falling, a longer-lived rational agent increases the working period. This kind of precautionary savings motive is regarded as the source of the second demographic dividend of capital accumulation and economic growth (Lee and
Mason, 2006). Zhang, Zhang and Lee (2003) introduce altruistic preferences in theoretical analysis, assuming that rational actors care about the well-being of future generations, and the dynasty utility function generation model constructed by the dynasty has also reached similar conclusions as above. However, some literature has put forward different views. For example, Bloom, Canning and Graham (2003) add a longevity factor to the age-based life-cycle savings model and believe that the extension of life expectancy increases the savings of people of all ages during the working period. The total savings rate rises accordingly. However, Bloom et al. (2003) also find that the increase in life expectancy leads to an increase in the number and proportion of the elderly population with negative savings, thereby offsetting the increased savings of all age groups during the working period. However, it is temporary. Post and Hanewald (2013) construct a theoretical model from the perspective of individual subjective survival expectations and find that although rational actors are aware of the longevity risk, they do not increase their savings. They explain that the uncertainty of life expectancy reduces the effective rate of return from savings. Slavov, Gorry, Gorry and Caliendo (2019) believe that the reason why rational actors do not increase savings under uncertain life expectancy is the lack of effective tools to hedge longevity risks. Bloom, Canning, Mansfield and Moore (2007) state that by establishing a life cycle model of optimal retirement and savings behaviour, in the absence of social security and capital market perfection, people’s optimal response to life extension is to extend the length of the working period rather than increase savings. When the economy has a relatively complete social security system, rational actors can use the social security system to deal with longevity risks. Bloom et al. (2007) also point out that the design of social security systems is often associated with mandatory retirement systems, and actors must retire at a fixed age. If the social security system is perfect, without mandatory retirement, the increase in life expectancy will increase the number of years people who are in retirement, and rational actors will save more before retirement.
Most empirical results support that the increase in life expectancy leads to an increase in the savings rate. Lee et al. (2000) use a dynamic simulation model to simulate Taiwan region of China. They state that life extension has strong explanatory power for the rise in the savings rate. The increase in the life expectancy of the population can promote the rapid rise in the savings rate in East Asia. Cocco and Gomes (2012) also believe that
increased life expectancy can increase private or national savings rates. Bloom et al. (2007) use cross-country panel data from 1960 to 2000 and find that under the influence of retirement motivation, the steady-state savings rate increased by 2 to 3 percentage points. Considering the change in the age structure of the population, the impact of increased life expectancy on the savings rate has become more complicated. Bloom et al. (2003) use multinational panel data from 1960 to 1997 to confirm the conclusions of his theoretical model. The positive savings effect brought by life extension is great, but this effect will eventually disappear as the population ages. Li et al. (2007) construct a generational overlapping model that considers both life expectancy and the old-age dependency ratio. The study finds that the old-age dependency ratio has a negative effect on the savings rate and life expectancy extension has a positive effect on the savings rate. The change depends on the relative strength of the two opposing effects. Subsequently, Pascual-Saez et al. (2020) use a fixed-effect model to study the effects of ageing on saving in 12 EU countries, and state that longevity has a significant positive effect on saving, while the old-age dependency ratio has a negative effect. Among them, the positive impact of life expectancy extension is greater than the negative impact of old-age dependency ratio. However, Loumrhari (2014) finds that a longer lifespan has a positive effect on the growth of savings, but this effect is less than the negative effect of the old-age dependency ratio on savings. Similarly, Bosworth and Chodorow-Reich (2007) state a small positive effect of life expectancy on the savings rate. Akin and Yavuzaslan (2019) prove that there is a negative correlation between life expectancy and savings, and it is statistically insignificant.
3.3 Hypotheses
Many existing studies have focused only on the effect of age structure changes on savings rates or the effect of changes in life expectancy on the savings rate. There are few articles combine the two. But, changes in age structure and changes in life expectancy are closely related. Based on this, this paper examines the combined effects of their increased life expectancy and changes in age structure on their savings rate. In terms of sample selection, existing studies have mostly used single countries or parts of regions (such as OECD countries and Asian countries) as samples, with a short sample period. In particular, the process of population ageing in BRICS member countries continues to deepen and shows
some new characteristics.However, there are no previous researches about the BRICS group. Thus, the use of the most recent data allows capturing the latest trends in ageing in BRICS countries, thus adequately reflecting the impact of demographic factors. Also, to get a more robust analysis, this paper adds some other related variables that affect the savings rate, such as fertility rate, labour force participation rate, real interest rate, inflation rate. Thus, the relationship between ageing and saving is studied conditional on several key control variables. That is, the following three hypotheses can be drawn: Hypothesis 1: There is a negative relationship between the old dependency ratio and the savings rate.
Hypothesis 2: There is a negative relationship between young dependency ratio and savings rate.
Hypothesis 3: An increased life expectancy is positively related to the savings rate.
4. Methodology and Data
3.1 Data and variable definitions
To analyse and compare the impact of ageing in BRICS and OECD countries on savings, the data used in this article includes 36 OECD member countries and 5 BRICS countries. The former is developed and the latter major emerging economies. The time period for data usage is limited to 23 years from 1995 to 2017. In addition, the average years of education data are obtained from the United Nations Development Programme (UNDP). Data for other variables in this study came from the World Bank’s World Development Indicators database, the International Financial Statistics database of the International Monetary Fund (IMF) and the sample countries’ National Bureau of Statistics. The list of countries presents in Appendix Table A1.
Table 1 shows the descriptive statistics of variables. According to theories and previous studies, the core explanatory variables include the old-age dependency ratio, the child dependency ratio and life expectancy. Considering the accuracy of the forecast, this paper includes some control variables which affect the savings rate. Control variables include economic growth rate, labour force participation rate, labour force participation rate, fertility rate, average years of schooling, real interest rate, unemployment rate, inflation rate. Table A2 in the Appendix provides a correlation matrix of the relevant variables. Although the child dependency ratio is highly correlated with fertility rate, this paper estimates regressions with and without fertility rate and finds that the results do not affect the significance of their core independent variables.
Note: Including 36 OCED countries and 5 BRICS countries from 1995-2017.
The variables of interest and their definitions are discussed in-depth as follows:
The savings rate is measured by the gross domestic savings rate, which is calculated as
GDP minus government and private sector consumption. It is expressed as a percentage of GDP. Some studies also use the gross domestic savings rates as a share of GDP (e.g., Apergis and Christou, 2012; Pascual-Saez et al., 2020).
The demographic structure is determined by the old-age dependency ratio and the child
dependency ratio. According to the hypothesis of life cycle theory, residents distribute the income they own among consumption, raising children and caring for the elderly Table 1. Descriptive statistics of the data, NT=41x23=943 observations.
reasonably. With age, personal savings usually show an inverted U shape, and people tend to have more savings in middle age and less in early childhood and old age (Modigliani and Brumberg, 1954).
Life expectancy refers to the life expectancy at birth (in years). People expect that their
life expectancy will be extended, so people have the willingness to increase their savings to prepare for their future pension needs, thereby increasing savings to a certain extent, and then the savings rate will increase (Li et al., 2007; Bloom et al., 2007; Pascual-Saez et al., 2020).
Fertility rate refers to the total number of children that an average woman has given birth
to or is likely to have in her lifetime if she is subject to the prevailing rate of age-specific fertility in the population. An increase in the fertility rate of the population leads to an increase in the child-rearing ratio, and the cost of rearing that the person bears in adulthood increases, which causes a certain crowding out of savings, which, in turn, leads to a reduction in the savings rate. The effect of fertility rate on savings may be through its effect on dependency ratio and personal wage growth, which ultimately leads to significant changes in household savings (Modigliani and Cao, 2004).
GDP growth rate is a measurement indicator, which examines the impact of a country or
region's economic growth on the savings rate. Different stages of national development may correspond to different savings and investment behaviours, which is especially important when studying country data. The increase in economic growth is also accompanied by the acceleration of per capita income growth. Therefore, young people in the saving stage are more affluent than the elderly in the negative saving stage, and the savings rate of a country’s residents increases accordingly (Modigliani and Brumberg, 1954; Loayza et al., 2000).
The labour force participation rate refers to the ratio of the economically active
population to the working-age population, and is usually used to describe the participation of a country or region in economic activities. The impact of the labour force participation
rate on savings is ambiguous (Li et al., 2007). The higher the labour force participation
rate, the more savings can be made by increasing per capita income, which can increase the savings rate. However, a larger labour force may also mean a higher unemployment
rate, thereby reducing the savings rate. Thus, a labour force participation rate has a negative effect on the savings rate (Li et al., 2007; Pascual-Saez et al., 2020).
Education level is expressed in the average years of schooling. The impact of education
level is ambiguous. Li et al. (2007) and Morisset and Revoredo (1995) believe that education has a positive effect on savings rate through increasing the rate of return on savings. However, Denizer, Wolf and Ying (2002) believe that people with higher education levels should have lower savings rates. This is because people with higher education levels are more likely to become working class. Similarly, people with lower education levels are more likely to be self-employed, so they will have more savings.
The Inflation rate is used to measure the degree of uncertainty or the risk of saving. This
variable is measured as an annual percentage using the GDP deflator. The impact of inflation on savings is ambiguous in theory and practice. On the one hand, the effects of inflation increase the uncertainty of future income flow, leading to increased savings for preventive purposes, especially for developing countries (Loayza et al., 2000; Athukorala and Sen, 2004). On the other hand, in a society with less income uncertainty, a higher inflation rate leads to a reduction in savings (Loayza et al., 2000; Athukorala and Sen, 2004).
The unemployment rate is used to measure consumers’ uncertainty about future currency
income. The effect of the unemployment rate on savings is unclear. The rise in the unemployment rate leads to a reduction in income, which brings more uncertainty and reduce the expected income, thereby further preventing the increase in savings (Basten, Fagereng & Telle, 2016). However, for the unemployed to stabilize their consumption during difficult times, they withdraw their savings. Therefore, the unemployment rate has a negative impact on current savings (Basten et al., 2016).
Interest rate is measured by the loan interest rate adjusted for inflation by the GDP
deflator. The effect of real interest rates on savings is not clear. When real interest rates fall, this boosts consumption and investment, but the rate of return on savings falls, leading to a fall in the savings rate (Loayza et al., 2000; Athukorala and Sen, 2004). However, the interest rate may also have a negative impact on savings. When interest rates fall, the rate of return on savings falls accordingly. To ensure equality of future
savings, people save more to compensate for the fall in the rate of return on savings, which leads to an increase in the savings rate (Loayza et al., 2000; Athukoralsa and Sen, 2004; Nwachukwu and Egwaikhide, 2007; Agrawal, 2001).
3.2 Model specification and generalization
This article uses a fixed-effects model to empirically analyse the relationship between dependency ratio and life expectancy and savings rate. The reasons for choosing a fixed effect model are given later. In the process of model building, based on the life cycle theory, the basic regression model is constructed according to the foregoing. Referring to the study of Horioka and Wan (2007), this article defines the representative indicators of the age structure of the population as the dependency ratio for children and the dependency ratio for the elderly. Therefore, this study begins with the regression analysis by estimating the effects of the dependency ratio and life expectancy on the savings rate. The specification is expressed as follows:
(1) 𝑠𝑎𝑣𝑒𝑖𝑡 = 𝛼0+ 𝛼1𝑑𝑒𝑝𝑜𝑙𝑑𝑖𝑡 + 𝛼2𝑑𝑒𝑝𝑦𝑜𝑢𝑛𝑔𝑖𝑡+ 𝛼3𝑙𝑒𝑝𝑖𝑡+ 𝛼4𝑋𝑖𝑡+ 𝛿𝑖+ 𝜇𝑖𝑡
where the subscript i is the country, t is the time. 𝑠𝑎𝑣𝑒𝑖𝑡 is the dependent variable defined
as domestic savings rate, 𝑙𝑒𝑝𝑖𝑡 is the life expectancy, 𝑑𝑒𝑝𝑦𝑜𝑢𝑛𝑔𝑖𝑡 is the child dependency
ratio, 𝑑𝑒𝑝𝑜𝑙𝑑𝑖𝑡 represents the old-age dependency ratio, 𝑋𝑖𝑡 represents the control variable,
𝛿𝑖 is a vector of country dummy variables to control for country-specific heterogeneity.
εit represents the random disturbance term.
On this basis, model (1) following the explanatory and control variables in the recent study by Pascual-Saez et al. (2020). The model in Pascual-Saez et al. (2020) to estimate the relationship between population ageing and savings is used to test the relationship between savings and population changes in 12 European countries. Pascual-Saez et al. (2020) mainly investigate the role of the two core explanatory variables. The first one is 𝑑𝑒𝑝𝑜𝑙𝑑𝑖𝑡 which represents the old-age dependency ratio, that is, the proportion of the
elderly population in the working population, and the second one is 𝑙𝑒𝑝𝑖𝑡 which represents
the life expectancy of the population. In addition, to effectively estimate the impact of core explanatory variables, they consider four control variables that affect the savings rate. 𝑑𝑓𝑒𝑟𝑡𝑖𝑙𝑖𝑡𝑦𝑖𝑡represents the fertility rate lagging one period. 𝑔𝑑𝑝𝑖𝑡is economic growth rate.
The labour force participation rate and the educational level are indicated by 𝑙𝑎𝑏𝑜𝑟𝑖𝑡 and
𝑒𝑑𝑢𝑐𝑖𝑡.
The version of model labelled as Model 1 is as follows:
(2) 𝑠𝑎𝑣𝑒𝑖𝑡 = 𝛼0+ 𝛼1𝑑𝑒𝑝𝑜𝑙𝑑𝑖𝑡+ 𝛼2𝑙𝑒𝑝𝑖𝑡+ 𝛼3𝑑𝑓𝑒𝑟𝑡𝑖𝑙𝑖𝑡𝑦𝑖𝑡+ 𝛼4𝑔𝑑𝑝𝑖𝑡+ 𝛼5𝑙𝑎𝑏𝑜𝑟𝑖𝑡
+ 𝛼6𝑒𝑑𝑢𝑐𝑖𝑡+ 𝛿𝑖+ 𝜇𝑖𝑡
However, existing studies about the determination of savings show that, in addition to the above four control variables, uncertainty macroeconomic conditions and financial conditions can also affect savings. Therefore, based on equation (2), taking into account the prediction accuracy and missing variables, Model 2 adds some additional control variables, including inflation rate (𝑖𝑛𝑙𝑓𝑖𝑡), unemployment rate (𝑢𝑛𝑒𝑚𝑝𝑙𝑜𝑦𝑚𝑒𝑛𝑡𝑖𝑡) and real
interest rate (𝑖𝑛𝑡𝑖𝑡).
Therefore, this article establishes the intermediate second regression equation labelled as Model 2 as follows.
(3) 𝑠𝑎𝑣𝑒𝑖𝑡 = 𝛼0+ 𝛼1𝑑𝑒𝑝𝑜𝑙𝑑𝑖𝑡+ 𝛼2𝑙𝑒𝑝𝑖𝑡+ 𝛼3𝑑𝑓𝑒𝑟𝑡𝑖𝑙𝑖𝑡𝑦𝑖𝑡+ 𝛼4𝑔𝑑𝑝𝑖𝑡+ 𝛼5𝑙𝑎𝑏𝑜𝑟𝑖𝑡
+ 𝛼6𝑒𝑑𝑢𝑐𝑖𝑡+ 𝛼7𝑖𝑛𝑙𝑓𝑖𝑡+ 𝛼8𝑢𝑛𝑒𝑚𝑝𝑙𝑜𝑦𝑚𝑒𝑛𝑡𝑖𝑡+ 𝛼9𝑖𝑛𝑡𝑖𝑡+ 𝛿𝑖 + 𝜇𝑖𝑡
Pascual-Saez et al. (2020) only consider the effect of the old-age dependency ratio savings rate. However, according to the life cycle theory, child dependency ratio can also affect the savings rate. At the same time, referring to studies by Horioka and Wan (2007), they find that the dependency ratio of children has an impact on savings. Therefore, the third regression equation (labelled as Model 3) contains three core explanatory variables, the child dependency ratio (𝑑𝑒𝑝𝑦𝑜𝑢𝑛𝑔𝑖𝑡), the old-age dependency ratio (𝑑𝑒𝑝𝑜𝑙𝑑𝑖𝑡) and the life
expectancy (𝑙𝑒𝑝𝑖𝑡).
(4) 𝑠𝑎𝑣𝑒𝑖𝑡 = 𝛼0+ 𝛼1𝑑𝑒𝑝𝑜𝑙𝑑𝑖𝑡+ 𝛼2𝑑𝑒𝑝𝑦𝑜𝑢𝑛𝑔𝑖𝑡+ 𝛼3𝑙𝑒𝑝𝑖𝑡+ 𝛼4𝑑𝑓𝑒𝑟𝑡𝑖𝑙𝑖𝑡𝑦𝑖𝑡+ 𝛼5𝑔𝑑𝑝𝑖𝑡
+ 𝛼6𝑙𝑎𝑏𝑜𝑟𝑖𝑡+ 𝛼7𝑒𝑑𝑢𝑐𝑖𝑡+ 𝛼8𝑖𝑛𝑙𝑓𝑖𝑡+ 𝛼9𝑢𝑛𝑒𝑚𝑝𝑙𝑜𝑦𝑚𝑒𝑛𝑡𝑖𝑡+ 𝛼10𝑖𝑛𝑡𝑖𝑡+ 𝛿𝑖
+ 𝜇𝑖𝑡
This article uses a fixed-effects model to empirically analyse the relationship between dependency ratio and life expectancy and savings rate. The ordinary least squares (OLS) method assumes that the relationship between individuals and at different time points is homogeneous (there is no individual effect and time effect), and this assumption is too strict. This is inconsistent with the actual situation of cross-country panel samples in this
article (Wooldridge, 2002). When choosing a fixed-effects or random-effects model, there are two considerations for choosing a fixed-effects model. Firstly, the result of the Hausman test rejects the random-effect model. Secondly, when the unobservable factors of each country are not related to the error term, the random effect model is unbiased and effective. This assumes that countries are homogeneous but each country has different systems, cultures, and customs. The OECD and BRICS country groups are also the populations the two groups of countries and as such the model should be estimated as fixed effects as there is no random issue involved. Therefore, these unobservable individual characteristics have different effects on the total national savings rate (Haque, Pesaran & Sharma, 1999). Therefore, this paper chooses a fixed effect estimation to control the influence of some unobservable individual characteristics such as country-specific social and economic factors. In other words, the intercept varies between countries shifting the saving equation, and the slope coefficient is the same for all sample countries. The different model specifications can be tested using a joint test (F-test based on residual sums of squares) to choose the accepted model specification based on which the result is analysed.
5. Analysis of the Result
5.1 Empirical result
Table 2 shows the estimation results of the three models specified above. The models are estimated by the fixed effects estimation method. The three models are each estimated using all countries, the OECD group and the BRICS group. To examine the effects of the old-age dependency ratio, the child dependency ratio and life expectancy on the savings rate, the three models are estimated conditional on different sets control variables. Model 1 (equation 2) compares the results of Pascual-Saez et al. (2020) to verify the correlation between the old-age dependency ratio and life expectancy on the savings rate. Model 1 includes four control variables which are the economic growth rate, the fertility rate lagging by one period, the labour participation rate and the mean years of education. Based on Equation 2, model 2 (equation 3) adds additional control variables including inflation rate, unemployment rate and real interest rate, mainly to examine the impact of uncertainties and financial factors on the savings rate. To test whether the child dependency ratio can explain the changes in the savings rate, Model 3 (equation 4), based
on Equation 3, adds the core demographic structure variable, the child dependency ratio. All estimation results are presented in Table 2. To express the empirical results more concisely, the columns corresponding to the results of the whole sample, OECD and BRICS are expressed as A, B and C.
Model 1 in Table 2 shows the results of Equation 1. The results of the core explanatory variables are consistent with the expected results in Model 1A and Model 1B, that is, the old-age dependency ratio and the savings rate are significantly negatively correlated, and the life expectancy and savings rate are significantly positive. This is similar to the results of Pascual-Saez et al. (2020). However, the results of Model 1C are not significant for the old-age dependency ratio and life expectancy.
The results of the control variables show that only the results of economic growth have statistically significant positive correlations with savings in model 1A, 1B, and 1C, which is consistent with the results of Pascual-Saez et al. (2020). The remaining control variables have different significance in Model 1A, B, C. In Model 1A, only the years of education is positive and statistically significant. In Model 1B, all control variables are significantly positively correlated. In Model 1C, the years of education and the labour force participation rate have significant correlations with savings.
Model 2 in Table 2 corresponds to the regression result of Equation 3. Model 2 expands the control variables based on Model 1, but the inclusion of extraneous redundant variables in the model may cause the model efficiency to decrease. In this paper, a joint F test is performed on the new control variables to test whether the newly added control variables are irrelevant and redundant. The results show that in Model 2A and Model 2B, the newly added control variables are not superfluous, so these variables are included. In Model 2C, although the results indicate that the newly added control variables are superfluous, it does not change the significance of focus variables and there is no large difference in the values of the main core variables, after adding new control variables. At the same time, to better compare and explain the results of OECD countries and BRICS countries, Model 2C also includes new control variables.
When additional control variables are added, the coefficients of life expectancy and old-age dependency ratio are always significantly in Model 2A and Model 2B, and the impact on the savings rate increases; however, Model 2C is always insignificant. Among the original control variables, only economic growth and years of education in Model 2A are significantly positively related to the savings rate, while the coefficients of the lagging fertility rate and labour participation rate are always not significant. In Model 2B, the labour participation rate has little effect on savings, while the coefficients of the remaining three control variables are smaller but significant. The four original control variables of Model 2C are not significantly different, and the lagging fertility rate is always not significant to the savings rate.
The results of the new control variables show that the coefficient of the inflation rate is not significantly in the three groups, while the unemployment rate has a significant negative correlation with savings, only in Model 2A and 2B. The real interest rate and savings are significantly negatively correlated, only in Model 2A.
Model 3 in Table 2 shows the results of Equation 4. Model 3 adds the child dependency ratio. Combined with the F test again, the redundancy of the control variables added in Model 2 shows that the variables are not redundant at the 10% confidence level.
The coefficient of child dependency ratio is significantly negatively correlated, which meets hypothesis 2 in the three groups. Although the old-age dependency ratio is slightly lower and less negatively related to savings, it is always only significant in Model 3A and Model 3B, and not significant in Model 3C. It is worth noting that the coefficient of life expectancy is reduced in Model 3A and Model 3B. However, the life expectancy in Model 3C is significantly positively correlated with the savings rate, and it lags after joining the child dependency ratio.
After adding the child dependency ratio, the coefficients of economic growth and one-stage fertility rate were significant and positive in the three groups, but the coefficients of real interest rates were not significant in the three groups. The labour participation rate is significant in Model 3B and 3C, but the direction is opposite. In Model 3B, there is a positive correlation between the labour participation rate and the savings rate; while in Model 3C, there is a negative correlation. The years of education are statistically
insignificant only in Model 3C. The unemployment rate has a significant negative correlation with savings in Model 3A and Model 3B, while the inflation rate is only significantly positive correlations with savings in Model 3A and Model 3C.
5.2 Discussion of the results
Life expectancy has a significant impact on OECD savings, but only after incorporating the child dependency ratio, life expectancy has a significant impact in BRICS countries. For the interpretation of this result, when the economy has a relatively complete pension system, universal life insurance and retirement incentives, a higher life expectancy leads to a higher savings rate (Bloom et al., 2007). However, in the absence of social security and capital market perfection, people's best response to life extension is to extend the length of the working period rather than increase savings. When the economy has a relatively complete social security system, rational actors can use the social security system to deal with longevity risks (Bloom et al., 2007). According to OECD statistics, the average public social expenditure of OECD countries generally accounts for more than 20% of the total fiscal expenditure, and some of the welfare countries account for more than 25% (OECD, 2019b). Although BRICS countries have been improving the social security system in the past, there are still many shortcomings. Social security expenditures are a small share of total expenditure (ILO, 2018). Differences in social security expenditures also affect the effect of redistribution to a certain extent. Among them, the effective coverage rate of social protection cash allowance (except health) is 22% to 90% in the BRICS countries. However, 10% to 78% of the population of the BRICS countries is not covered at all (ILO, 2018). At this stage, Russia and Brazil have higher coverage rates, while the other three countries have lower coverage rates. A large number of informal employees, agricultural workers, self-employed persons and other groups have been excluded from the public pension system for a long time, resulting in a low coverage rate (Ghai, 2015).
The opposite effect of age structure on savings is in BRICS and OECD. In BRICS, the child dependency ratio can best explain their saving behaviour, while the old-age dependency ratio has a little effect on savings. The effect of child support on savings is more significant, and the explanation is that families in BRICS countries raise more children than in OECD countries. Therefore, the cost of raising children by the residents
should occupy an important position of the residents' disposable income. Therefore, the savings of residents are reduced, and the motivation for saving for retirement after this time is not great.
The reason why the change of the old-age dependency ratio has no significant effect on the household savings rate may be: the average old-age dependency ratio in BRICS countries is relatively small, compared with OECD, which shows that it is in the early stage of ageing. The overall impact of the issue of economics on economic development and social life is still relatively weak. Although the ageing trend is developing at a fast speed, it starts late, and the maintenance expenditure is still in a low position compared to developed countries and regions with a high degree of ageing in the OECD. Moreover, the role of children in providing for the elderly is stronger. It can also be seen from the comparison of the BRICS's average child dependency ratio that the number of children of their offspring is relatively large, so the child pension plays a certain role in replacing the consumption of residents entering the old age, thereby reducing the impact on household savings.
In the OECD countries, the negative effect of the old-age dependency ratio on savings is greater than the impact of the child dependency ratio. This may be because children in OECD countries are relatively small. At the same time, since OECD countries are different from BRICS countries, raising children is not a guarantee for their elderly care. At the same time, the social security system in OECD countries is relatively complete. Therefore, residents save the cost of raising children and save for their retirement. Control variables
The economic growth rate has a positive effect on the savings rate, and it passes the test
at a significant level. For the OECD group, the economic growth rate can promote the savings rate less than the BRICS group. This is because the OECD group is mostly built on developed countries. Due to the large per capita income base, the growth is relatively slow, so the effect of the growth rate on the savings rate is weakened (Loayza et al., 2000). In the BRICS group, rising economic growth rates can increase the household savings rate to a greater extent. Economic growth is equivalent to the increase in residents’ labour income. Due to the influence of consumption inertia and the uncertainty of future income
growth, people do not rush to use all the increased income for consumption, and their savings increase accordingly. The member countries of the BRICS group are in the stage of economic growth, and the future increase in economic growth rate continues to cause the expansion of household savings.
The previous fertility rate is significantly positively correlated with savings in OECD. In
BRICS previous fertility rate is only significant when the child dependency ratio is added. The OECD group shows that the increase in the birth rate has a positive effect on household savings in general. The continuous decline in the fertility rate reduces the working-age population. With no change in the per capita capital stock, excess capital can be converted into people's consumption, which in turn causes an increase in per capita consumption and reduces the savings rate of the whole society (Galor and Weil, 1996). In the BRICS group, the dependency ratio of children is particularly important for the savings rate. Therefore, the effect of the previous fertility rate on savings only appears when the child dependency ratio is added.
The labour participation rate has different effects on the savings rate, in the two groups.
In the OECD, an increase in the labour participation rate increases significantly the savings rate. This may be because the elderly labour force can fill deficits in the labour force in OECD. Therefore, a larger labour force participation rate can increase savings by increasing economic growth. However, in BRICS, labour participation rate and savings have a negative correlation. The population density of BRICS countries is higher, and a larger labour force may also mean a higher unemployment rate. Unemployed people spend more current savings to cover living costs, thereby reducing the savings rate. There is a positive correlation between the years of schooling and the savings rate, in the OECD group and the BRICS group. This shows that as the education level increases, the savings rate rises. The effect of years of education in the OECD group on the savings rate is smaller than that in the BRICS group. This may be because the average years of education in the OECD group is higher than that in the BRICS group. Well-educated people should have a lower savings rate, because they are more likely to be working-class people than people with less education. Similarly, people with lower education may be more likely to become self-employed, so they should save more (Denizer et al., 2002).
This is because well-educated parents pay more attention to the quality of their children’s education. They spend more on education and save less.
The unemployment rate is a prominent performance of the economic situation. The
unemployment rate in the OECD countries has a negative and significant relationship with the savings rate, while BRICS has no significant effect. From the OECD group, the higher the unemployment rate, the lower the savings rate. When the unemployment rate rises and income decreases, social residents will reduce their savings to maintain their original consumption levels during difficult times (Basten et al., 2016).
The impact of the inflation rate is only significantly positive in BRICS countries. Although it is small, it is not as expected. This may be because fluctuations in the inflation rate increase the uncertainty of individual households’ expected income and increase the savings rate (Taş, Alptekin & Yılmaz, 2017). In most developing countries in BRICS countries, the development of financial markets is relatively imperfect. Compared with bank deposits, residents in these countries lack more suitable hedging measures, so when risks come, saving is still the best choice.
The effect of real interest rates on savings is minimal, in OECD and BRICS. In theory, real interest rates affect savings from the substitution effect and the income effect (Loayza et al., 2000). When two effects counteract each other, so there is no significant correlation.
6. Conclusion
The ageing of the population causes the increase of life expectancy and the increase of dependency ratio. This paper is based on the life cycle theory and considers the impact of life expectancy and dependency ratio on savings in BRICS and OECD countries. Panel data of OECD and BRICS from 1995 to 2017 is applied with various models to empirically analyse the relationships of life expectancy and the old-age and child dependency ratios on the savings rate. Empirical results show that in OECD countries, the increase in life expectancy increases the savings rate; the child dependency ratio and the old-age dependency ratio reduces the savings rate; and the elderly population has a more obvious inhibitory effect on savings. In BRICS countries, the old-age dependency ratio shows no significant correlation on the savings rate. The positive impact of life
expectancy is small. However, comparing the results for life expectancy and the old-age dependency ratio, the child dependency ratio and the savings rate show a negative and significant relationship. This paper concludes that because BRICS countries have a lower level of economic development than OECD countries, the social security system is not perfect. Further, most of the BRICS countries are in the early stages of ageing, resulting in high proportions of children. Thus, people save more money for raising children. Most OECD countries are advanced developed countries in the world. The economy has gone through the stages of take-off, growth and maturity, and the population structure has also entered the stage of old age from young people and adults. To fill some of the knowledge gaps differing OECD and BRICS countries, it is of great significance to compare the relationship between the population structures, and the national savings rates. In order to, there are some suggestions for the BRICS countries.
A. Improve the old-age security system
A relatively well-developed old-age insurance system can ensure the financial income of the elderly after retirement. It is an important guarantee for the elderly and the main pillar of support to prevent them from falling into poverty.
B. Realize a flexible retirement system
In response to the intensification of the ageing crisis, most OECD countries have put the retirement age in the first place when implementing pension insurance parameter reforms; to adapt to the increase of the average life expectancy of the population; ease the pressure on pension payments; and ensure the balance of pension payments and sustainability of the system. The implemented flexible retirement system can not only encourage capable seniors to continue their labour, but also contribute to their strength while avoiding poverty. It can also assist some of the seniors who are not suitable for continuing to retire early and have the choice of retirement age. Great autonomy meets the needs of old-age security for the elderly in different situations.
C. Improve the medical security system and increase the coverage of medical insurance
Diseases are wide-spread causes of poverty, especially among elderly people who are at higher risks. It is recommended to further improve the medical security system covering residents, and to supplement and support the pension security system. Investment in healthy ageing supports the elderly to become self-sufficient, hence requiring less health service.
This paper has a limitation and needs to be further improved in future researches: how to better quantify ageing. In this study, the dependency ratio and life expectancy are used as proxies for ageing. While life expectancy is prolonged, an increase in healthy life expectancy may not occur simultaneously. If the healthy lifespan does not increase, then the original ageing variables cannot effectively measure ageing. Therefore, future research can measure the impact of ageing from healthy longevity.
References
Adams, N. (1971). Dependency Rates and Savings Rates: Comment. The American
Economic Review, 61(3), 472–475.
Agrawal, P. (2001). The relation between savings and growth: cointegration and causality evidence from Asia. Applied economics, 33(4), 499-513.
Akin, T., & Yavuzaslan, K. (2019). The effects of demographic structures on savings in Eastern European countries. Eastern Journal of European Studies, 10(1), 93–114. Apergis, N., & Christou, C. (2012). Dependency Rate and Savings: The African Evidence with Panel Data. International Journal of Business and Management, 7(4), 84–95. Athukorala, P., & Sen, K. (2004). The Determinants of Private Saving in India. World
Development, 32(3), 491–503.
Basten, C., Fagereng, A., & Telle, K. (2016). Saving and Portfolio Allocation Before and After Job Loss. Journal of Money, Credit and Banking, 48(2-3), 293–324.
Bloom, D. E., Canning, D., & Graham, B. (2003). Longevity and life‐cycle savings. Scandinavian Journal of Economics, 105(3), 319-338.
Bloom, D. E., Canning, D., Mansfield, R. K., & Moore, M. (2007). Demographic change, social security systems, and savings. Journal of Monetary Economics, 54(1), 92-114.
Boateng, E., Agbola, F. W., & Mahmood, A. (2019). Does the quality of institutions enhance savings? The case of Sub-Saharan Africa. Applied Economics, 51(58), 6235-6263.
Bosworth, B., & Chodorow-Reich, G. (2007). Saving and Demographic Change: The
Global Dimension (Working paper No. 2007-2). Chestnut Hill, MA: Center for
Retirement Research at Boston College.
Bosworth, B. P., & Keys, B. (2004). Increased life expectancy: a global perspective. In H. Aaron & W. B. Schwartz (Eds.), Coping with Methuselah: The Impact of
Molecular Biology on Medicine and Society (pp. 247-276). Washington, DC:
Brookings Institution Press.
Brookins, O. T., Ahmad, M. H., Ahmad, N., & Saeed, N. (2015). The impact of age structure on household saving: An empirical investigation in three South Asian economies. International Journal of Economic Perspectives, 9(3), 47-56.
Cavallo, E., Sánchez, G., & Valenzuela, P. (2018). Gone with the wind: Demographic transitions and domestic saving. Review of Development Economics, 22(4), 1744-1764.
Cocco, J., & Gomes, F. (2012). Longevity risk, retirement savings, and financial innovation. Journal of Financial Economics, 103(3), 507–529.
Davis, E. P. (2007). How will ageing affect the structure of financial markets. In C. Kent, A. Park, & D. Rees (Eds.), Demography and Financial Markets (pp. 266–295). Sydney, Australia: Reserve Bank of Australia.
Denizer, C., Wolf, H., & Ying, Y. (2002). Household savings in the transition. Journal of
Comparative Economics, 30(3), 463-475.
Friedman, M. (1957). Introduction to "A theory of the consumption function". In M. Friedman (Ed.), A theory of the consumption function (pp. 1-6). Princeton, NJ: Princeton University Press.
Galor, O., & Weil, D. (1996). The gender gap, fertility, and growth. The American
Economic Review, 86(3), 374–387.
Ghai, M. (2015). A model for universal social security coverage: The experience of the BRICS countries. International Social Security Review, 68(3), 99-118.
Haque, N. U., Pesaran, M. H., & Sharma, S. (1999). Neglected Heterogeneity and
Dynamics in Cross-country Savings Regressions (IMF Working Paper, No. 99/128).
Washington, DC: International Monetary Fund.
Horioka, C. Y., & Wan, J. (2007). The determinants of household saving in China: a dynamic panel analysis of provincial data. Journal of Money, Credit and
Banking, 39(8), 2077-2096.
ILO. (2018). Moving towards a universal and sustainable social security system in the
BRICS countries. Retrieved from
https://www.ilo.org/wcmsp5/groups/public/---dgreports/---dcomm/documents/meetingdocument/wcms_636190.pdf
Kelley, A. C., & Schmidt, R. M. (1996). Saving, dependency and development. Journal
of population economics, 9(4), 365-386.
Kraay, A. (2000). Household saving in China. The World Bank Economic Review, 14(3), 545-570.
Lee, R., & Mason, A. (2006). What Is the Demographic Dividend? Finance &
Lee, R., Mason, A., & Miller, T. (2000). Life cycle saving and the demographic transition: The case of Taiwan. Population and Development Review, 26, 194-219.
Leff, N. H. (1969). Dependency rates and savings rates. The American Economic
Review, 59(5), 886-896.
Li, H., Zhang, J., & Zhang, J. (2007). Effects of longevity and dependency rates on saving and growth: Evidence from a panel of cross countries. Journal of Development
Economics, 84(1), 138-154.
Loayza, N., Schmidt-Hebbel, K., & Servén, L. (2000). What drives private saving across the world?. Review of Economics and Statistics, 82(2), 165-181.
Loumrhari, G. (2014). Ageing, longevity and savings: The case of Morocco. International Journal of Economics and Financial Issues, 4(2), 344-352. Lucas, R. E. (1988). On the mechanics of economic development. Journal of Monetary
Economics, 22(1), 3-42.
Mason, A., & Lee, R. (2006). Reform and support systems for the elderly in developing countries: capturing the second demographic dividend. Genus, 62(2), 11-35. Modigliani, F. (1970). The Life-Cycle Hypothesis and Intercountry Differences in the
Saving Ratio. In W. A. Eltis, M. F. G. Scott, & J. N. Wolfe (Eds.), Induction,
Growth and Trade: Essays in Honour of Sir Roy Harrod (pp. 197–225). Oxford,
England: Oxford University Press.
Modigliani, F., & Brumberg, R. (1954). Utility analysis and the consumption function: An interpretation of cross-section data. Franco Modigliani, 1(1), 388-436.
Modigliani, F., & Cao, S. L. (2004). The Chinese saving puzzle and the life-cycle hypothesis. Journal of economic literature, 42(1), 145-170.
Morisset, J., & Revoredo, C. (1995). Savings and education: A life-cycle model applied
to a panel of 74 countries (Working paper No. 1504). Washington, DC: World
Bank.
Nwachukwu, T. E., & Egwaikhide, F. O. (2007). An error-correction model of the
determinants of private saving in Nigeria. Paper presented at the African Economic
Society Conference, Cape Town, South Africa.
OECD. (2019a). Health at a Glance 2019: OECD Indicators. Retrieved from https://www.oecd-ilibrary.org/docserver/4dd50c09
en.pdf?expires=1589801647&id=id&accname=guest&checksum=98D16E8FEF9 D3B5F52CDB13A92286571.
OECD. (2019b). Public social spending is high in many OECD countries. Retrieved from http://www.oecd.org/social/soc/OECD2019-Social-Expenditure-Update.pdf Pascual-Saez, M., Cantarero-Prieto, D., & Manso, J. R. P. (2020). Does population ageing
affect savings in Europe?. Journal of Policy Modeling, 42(2), 291-306.
Post, T., & Hanewald, K. (2013). Longevity risk, subjective survival expectations, and individual saving behavior. Journal of Economic Behavior & Organization, 86, 200-220.
Ram, R. (1982). Dependency rates and aggregate savings: a new international cross-section study. The American Economic Review, 72(3), 537-544.
Romer, P. M. (1986). Increasing returns and long-run growth. Journal of political
economy, 94(5), 1002-1037.
Slavov, S., Gorry, D., Gorry, A., & Caliendo, F. (2019). Social Security and Saving: An Update. Public Finance Review, 47(2), 312–348.
Solow, R. M. (1956). A contribution to the theory of economic growth. The quarterly
journal of economics, 70(1), 65-94.
Taş, T., Alptekin, V., & Yılmaz, K. Ç. (2017). The stability of money demand under the structural breaks in Turkey. Journal of Current Researches on Business and
Economics, 7(1), 265-280.
Tsai, I. J., Chu, C. C., & Chung, C. F. (2000). Demographic transition and household saving in Taiwan. Population and Development Review, 26, 174-193.
Wooldridge, J. M. (2002). Econometric analysis of cross section and panel data. Cambridge, MA: MIT Press.
World Bank. (2018). Global Economic Prospects, January 2018 : Broad-Based
Upturn, but for How Long?. Washington, DC: World Bank.
World Bank. (2020). Global Economic Prospects, January 2020 : Slow Growth, Policy
Challenges. Washington, DC: World Bank.
Yaari, M. E. (1965). Uncertain lifetime, life insurance, and the theory of the consumer. The Review of Economic Studies, 32(2), 137-150.
Zeng, S., Zhang, X., Wang, X., & Zeng, G. (2019). Population Aging, Household Savings and Asset Prices: A Study Based on Urban Commercial Housing Prices. Sustainability, 11(11), 3194.
Zhang, J., Zhang, J., & Lee, R. (2003). Rising longevity, education, savings, and growth. Journal of Development Economics, 70(1), 83-101.