ISSN 0347-6049
1991
, t' ' , ) få" ' . , rH WMA/hgh" håg/MQ , f , _ A (I! Ed: ? ,, \ A"» _ . J, , 'Vi. Fli-ti _ A ' ?; *vEng
. __A____.__...._ ___4_.._._._.-__./vv VESA/51,30» "x'. ». Ayn. ,, M.Slee disturbances caused by
vibr tions from heavy road traffic
eter
Arnberg, Swedish Road and Traf c Research Institute,
inköping, Sweden
ve Bennerhult, 3K Akustikbyrån AB, Sundbyberg, Sweden
acob L Eberhardt, Institute of Environmental Health,
University of Lund, Sweden
Reprint from The Journal of the Acoustical Society ofAmerica,
Vol 88, No 3, September 1990, pp 1486 1493
Vay-00/7 Traflk-
Statens väg- och trafikinstitut (VT/l . 587 o 7 Linköping
Sleep disturbances caused by vibrations from heavy road traf c
Peter W. Arnberg
Road and Tra ic Research Institute, S-58IOI Linköping, Sweden
Ove Bennerhult
3KA kustikbyrån AB, P. 0. Box 3029, S-I 7203 Sundbyberg, Sweden
Jacob L. Eberhardt
Institute ofEnvironmental Health, University ofLund, Sölvegatan 21, S-223 62 Lund, Sweden (Received 12 May 1987; accepted for publication 20 March 1990)
The in uence of whole-body Vibrations, noise, and a combination of the two, caused by heavy road tra ic (150 events/night) on sleep, subjectively experienced sleep quality, and
performance was investigated under controlled laboratory conditions for male and female subjects 20 35 years of age. A room was built above a vibrator table, with the legs of the bed mounted directly on the table through holes in the oor. Vertical vibrations were found to be attenuated by the mattress with 20 40 dB for frequencies > 10 Hz, whereas horizontal vibrations were slightly ampli ed. It could be concluded that when traf c noise [50-dB(A) peak level] is accompanied by vibrations with peak levels of 0.24 m/s2 vertically and 0.17 m/s2 horizontally as measured on the frame of the bed (stimulus duration approximately 2 s, dominant frequency approximately 12 Hz), sleep is more disturbed than is the case when noise alone occurs. The amount of REM sleep, which was signi cantly reduced for the vibration level mentioned above, was even more disturbed when a higher exposure level, 0.34 m/s2 vertically and 0.24 m/s2 horizontally, was applied. The subjectively rated sleep quality was lower for the higher than for the lower vibration level. Performance in the morning was only in uenced for the higher vibration level. It could be concluded that vibration exposure levels near the recommendation made in ISO-standard 2631 for the awake state disturb sleep in man. PACS numbers: 43.40.Ng, 43.50.Qp
INTRODUCTION
Man is continuously exposed to different types of vibra-tions, for example, in buildings and transportation vehicles. This can lead to experiences ofdiscomfort and fatigue as well as having a detrimental in uence on work performance.
Norms exist for acceptable whole-body vibrations, ' based on
perception, comfort, performance decrement, and health risk judgments. However, nothing is known about the in u-ence of whole-body vibrations on sleep.
On the other hand, a number of studies performed in recent years in the homes of the subjects have dealt with the
effects of tra ic noise on sleep? 9 However, in none of these
studies has the role of possible whole-body vibrations andinfrasound, caused by road traf c, been taken into account.
It is not at all impossible that some of the discrepancies in sleep research ndings concerning the effects of noise might be due to contributions from vibrations and infrasound. This
is supported, e.g., by Sando and Batty,10 who, in a large
so-cial survey in England, found that 8% of the population is greatly disturbed by road tra ic vibrations.The present study investigates some of the research questions mentioned above. In this investigation, the in u-ence of vibrations, noise, and a combination of the two as
* Present address: RST Sweden, Box 4202, 8-171 04 Solna, Sweden. b) Present address: Department of Occupational and Environmental
Medi-cine, University of Lund, S-223 62 Lund, Sweden.
1486 J. Acoust. Soc. Am. 88 (3), September 1990 0001 -4966/90/091 486-08$00.80
caused by heavy road traffic (trucks and buses) on sleep subjectively rated sleep quality, and performance in the morning was investigated under controlled laboratory con-ditions.
I. MATERIALS AND METHODS A. The vibration simulator
A room (2.25 X 2.75 m) was built above a 1.25 ><1.25-m
large vibration simulator table (Schenck). The legs of the bed were mounted directly on the table through holes in the oor. The simulator could be driven hydraulically, both horizontally and vertically, by analogous signals from re-corded realistic tra ic vibrations. The subjects could be exposed to noise and infrasound simultaneously. In the pres-ent study, the effects of infrasound were not investigated, however. Both tra ic noise and vibrations were recorded indoors in buildings built on clay where vibrations from passing trucks and buses were reported to be a problem. The horizontal and vertical components of the vibrations were of approximately the same amplitude.
Prior to the sleep studies, the vibration signal transfer functions of the simulator were studied, together with the vibration attenuation properties of three different mattresses and four different pillows. Accelerometers were located on
the vibrator table, between the shoulder blades of the subject lying on his back (using a standard seat accelerator, Briiel &
Kjaer type 4322) and on the forehead. Three subjects of
varying weight and length (53 kg/ 161 cm, 69 kg/ 175 cm, and 91 kg/181 cm) participated. The vibration signals were analyzed with a digital signal analyzer (HP 5420A). In the subsequent sleep studies, only bed #1 and pillow #1 were used.
B. Subjects and exposure
After a short pilot study, in which one subject was ex-posed to vibrations of different amplitude in order to get
some conception about awakening thresholds, three studies
were performed using vibration levels that were not expected to cause awakenings, but could be perceived by the subjects when awake. In two studies the subjects, aged 20 35 years, were exposed to prerecorded vibrations from heavy road traf c and in one study the exposure consisted of road traf c noise and a combination of this noise and the same vibration exposure as above.
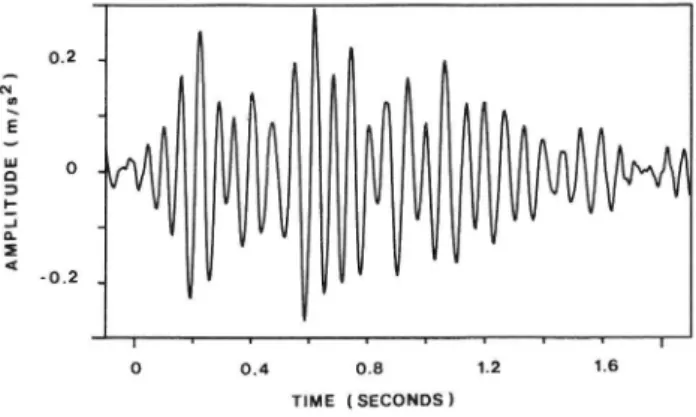
The exposure tape, recorded on an FM recorder, con-sisted of a sequence of ten bus passages that was repeated at approximately 30-min intervals, i.e., about 14 times during a 7-h night. Within the sequence, the time interval between the ten different stimuli was 90 130 s. Between the sequences there was a longer pause of about 10 min. Examples of typi-cal stimuli are shown in Figs. 1 and 2. Each stimulus lasted approximately 2 s and had a dominant frequency of about 12 Hz. The ten bus passages were all recorded at the same loca-tion. Since the properties of the vibrations caused by heavy tra ic are mainly determined by the unevenness of the road surface, the recorded stimuli were very much alike.
The purpose of the rst two studies was to investigate arousal reactions, directly following the stimuli. In the third experiment, effects on the whole-night-sleep stage pattern were studied.
In the rst study, four subjects (one male and three fe-males) were, after three habituation nights (no recordings made), exposed to approximately 140 vibration stimuli per night for three consecutive nights. The peak level for the stimuli, measured on the frame of the bed, was 0.24 m/s2
vertically and 0.17 m/s2 horizontally.
In the second study, the same four subjects participated. The experimental design was similar to that of the rst study. During the second exposure night, the same tape with vibrations as during the rst study was played back, but the
0.2 "' OT(D 1 E uJ 0 -0 :> * : _ 0. E '( o.2 -0 0.4 0.8 1.2 1.6 TIME (SECONDS)
FIG. 1. Horizontal road traf c noise vibrations measured on the frame of the bed.
1487 J. Acoust. Soc. Am., Vol. 88, No. 3, September 1990
0.2.
i
5?(D E _ in 0 O.. :) t J _ D.. E< 02- H 0 0.4 0.8 1.2 1.6 TIME (SECONDS)FIG. 2. Same as Fig. 1, but measured on the mattress.
vibrations were accompanied by the noise of the vehicles [with a maximum noise level of Lp max = 50 dB(A) ]. Dur-ing the rst and third nights, the subjects were exposed to the noise only.
In the third study, ve subjects (three males and two females), who had not participated earlier, were, after two habituation nights, exposed for ve consecutive nights ( rst
night not included in the analysis). After a l-week break,
they spent another four consecutive nights in the laboratory, without any exposure, and after an additional week off, the study ended with four exposure nights. During the rst
week, the exposure level was the same as in the rst study
(V10W ). The vibration pattern consisted of a bus passage (one of the ten mentioned above) recorded digitally on the oppy disk of a small microcomputer and replayed semiran-domly about 155 times per night (time interval between two stimuli at least 90 s). This procedure gives a greater
exibil-ity, and since the ten recorded vibrations were very similar,
the limitations of the use of one single bus passage repeated all through the nights was not felt to be severe. The second week was without exposure and served as a control. During the third week, the peak vibration level was raised to 0.34 m/
s2 vertically and 0.24 m/s2 horizontally (Vhlgh ). A design
with two l-week breaks was chosen in order to prevent too much habituation to the stimuli. It was shown by Lukas etal. ,12 and Muzet et al.13 that a discontinuation of the
ex-perimental series largely prevents habituation.C. Registrations and analysis
Eight channels of electrophysiological and exposure data [vertical and horizontal acceleration measured on the frame of the bed; noise level (infrasound if needed); EEG (C3-A2 and C4-Al ); EOG; and submental EMG] were re-corded digitally on one track of a tape recorder using the
PCM technique (pulse code modulation) (Johne + Reil hofer). Each l/4-in. tape holds four tracks. At the low tape
speed used, the bandwidth of the system is 0 50 Hz. The EMG signals were recti ed and smoothed before recording. For analysis, the signals were replayed at 16 times the re-cording speed.
The three experimental series were analyzed on arousal reactions indicating disturbed sleep, such as shifts in sleep stage toward lighter sleep, disturbances in the EEG too short
to be scored as a change of sleep stage, and motor activity. Short EEG reactions that were considered were bursts of alpha activity in stages 2-4, a sudden decrease in delta activ-ity, or K-complexes occurring in stage 1 or REM. In the analysis of arousal frequencies, spontaneous reactions have to be taken into account. This is done by comparing the probability of a reaction during a 30-s period following the stimulus with a matched control period 30 s prior to the
stimulus.7 14 In this way, matching is obtained with respect
to time of night and sleep stage, two factors known to be of importance for the arousal frequency (see, for example, areview by Griefahn15 ).
Besides arousals, the in uence of the two vibration lev-els on the sleep stage distribution, analyzed according to
Rechtschaffen and Kales,16 was studied in the third
experi-ment. The subjects had to answer a questionnaire and carry out a performance test both before bedtime and in the morn-ing directly after awakenmorn-ing. The mornmorn-ing questionnaire contained questions about the subjectively experienced sleep quality, as described in Ref. 7, but two questions, adminis-tered on the subsequent afternoon, How disturbed were you in your daily work?, and How did you function in your daily work as compared to normally?, each with veanswer alternatives, were added.
In the performance test, the subjects had to watch a computer monitor where, at irregular time intervals, one out of three possible dot patterns occurred in a random position
on the screen. When a pattern was observed, a
correspond-ing button had to be depressed as promptly as possible. The
reaction times, number of errors and number of unobserved
patterns were recorded. Each performance test lasted for about half an hour and consisted of approximately 50 trials. The test was practiced about six times before the start of the experiment in order to reduce learning effects during the experimental series.
The statistical analysis of the arousal frequencies was carried out with a chi-squares test. The whole-night sleep parameters and the performance parameters were analyzed using two-way analysis of variance, studying the effects of the three experimental conditions and interindividual differ-ences. For the results of the questionnaire, which were mea-sured in an ordinal scale, the experimental conditions were compared for each subject separately with Mann Whitney s U-test. The same test was used for the pooled scores of the different subjects. Since the direction of the change that oc-curs under exposure conditions is predicted, one-tailed tests were performed.
II. RESULTS
A. The vibration simulator
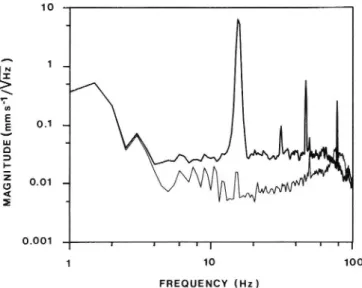
Figure 3 shows the background vibrations of the simula-tor table that occur in the absence of any input signal. These vibrations have a peak level around 80 Hz and occur mainly in the vertical direction. Since the beds show a considerable attenuation for vertical vibrations > 10 Hz (see Fig. 7 and text below) the background vibrations were reported by the subjects to be not perceivable in bed. The higher
low-fre-quency vibration levels in the bed, compared to the table,
were probably caused by movements of the subjects.
1488 J. Acoust. Soc. Am., Vol. 88, No. 3, September 1990
':
L= 1
\ _ in E E *"I. on _ Q = _ ': Z 0; 0.01-
|,
0001 _ [ T I ll r l [T 1 1o 100 FREQUENCY(Hz)FIG. 3. Vibration velocity Spectrum: background noise - on the vibration table and in bed No. 1.
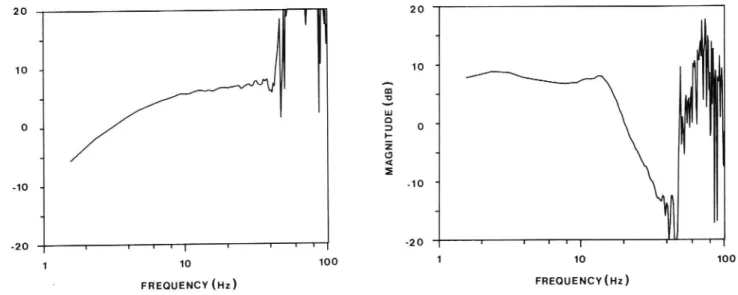
The ability of the table to reproduce the input signals is limited by background noise, modulation noise, and nonlin-earity of the system. Figure 4 shows the response of the table as the result of a sine-wave excitation with 16 Hz. The veloc-ity spectrum on the table compared to an input pink noise signal with frequencies below 30 Hz is shown in Fig. 5. Fig-ure 6 shows the transfer functions of the vibration system for vertical and horizontal directions. It can be concluded from the gures that the response of the system is quite acceptable for frequencies ranging from 1 30 Hz.
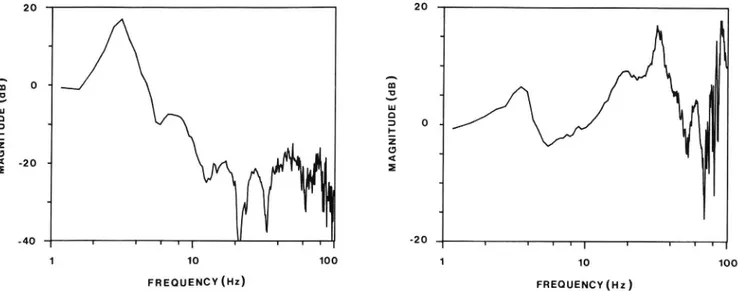
A typical attenuation curve for vertical vibration for the bed and mattress used in the sleep experiments (bed No. 1) is shown in Fig. 7. The different beds show no attenuation for very low frequencies, an ampli cation of about 15 dB at a resonance frequency of 2 5 Hz (the low frequency for a soft,
foam plastic mattress) and a maximum attenuation of 15 20
10 N 1 _ I q x ICD
& 0.1 _
Lu - / o : * IN ': z 1 O 0-01 _ < E . 0'001 I | I l ' | l | | 1 10 100 FREQUENCY (Hz )FIG. 4. Vibration velocity spectrum: The effect of a 16 Hz sine wave excita-tion as compared to the background noise (both measured on the vibrator table).
N 1 " I _
,_\
in E 0.1-£
-LLI O D |-E 0.01 _. (D ( _| 2 0.001 -I l i l ' I l T T 1 10 100 FREQUENCY (Hz)FIG. 5. Vibration velocity spectrum: pink noise excitation signal ( f< 30 Hz) and the resulting vibration as measured on the vibrator table.
dB for high frequencies. The in uence of the subjects body weight on the attenuation properties of the beds was found to be negligible. Horizontal vibrations were ampli ed rather than attenuated by the different beds (see Fig. 7). The four pillows had very similar attenuation properties, except for pillow No. l (feather- lled) that showed 10 dB less attenu-ation in the frequency range 10 20 Hz (see Fig. 8 for pillows Nos. 1 and 2). It should be pointed out that the subjects were lying on their backs during the vibration measurements, and thus it cannot be excluded that different body positions can in uence the transmission of the vibrations to the body. B. Experiments 1 and 2
The probabilities of immediate reactions, together with reaction times and subjective estimates of sleep disturbance,
20 |! 10 -B 3 d Lu
%
o _
': Z (D .. 4 E .10 . '20 l l l l I | I l l 1 10 100 FREQUENCY(Hz)are shown in Table I for the rst experiment. All probabili-ties are corrected for spontaneously occurring reactions. It is obvious from the data that two subjects were greatly dis-turbed by the vibrations, both objectively and subjectively. They also performed more poorly in the reaction time test. One subject (CJ ) showed only an increased number of changes toward lighter sleep. This subject only complained of irritability during the next day. For the group as a whole, it can be concluded that immediate reactions were induced by the vibrations.
In the second experiment, no effects on sleep-stage
changes were found. Short EEG reactions were rare and therefore not analyzed separately. The results of experi-ments 1 and 2 are compared in Table II.
C. Experiment 3
1. Arousal reactions
In order to study body movements in more detail than in the former two experiments, a case-control study with two matched controls was performed as described earlier by Eberhardt:7 The occurrence of the peak of a vibration stimu
lus during different 15-s test intervals before (45 30 s, 30 1 5
s, 15 0 s, or O 15 s) the start of the body movement was compared to the occurrence during one or two control
inter-vals, 15 30 s and 30 45 5, after the start of the movement. An
increased probability of occurrence is expressed in the rela-tive risk of an occurrence, as compared to a random distribu-tion of vibradistribu-tions around the body movement. Table III shows the results for the test periods 15 0 s before the start of the movement and 0 15 s after. (A Vibration with its peak during this period could already start before the start of the body movement.) Vibrations during the other test intervals could not be statistically connected to the following body movement. From the table, it is clear that it was mainly dur-ing sleep stage 2 that body movements were elicited by the vibrations. The probability that a vibration induces a body movement was 8.5% and 15.7% for V10W and Vhigh, respec-tively. 20 10 '
E
-3%
: O ' ': Z o _ < E 10 " "20 j I I 1 T I l l l 1 10 100 FREQUENCY(Hz)FIG. 6. Transfer function between excitation signal in a vertical (left) and horizontal (right) direction and the resulting acceleration of the vibrator table.
20 '; o-3 u.! O = _ : Z g 20 = - -1 '40 l l Til ! I II] 1 10 100 FREQUENCY(Hz) 20
';
3 -u.| D : 0 . ': Z <9 . < s '20 | | l I | | | | | 1 10 100 FREQUENCY(Hz)FIG. 7. Typical transfer function between vertical (left) and horizontal (right) vibrations measured on the table and in the bed between the shoulder blades (see text) for bed No. 1, pillow No. 1, and subject No. 2 (69 kg).
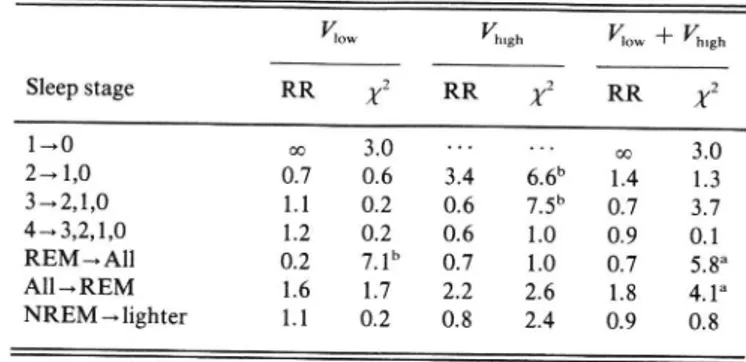
The occurrence of changes toward lighter sleep, induced
by vibrations, was studied with the same method of analysis as that used for the body movements. The occurrence of a vibration during a 30-s-long test period preceding the sleep stage changes was compared to an equally long period fol-lowing the change (see Table IV). The low vibration level did not induce changes toward lighter sleep. The high vibra-tion level induced changes toward lighter sleep from stage 2 only (RR = 3.4, X2 = 6.6,p = 0.01 ). The low value for RR (relative risk) for stage 3 seems to indicate that the probabil-ity of stage 3 after a vibration is increased rather than re-duced. Since the data for each sleep stage are rather poor, the
20 4 GO-0 Lu O D _
:
Z920
=""
-40 FREQUENCY (Hz)FIG. 8. Transfer function between vertical vibrations of the table and the head of subject No. 2 for , pillow No. 1 and , pillow No. 2 (bed No. 1 ).
1490 J. Acoust. Soc. Arn,, Vol. 88, No. 3, September 1990
combination of V10W and Vhigh was also investigated. The data suggest that the stimuli can induce sleep stage changes toward REM sleep (RR > 1, p < 0.05), whereas sleep stage changes from REM sleep occurred with a lower frequency than expected from the frequency of spontaneous reactions
(RR<1,p<0.05).
The total number of sleep stage changes (spontaneous plus stimulus-induced) per night increased for four of the ve subjects when exposed to the stimuli. For the group as a
whole, this increase (from 55 to 67) was significant for
expo-sure V10W (Mann Whitney, p = 0.02) (see Fig. 9). 2. Sleep stages
Of all duration and barycenter parameters7 studied, the amount of REM sleep only, both absolute and in terms of percentage of total sleep time, was in uenced by the vibra-tion condivibra-tions (F = 5.6, p = 0.01) (see Table V). Large
TABLE I. Results for experiment 1. Probabilities of different types of reac-tions for the four subjects. , much disturbed; , disturbed; and 0, not disturbed. Reaction time after control nights in parentheses.
Body Short EEG Sleep stage Subj. Reaction movement reaction change sleep time Daily Subject ( % ) ( % ) ( % ) quality (s) work
GH 6.0C 2.5 4.00 1.2(l.0) MS 11.8b 7.4b 18.4C 1.3(1.1) ME 1.7 1.7 2.8 0 l.3(l.3) 0/ CJ 3.4 0.7 7.0 0 l.2(1.2) Total 5.1C 2.3b 6.7C ap < 0.05. bp < 0.01. Cp < 0.005.
TABLE II. Comparison between experiments 1 and 2.
Probability in % of a reaction for Type of
reaction Vibrations Noise Noise + vibrations Body movements +
short EEG reactions 7.4a 3.5b 8.5C Sleep stage changes 6.7"?l 0.1 3.5 ap<0.001.
bp = 0.03.
°p<0.002.
interindividual differences in the amount of REM sleep were
found (F = 12.1,p ( 0.0001 ). For Vlow, the amount ofREM
sleep decreased with 22 min and 5% units and for condition
Vhigh , the decrease was 24 min and 7% units (see Fig. 9).
Linear regression analysis was applied for the different nights for each experimental condition. Because of the limit-ed material and the large interindividual differences, no trends with time could be discerned.
3. Morning questionnaire andperformance test The statistical test for each subject taken separately re-vealed (p ( 0.05) that after nights under condition Vlow , one subject (HL) felt tired and one subject (PW) felt that he had slept worse than normally. For the group as a whole, these two parameters showed signi cant effects (p < 0.05). Dur-ing condition Vhigh , the subjects stated (subjects pooled) that they had experienced dif culty in falling asleep (p = 0.006), had slept poorly, and worse than at home, were tired, had difficulty returning to sleep after awakening, and had difficulties at work the next day (0.01 (p ( 0.05 ) . Three subjects (KH, PW, and EA) showed significant effects for at least one question. One of these (PW) showed significant effects for ve of the questions. A combination of the differ-ent questions into a total subjective sleep quality score for the three conditions is shown in Fig. 9.
TABLE III. The relative risk (RR) and associated XZ-value for the peak of a vibration to fall within the test intervals 15 0 3 or 0 1 5 s as compared to two control intervals 15 30 s and 30 45 s after the start of a body
move-ment. I/low Vhigh 15 0 0 15 15-0 0 15 Sleep stage RR X2 RR )(2 RR XZ RR X2 1 3.5 4.6a 2.5 2.0 3.0 3.2 0.5 0.4 2 3.5 33.4C 2.7 19.0C 5.4 90.7C 3.9 49.5C 3 + 4 2.0 0.8 0.7 0.1 2.0 1.3 1.2 0.1 REM 1.0 0.0 1.7 3.4 1.7 3.9 1.5 2.0 All 2.5 28.9C 2.2 21.6C 3.6 86.1C 2.6 39.4C ap(0.05. bp(0.01. cp(0.001.
1491 J. Acoust. Soc. Am., Vol. 88, No. 3, September 1990
TABLE IV. The relative risk (RR) for the peak of a vibration to occur w1thin a test interval 30 0 s prior to a change toward lighter sleep as com-pared to a control interval 0 30 s after the change.
I/Iow Vhigh View + Vhigh
Sleep stage RR 12 RR % RR )(2
1 +0 00 3.0 " ' "' 00 3.0
2 + 1,0 0.7 0.6 3.4 6.6b 1.4 1.3
3 >2,1,0 1.1 0.2 0.6 7.5b 0.7 3.7
4 -»3,2,1,0 1.2 0.2 0.6 1.0 0.9 0.1
REM »All 0.2 7.1b 0.7 1.0 0.7 5.8a
All »REM 1.6 1.7 2.2 2.6 1.8 4.1a
NREM lighter 1.1 0.2 0.8 2.4 0.9 0.8
ap ( 0.05. bp ( 0.01.
Analysis of variance revealed a large between-subject variability for the different performance parameters (p < 0.0001). The only parameter in uenced by the expo sure condition was the number of unobserved patterns (F = 15.2, p ( 0.001 ). In addition, the different subjects do not react in the same way to a change in noise condition
(F = 28, p ( 0.0001). As shown in Table VI, only two
sub-jects were found to be less alert.
III. DISCUSSION AND CONCLUSIONS
From the rst two experiments (see Table II), it can be
concluded that when road traffic noice is accompanied by
200-.; U| O 100 -RE LA TI VE C H A N G E (% ) 50-vlow C Vhigh EXPOSURE
FIG. 9. The relative change for the two vibration exposure conditions as compared to the control condition for: , the amount of REM sleep; ---, an index for the subjective sleep quality; and , the total number of sleep stage changes per night.
TABLE V. The duration of REM sleep in percent oftotal sleeping time (s.d. in parentheses) for each individual for experiment 3.
Experimental condition
Subject Control Vlow Vhlgh
KH 19(6) 15(6) 9(2) PW 33(5) 22(2) l3(4) EA 13(4) 11(5) 15(4) SJ 31(6) 24(8) 29(6) HL 22(2) 20(4) 19(4) Mean 23.4 18.4 16.6
vibrations, arousal reactions occur more often than is the case when noise alone occurs. Table II also indicates that vibrations without noise cause sleep stage changes more of ten than when the vibrations are accompanied by the noise of the trucks. The question of whether this is an effect of an increased habituation to the experimental situation or an effect of the vibrations being perceived as more threatening (and thereby more disturbing) when they are not accompa-nied by a noise that makes identi cation possible cannot be answered within the present design. From studies on the in uence of noise on sleep, it is known that the information content of the noise stimuli is of importance for the
awaken-ing frequency. 17 19 The frequency of noise-induced changes
toward lighter sleep, as found in experiment 1, is comparable to the frequency reported by Eberhardt et al. in a recentstudy20 using road traffic noise with Lp max = 45 dB(A),
whereas the frequencies found in experiments 2 and 3 are much lower. Part of the difference might be explained by the difference in the number of stimuli per night (150 vs 50), since it has been found15 that the probability of a noise event inducing a reaction decreases with an increased number of stimuli per night.The probability of vibrations inducing a body move-ment during condition V10W in experimove-ment 3 is comparable to that of experiments 1 and 2. In contrast to experiment 1, however, no changes toward lighter sleep were induced by the vibrations. As shown in Table IV for the combination of V10W + Vhlgh, transitions to REM sleep are induced by the vibration stimuli (RR = 1.8), and at the same time, transi-tion from REM sleep seems to be hindered by the stimuli
TABLE VI. Number of unobserved dot patterns [mean (s.d.)] for each subject in experiment 3.
Exposure condition
Subject Control Vlow Vhlgh
KH 6.7(3.2) 4.3(3.0) 28.3(3.1) PW O.2(O.4) O.3(O.6) O.5(O.7)
EA 0 0 0
S J O.3(O.6) 2.0(0) 0
HL 0 0 0
1492 J. Acoust. Soc. Am., Vol. 88, No. 3, September 1990
(RR < 1 ). Similar effects have been observed in other
inves-tigations.7 2"22 However, the effect observed for the
whole-night sleeping pattern is a reduction of the total amount of REM sleep, followed by tiredness in the morning. Despite possible habituation effects during the experimental series, an increase of the vibration level during the third experiment week caused a larger reduction of the amount of REM sleep, an estimated lower sleep quality and negative effects on test performance and daily work.The results of the present experiments imply that vibra-tions caused by road traf c have synergetic effects on the tra ic noise-induced sleep disturbances. It is thus advisable to take this source of exposure into account in future eld studies.
In order to be able to compare the vibration levels used in the present experiments with recommendations for whole-body vibrations as published in ISO-standard 2631,1 the peak vibration levels have to be converted to frequency-weighted whole night rms values. The ISO recommenda-tions are based on the negative effects of continuous
whole-body vibrations on comfort, performance, and health. When
the comfort criterium is used for an 8-h exposure time for vibrations of 12 Hz (the dominant frequency of the traf c
vibrations), rms vibration levels below 0.45 m/s2 and 0.16
m/s2 are recommended for the vertical and horizontal com-ponents, respectively. The corresponding
frequency-weight-ed values are 0.07 and 0.1 m/s, respectively ( see Table VII). In Table VII, the stimulus peak values, frequency weighted
according to ISO 2631, are also given, both measured on the frame of the bed (corresponds to measurements of oor
vi-brations) and measured on the mattress. The whole-night
rms value of the 150 vibration stimuli can be calculated by dividing the peak values by 170. The actual whole-night
vi-bration rms values, as measured on the bedframe and on the mattress (see Table VII), were found to be considerably
higher (in the order of perception threshold) and were com-pletely determined by the residual vibrations of the vibrator table. The discussion above illustrates one of the main prob-lems concerning assessment of transient Vibrations with low
TABLE VII. Comparison between exposure levels and ISO 2631. Vibration level (weighted according to ISO 2631)
Peak value rmsC
(m/SZ) (m/sz)
Exposure verticala horizontalb verticala horizontalb
Frame of bed
Vm
0.03
0.09
0.004
0.02
Vh,gh
0.04
0.13
0.004
0.02
On mattress Vlow 0.008 0.14 0.001 0.03
V.,,gh
0.01 1
0.20
0.001
0.03
ISO 2631 ' ' ' ' ' ' 0.07 0.1
a Direction X according to ISO 2631. b Direction Z according to ISO 2631.
C Residual vibrations of the vibrator table (see text).
repetition rates. It is obvious that some assessment method other than rms values has to be developed. In the present study, vibration stimuli withpeak levels near the ISO recom-mendation for continuous vibrations clearly caused sleep dis-turbances, despite the low average rms value. Similar results have been obtained in studies with low density nocturnal traf c noise:20 The equivalent sound-pressure level was found to be an inadequate descriptor ofthe noise dose. Better results were obtained when the intermittent character of the
noise was taken into account, as expressed in L1, NPL or
TNI 5, emergence from the backgroundzg 24 or the number of
events per night exceeding a certain noise level.7The present investigation, performed on small groups of subjects, was a first pilot study, designed to establish under which conditions sleep might be alfected by trailic vibra-tions. Much larger studies, with varying vibration ampli-tudes and repetition rates, will be needed in order to establish dose response relationships with respect to sleep distur-bances.
ACKNOWLEDGMENTS
This work was supported by grants from the Swedish Environment Protection Board. The hospitality of
Pack-forsk Service AB, where the experiments were carried out, is
gratefully acknowledged. The authors also wish to thank K. Råhs for technical assistance and H. Arnberg for practical medical advice. Without the help of N. Nolin, B. Bengtsson, and S. Dellringer, who served as experimental leaders, this study would not have been possible.
IISO 2631, Evaluation of human exposure to whole body vibration General requirements (International Organization for Standardization, Switzerland, 1985).
2M. Vallet, La perturbation du sommeil par le bruit. Evaluation des effets psychologiques par une experience in situ, Ph.D thesis, Lyon, France (1979).
1493 J. Acoust. Soc. Am., Vol. 88, No. 3, September 1990
3M. Vallet and J. M. Gagneux, in Noise as a Public Health Problem. Pro-ceedings ofthe Third International Congress, Freiburg 1978, edited by J. V. Tobias, G. Jansen, and W. D. Ward (American Speech-Language-Hear-ing Association, Rockville, MD, 1980), pp. 391 396.
4A. A. Jurriéns, in Sleep 1980. Fifth European Congress on Sleep Research, Amsterdam 1980, edited by W. P. Koella (Karger, Basel, 1981 ), pp. 217 220.
5M. Vallet, J. M. Gagneux, V. Blachet, B. Faire, and G. Labiale, J. Sound Vib. 90, 173 191 (1983).
6R. T. Wilkinson and K. B. Campbell, J. Acoust. Soc. Am. 75, 468 475 (1984).
7J. L. Eberhardt and K. R. Akselsson, J. Sound Vib. 114, 417 434 (1986). 8B. Griefahn and E. Gros, J. Sound Vib. 105, 373 383 (1986).
9D. C. Stevenson and N. R. McKellar, J. Acoust. Soc. Am. 85, 768 771 (1989).
F. D. Sando and V. Batty, Road tra ic and environment, Central Sta-tistical O ice Social Trends No. 5 (1974).
llJ. S. Lukas, M. E. Dobbs, and K. D. Kryter, NASA Rep. CR-1780, 1 68 (1971 ).
12J. S. Lukas, D. J. Peeler, and J. E. Davis, NASA Rep. CR 132564, 1 31 (1975).
l3A. Muzet, L. D. Weber, C. Amoros, J. Ehrhart, J. P. Libert, and C. Tsa-kona, in Noise as a Public Health Problem. Proceedings ofthe Fourth Inter-national Congress, Turin 1983, edited by G. Rossi (Centro Ricerche e Studi Amplifon, 1983), pp. 985 993.
I4O. S. Miettinen, Biometrics 24, 339 352 (1968).
'5B. Griefahn, G. Jansen, and W. Klosterkötter, Berichte Umweltbunde-samt 4, 1 251 (1976).
l"A Manual ofStandardized Terminology, Techniques and Scoring System for Sleep Stages of Human Subjects, edited by A. Rechtscha 'en and A. Kales (U.S. Government Printing Ollice, Washington, DC, 1968), Na tional Institute of Health Publication 204.
I7W. P. Wilson and W. W. K. Zung, Arch. Gen. Psych. 15, 523 528 (1966). 18J. Oswald, A. M. Taylor, and M. Treisman, Brain 83, 440 453 (1960). lgW. W. K. Zung and W. P. Wilson, Arch. Gen. Psych. 4, 40 44 (1961 ). 20J. L. Eberhardt, L.-O. Stråle, and M. H. Berlin, J. Sound Vib. 116, 445
464 (1987).
2'R. T. Wilkinson and S. Allison, in Noise as a Public Health Problem. Pro-ceedings of the Fourth International Congress, Turin 1983, edited by G. Rossi (Centro Ricerche e Studi Amplifon, Milano, 1983), pp. 957 963. 22W. Ehrenstein and W. Miiller-Limmroth, in Noise as a Public Health
Problem. Proceedings ofthe Third International Congress, Freiburg 1978, edited by J. V. Tobias, G. Jansen and W. D. Ward (American Speech-Language-Hearing Association, Rockville, MD, 1980), pp. 433 441. 23M. Vernet, J. Sound Vib. 66, 483 492 (1979).
24M. Vernet, J. Sound Vib. 87, 331 335 (1983).
![TABLE VI. Number of unobserved dot patterns [mean (s.d.)] for each subject in experiment 3.](https://thumb-eu.123doks.com/thumbv2/5dokorg/4449134.107985/9.892.466.836.844.1070/table-vi-number-unobserved-patterns-mean-subject-experiment.webp)
