Production Accuracy in L2 English
Checked Vowels:
Cross-sectional Study of Czech Secondary and
Post-Secondary School Students
Petra Havlíková
English III – Linguistics Option (EN113L) Bachelor
15 ECTS
Spring Semester 2020
Table of Contents
Abstract 1 Introduction ...4 1.1 Aim ...5 2 Background ...5 2.1 Acquisition of L2 Pronunciation ...62.2 Vowel Inventories of Czech and English (SSBE) ...7
2.3 Hypotheses for Czech pronunciation ...8
2.4 Vowel Frequencies ...9
2.5 Previous works ... 11
3 Design of the Study ... 13
3.1 Material... 13
3.2 Participants ... 13
3.3 Procedure ... 14
3.4 Analysis ... 14
4 Results ... 16
4.1 Vowel Qualities Data ... 16
5 Discussion ... 21 6 Concluding Remarks ... 24 6.1 Conclusion ... 24 6.2 Limitations ... 24 References Appendix I-VII
Abstract
In Czechia, teaching L2 English pronunciation is underestimated, which might lead to potential production slips and affect the intelligibility of the learners. This study investigates accuracy in L2 English pronunciation of checked vowels (/ʌ, ɛ, ɪ, ɒ, ʊ, æ/) as produced by Czech students. I applied cross-sectional approach and analysed participants from two distinct school classes who are divided by an 8-year study period. The pronunciation accuracy is analysed with the help of the computer program Praat, which generates frequencies for both Czech and English vowel phonemes produced by the participants reading out loud a set of monosyllabic citation words. The formant frequencies are later compared to a reference set of SSBE frequency values, which represents the targeted native language model. The results of this work show that the L2 English values are influenced by the students’ inventories of L1 Czech, leading to inaccuracy in production of the phonemes /ʌ, ɛ, ɪ, ɒ, ʊ/ and setting constraints to the L2 /æ/ acquisition.
1 Introduction
The focus of this study is pronunciation accuracy of L1 (first language) Czech secondary and post-secondary school learners of English as a second language (L2) at two production stages. The first production stage is the first year of secondary school (Class 1, 11-12 years old students) that is compared to the last year of post-secondary school (Class 2, 18-19 years old students). The participants of these two classes are the two representative subsets of this study, hence the cross-sectional approach to analysis applies. This study focuses on the production of vowel phonemes of a short production length, termed checked vowel phonemes by Collins and Mees (2013, p. 71). In this work, the monophthongs are introduced in
monosyllabic words, where the mispronunciation is more prominent in the central vowel phonemes (Khan et al., 2017, p. 56). Since the English vowel inventory is richer in comparison to standard Czech, production slips are expected to occur. According to
Šimáčková and Podlipský (2018), yet another constraint for Czech EFL (English as a foreign language) learners in terms of pronunciation acquisition is the absence of daily exposure to authentic L1 English (p. 170).
Pronunciation accuracy and vowel recognition is here analysed by considering vowel quality of the depicted phonemes. According to Ladefoged and Johnson (2011), quality of vowel phonemes is determined by frequency components called formants (p. 7). To identify the quality of a vowel, two lowest formants are used. In phonetics, the two lowest formants are known under abbreviation F1, which is the lowest frequency formant, and F2, the second lowest frequency formant.
According to Cruttenden (2014), L2 learners of English have for many years been introduced to native speaker targets, which typically is General British accent for the majority of European schools (p. 326). Formant frequencies and the quality of checked vowels of English were analysed in the research of Deterding (1990). Deterding’s frequency values for monophthong vowels in SSBE (Standard Southern British English) citations serve as the native L1 English reference set in this study. Comparing the vowel frequencies of the participants’ L1 Czech and L2 English as opposed to frequencies of the targeted model (Standard Southern British English) enables the examination of specific pronunciation patterns characteristic for Czech speakers of L2 English. The underlying theory behind L2 acquisition is described by Kuhl (2000) who claims that the ‘Native Language Magnet Model’ results in any L2 acquired phonemes being attracted to already established L1 categories in the speaker’s mind (p. 11854). Czech speakers of L2 English then activate a
‘filter’ for the acquisition of L2 phonemes, which leads to placing foreign language phonemes into already established categories, as labelled by Kuhl (2000), ‘maps’. Subsequently, by depicting the formant frequencies F1 and F2 of Czech and English monophthong vowels, thus vowel qualities of distinct phonemes, this work acknowledges the differences between the participants of the two distinct age groups, while considering Kuhl’s perspective on the L2 acquisition.
1.1 Aim
The aim of this study is to analyse developments in the production of checked vowels in L2 English by L1 Czech students and their deviation from SSBE measurements at the beginning and end of an 8-year study period. While using my own data to determine formant
measurements with the focus on F1 and F2, this work will identify the most common deviated slips by the students. Furthermore, this work will answer the following research questions:
1) To what extend do Czech students of EFL improve production of the studied checked vowels in L2 English within an 8-year study period?
2) In which of the depicted checked vowel phonemes did students make the most production slips?
3) As based on the data, how does L1 Czech affect the results in L2 English measurements?
The goal is then to identify the problematic phonemes in terms of pronunciation accuracy and to determine whether the production slips were eliminated for the older age group. Czech and English have different vowel inventories and this study focuses on where the checked vowel phonemes are most distant from the L2 target, hence these are the vowel phonemes that are most likely to be mispronounced according to the ‘Native Language Magnet Model’ theory as utilised by Kuhl (2000). Finally, determining the most frequent production slips in checked vowels may improve EFL pronunciation teaching in Czech secondary and post-secondary schools by setting a clear set of phonemes difficult to pronounce by Czech learners of English.
2 Background
In this section, I will introduce the key concepts of second language pronunciation acquisition with the focus on the targeted English accent SSBE based on the studies of Deterding (1990, 1997). Further, in this section will be presented differences between vowel inventories of Czech and English and hypotheses for the Czech pronunciation of L2 English checked vowels
as formerly researched by Šimáčková and Podlipský (2018). The hypotheses for Czech pronunciation are considered in relation to Kuhl’s research (2000), following her Native Language Magnet hypothesis. The next section introduces vowel frequencies along with formant measurements in computer program Praat. Finally, section on previous studies relevant to this research will be introduced.
2.1 Acquisition of L2 Pronunciation
While L2 English acquisition is part of Czech learners’ education beginning from their 3rd grade of elementary school, there are higher number of classes per week in the two later educational stages, at secondary and post-secondary schools. The two selected groups in this study are from the latter two educational stages, divided by 8 years of studies.
Acquiring the speech sounds in targeted L2 requires both perception and production, thus learners’ listening and speaking skills. Teaching pronunciation of English as an L2 has been widely affected by the increasing use of English as an international language. In
Czechia, however, the use of L2 in relation to L1 is very low, so the teaching takes place ‘in a pervasive L1 environment’ (Šimáčková & Podlipský, 2018, p. 170). The implicit assumption is that ‘the standard will be set by the teacher doing the teaching’ (Cruttenden, 2014, p. 325). Czech teachers, just as teachers from other European countries, usually opt for ‘the model of GB [General British] formerly known as RP (Received Pronunciation)’ (Cruttenden, 2014, p. 327). The prestigious ‘Received Pronunciation’ accent, however, is frequently labelled as Southern British Standard (Wells, 1982, p. 117). While teaching L2 English, it is assumed that the learners will pick up the teacher’s pronunciation (Cruttenden, 2014, p. 325). Learners’ reception skills, however, are frequently influenced by external factors to teaching, such as media or games. Extensive use of English as an international language supported by the trend of teachers prioritising grammar over pronunciation creates a large gap between the students who are ‘coming sometimes near to, and sometimes far away from’ the targeted model of pronunciation (Cruttenden, 2014, p. 325). For the purposes of this study, comparison is made between Czech and SSBE (Standard Southern British English), a sub-variety of GB
previously utilised and recommended as a model for further studies by Deterding (1997, p. 54).
Once the targeted model of GB is set by the teacher, the learners aim to have at their disposal 20 vowel phonemes (12 monophthongs and 8 diphthongs). This study examines the pronunciation accuracy of short vowel series including checked vowel phonemes, labelled by Cruttenden (2014) as problematic group in terms of L2 English pronunciation (p. 347).
2.2 Vowel Inventories of Czech and English (SSBE)
Vowel inventories of Czech and English differ both in terms of quantity and diversity of phonological features. This cross-language comparison considers vowel inventories of
standard Czech and SSBE, while considering the vowel quality and categorisation of checked vowels.
Vowel sounds of Czech and English are distinguished in two levels of production time length. In terms of pronunciation, checked vowels are always shorter in production than steady-state vowels and diphthongs (Collins & Mees, 2013, p. 71). The Czech vowel system consists of ten monophthongs, namely checked vowels /a, ɛ, ɪ, o, u/ with their corresponding steady-state /aː, ɛː, iː, oː, uː/ vowels accompanied by three diphthongs /au, eu, ou/ (Bičan, 2010, p. 31). SSBE is richer in terms of vowel inventories, with nineteen vowel sounds (Wells, 1982, p. 119). Those can be divided into six checked vowels /ʌ, ɛ, ɪ, ɒ, ʊ, æ/
accompanied by five steady-state vowels /iː, aː, ɔː, uː, ɜː/ and eight (steady-state) diphthongs /eɪ, aɪ, əʊ, aʊ, ɔɪ, ɪə, ɛə, and ʊə/ (Wells, 1982, p. 119). While Czech checked vowels may occur in open syllables, the RP vowels except for /ɪ/ and /ʊ/ are always surrounded by a final consonant, for the purpose of ‘checking the pulse of air for the syllable and its vowel’ (Wells, 1982, p. 119).
The vowel systems of SSBE (see Figure 1) and standard Czech (see Figure 2) use the categories of vowel height and backness. Vowel height distinguishes between close (high), mid and open (low) vowels, with the tongue positioned close to the palate, midway, or far from the palate, respectively (Collins & Mees, 2013, p. 63). Vowel backness distinguishes vowel sounds in terms of position of the highest part of the tongue to the back of the oral cavity, establishing the categories of front (highest point of the tongue is in the front of the mouth), central and back (highest point of the tongue is in the back of the mouth) vowels (Collins & Mees, 2013, p. 63). The distribution of vowels and their categories can be comprehensively displayed on vowel diagrams, see Figure 1 for English and Figure 2 for Czech vowel diagram.
Figure 1. English vowel diagram with the distribution of English phonemes ([Legend of the
diagram edited by me], Ladefoged & Johnson, 2011, p. 44).
Figure 2. Czech vowel diagram with the distribution of Czech phonemes ([Legend of the
diagram edited by me], “Sound patterns of Czech”, 2020).
2.3 Hypotheses for Czech pronunciation
In Czechia, the students start taking English classes in the 3rd grade of elementary school, when the process of L2 English acquisition begins. Participants in this study are students of secondary and post-secondary school, when it is rare for the learner to acquire a native-like phonology of the L2 English (Šimáčková & Podlipský, 2018, p. 173). The sound patterns of L1 learners are fairly developed at their age, causing a direct influence of Czech on English (Baker & Trofimovich, 2005, p. 3).
The Native Language Magnet suggests that L1 learners create ‘maps’ of phonetic categories of their first language in their minds (Kuhl, 2000, p. 11850). These established categories are active in the process of acquiring L2 sound patterns. In the learning process of L2 English, Czech speakers may face difficulties since the unknown sound patterns are attracted to already existing L1 categories, which leads to deviation from the L2 targeted pronunciation (Flege, 1995, p. 235). In this work, the newly acquired L2 English vowel
phoneme will then be /æ/, while the rest of the phonemes are considered as having a clear set of Czech corresponding counterparts; English /ʌ, ɛ, ɪ, ɒ, ʊ/ and their respective Czech /a, ɛ, ɪ, o, u/ phonemes.
The low and front /æ/ is phonetically longer than the other checked vowels (Wells, 1982, p. 129). As based on the Native Language Magnet hypothesis, as a phoneme that is absent in the Czech vowel inventory, /æ/ it is the most likely to be assimilated with another vowel (Šimáčková & Podlipský, 2018, p. 176). There are two theories which may apply to the vowel formants of the measured /æ/ values (2018, p. 176). Firstly, according to Šimáčková and Podlipský, /ɛ/ appears in the mid front region and assimilation of ‘/æ/ and /ɛ/ to the spectrally overlapping Czech /ɛ/ can be predicted’ (p. 176). Secondly, the reference values of SSEB suggest that in terms of F1 (height), ‘English /æ/ is closer to the Czech /a/, whereas in terms of F2 (backness) it is between Czech /ɛ/ and /a/’ (Šimáčková & Podlipský, 2018, p. 176). The targeted vowel /æ/ will then for the L2 English learner either be closer to the L1 Czech vowel /a/ or /ɛ/, but is unlikely to be pronounced as an open front /æ/ (Šimáčková & Podlipský, 2018, p. 176).
Regarding the pronunciation accuracy of the vowel phonemes /ɪ/ and /ʊ/ examined in this work, more assumptions for Czech learners were suggested by the earlier research of Šimáčková & Podlipský (2018, p. 176). The English phoneme /ɪ/ is more front than the Czech /ɪ/. Therefore, in terms of the quality of L2 pronunciation, the L2 English /ɪ/ is assumed to be of higher backness in the Czech speakers’ production. The English /ʊ/ ‘has undergone fronting’, thus, it is expected that the L2 learners will pronounce the English /ʊ/ closer to the Czech back /u/ (Šimáčková & Podlipský, 2018, p. 176).
Following the Native Language Magnet hypothesis (Kuhl, 2000, p. 11856), the rest of the L2 phonemes /ʌ, ɛ, ɒ/ will most likely be attracted by the L1 locations of their respective counterparts. English /ʌ/ and Czech /a/ are phonetically similar in backness, but not in height. The auditory quality of English /ʌ/ is characteristically more close than the Czech /a/;
therefore, it is expected that the L2 English production of /ʌ/ by Czech speakers will be more open than the SSBE targeted model suggests. The Czech vowel phonemes /ɛ/ and /o/ are more close and more front than English /ɛ/ and /ɒ/, which might create a similar attraction towards the L1 positions by the learners.
2.4 Vowel Frequencies
The production of vowel sounds is a complex process which involves air pressure streaming from the lungs to the larynx, where the sounds are produced due to ‘resonating chambers of
the pharynx, the mouth and, in some cases, the nasal cavities’ (Cruttenden, 2014, p. 19). This is called ‘voiced egressive airstream’ and results in the production of vowel sounds that can be distinguished in vowel quality (Cruttenden, 2014, p. 19). Vowel quality determines and identifies the uttered vowel sounds, while distinguishing one from another (Collins & Mees, 2013, p. 67). A single vowel sound contains various pitches where one is the spoken pitch and the others can be labelled as ‘overtone pitches’ which determine the vowel quality (Ladefoged & Johnson, 2011, p. 211). The qualities of L1 Czech and L2 English vowels as produced by the participants are determined and examined in this study.
Different vowel qualities have a ‘range of frequencies of varying intensity’, known as the acoustic spectrum, the energy bands are then called the sound’s formants (Cruttenden, 2014, p. 20). Although ‘the lowest three formants distinguish vowels from each other’
(Ladefoged & Johnson, 2011, p. 212), to recognise vowel quality of a sound, it is sufficient to determine the first and second formant frequencies (Cruttenden, 2014, p. 21). The first and second lowest overtones are labelled as F1 (the first formant) and F2 (the second formant) and they are normally specified in Hz (Ladefoged & Johnson, 2011, p. 188). While F1 is
‘inversely related to vowel height’, the F2 is related to both vowel height and the level of lip rounding (Ladefoged & Johnson, 2011, p. 188). The pitch of F1 is gradually raising for the vowels [ɪ, ɛ, æ] and gradually falling in the sequence of [ʌ, ɒ, ʊ], while the F2 pitch then goes down in the vowel sequence [ɪ, ɛ, æ] (Ladefoged & Johnson, 2011, p. 188). This study
analyses sound production in speech recordings, hence relying on the inventories of acoustic phonetics.
For the purposes of acoustic phonetics, various computer programs have been designed to display and analyse audio recordings on a spectrogram (Ladefoged & Johnson, 2011, p. 194). An example of such program is Praat, a free software package for speech analysis. In Praat, the time on a display called spectrogram is running from left to right, while frequencies of the sound components are shown on the left vertical axis (Ladefoged &
Johnson, 2011, p. 194). The intensity of darkness shown on the display represents variable intensity of speech components (Ladefoged & Johnson, 2011, p. 195). The dark bands then show ‘concentrations of energy at particular frequencies’ (Ladefoged & Johnson, 2011, p. 194). Figure 3 shows the spectrogram of a male speaker from Class 2 and where to search for F1 and F2 frequency belts in a Praat spectrogram. The vowels exhibit higher frequency amplitudes (vertical lines) than the consonants, enabling an easier recognition for the
Figure 3 then display production of /ɛ/, while the lower amplitudes at the beginning and end of the spectrogram field show consonant phonemes /h/ and /d/, respectively.
Figure 3. Example of a spectrogram in Praat software showing the audio recording of the
word ‘head’ and the belts of first formant frequency F1 and second formant frequency F2. Measured formant values are individual and the frequencies vary from speaker to speaker (Ladefoged & Johnson, 2011, p. 195). Although the absolute formant values differ from speaker to speaker, the auditory quality presented on the vowel diagram will be similar for speakers of the same language (Ladefoged & Johnson, 2011, p. 212). Huber et al. (1999) pointed out certain factors influencing the first and second formant values, within which the most outstanding are the age and sex of the speakers (p. 1532). Firstly, the formant frequency decreases with age due to growing size and shaping of speakers’ vocal tracts (Huber et al., 1999, p. 1537). Secondly, female speakers tend to have higher frequency range in low vowels for F1 and for all vowels in F2 measurements (Huber et al., 1999, p. 1532). For the speakers below 15 years of age, different sex of the speakers does not significantly affect the vowel measurements (Huber et al., 1999, p. 1533). Thus, greater differences in the formant measurements are to be expected for speakers in the younger ages and for women and vice versa (Huber et al., 1999, p. 1532).
2.5 Previous works
For the purpose of this study, theories and methods were used as previously applied in the research of Deterding (1990, 1997), Šimáčková and Podlipský (2018) and Kuhl (2000).
In both Deterding’s studies, the F1 and F2 formants for all SSBE vowels were analysed. In his Ph.D. thesis Speaker Normalization for Automatic Speech Recognition,
Deterding (1990) analysed vowel formants taken out of speech recordings provided by eight SSBE speakers reading citation words. Deterding (1990, accessed via 1997) used a word list where the words followed the pattern of [hVd] model, as ‘h’ and ‘d’ were one of the
consonants those suggest efficiency in vowel formant measurements (p. 47). In his later work, Deterding analysed the same vowels to determine formants of ten SSBE speakers with the aid of the MARSEC database, enabling the measurements of connected speech. Deterding (1997) admits that ‘all the speakers have what might be termed a Standard Southern British accent (similar to RP), though there is inevitably a little variation’ (p. 48). While comparing his earlier measurements of citation speech vowels with those of the connected speech, Deterding (1997) states that the ‘effect of representing the front/back dimension in terms of F1-F2 would be to normalize for speaker differences […] in formant frequencies’ (pp. 49-51). In this study, Deterding’s (1997) citation speech values from 1990 are used as the reference data set (see Appendix 1), as it is considered reliable data for further research purposes (p. 54).
Two distinct studies were used for considering the cross-language interference: Šimáčková and Podlipský (2018) and Kuhl (2000). The first of the two studies focused on Czech speakers of English and their accuracy in vowel production. The research by Šimáčková and Podlipský (2018) provided the theoretical base for the cross-language
phonemic analysis of this study. Šimáčková and Podlipský (2018) researched the accuracy of Czech speakers’ native-like English pronunciation in terms of contrasts in vowel production length, height and backness. The participants in their study are bilingual speakers of Czech and English with earlier or later L2 English acquisition. Their data determines phonological constraints for the L1 Czech participants such as that ‘new vowel height distinctions are not created’, further the participants are ‘reusing L1 length feature to contrast L2 vowels’ and they create ‘L1-L2 phonetic dissimilarity’ within a single vowel category (Šimáčková & Podlipský, 2018, p. 169). Although Šimáčková and Podlipský (2018) state that ‘achieving native-like phonological competence may not be possible [for] learners who acquire L2 in the prevailingly L1 environment’, the speakers have the ‘ability to adjust for phonetic detail of L2 sounds’ (p. 169).
Patricia K. Kuhl (2000) in A New View of Language Acquisition elaborates on the theory that a successful L2 native-like pronunciation is practically unachievable for non-bilingual speakers. In her research, Kuhl (2000) provided a new perspective on the language acquisition by studying the perception skills of infants, while considering ‘the relationship between language and mind’ (p. 11856). Furthermore, Kuhl (2000) proposed a hypothesis called the ‘Native Language Magnet Model’, suggesting that the infants create categories of
their perception by ‘mapping of ambient language’ (p. 11854), as brought up in earlier sections. The language specific filters are formed between 6 and 12 months of age, and, once formed, they ‘make learning a second language much more difficult because the mapping appropriate for one’s primary language is completely different from that required by other languages’ (Kuhl, 2000, p. 11854). Any acquired phonemes after the mentioned age period tend to get attracted to the already established the already mapped auditory qualities. In the late language acquisition process, L1 works like the speaker’s magnet, attracting the L2’s phonemes into the already established map, which leads to the assimilation of L1 and L2 phonetic categories.
3 Design of the Study
In this section, I will introduce the material that was designed and used for the purposes of this study, the recorded participants who are the subjects of the analysis, and the process of the recording procedure. Further, I will describe the analysis of this work.
3.1 Material
The set of recorded monophthongs was designed according to recommendations of both the earlier studies of Viegas et al. (2019), Deterding (1990, 1997) and official Praat guide by Styler (2017). In choosing the words for citation measurement, I avoided monophthongs with nasal neighbouring consonants and those with following velar consonants or /l/. I also avoided monophthongs where vowel follows /j/, /w/ or /r/, as they affect the measurements of the first three vowel formants (Deterding, 1997, p. 49). The set of words was divided into two parts with the focus on the Czech (/a/, /ɛ/, /ɪ/, /o/, /u/) and English (/ʌ/, /ɛ/, /ɪ/, /ɒ/, /ʊ/ and /æ/) monophthong vowels.
3.2 Participants
The two recorded control groups consist of 26 Czech pupils from the same school, within each group are 9 male and 17 female learners of L2 English, see Appendix IV-VII for female (F) participants highlighted in orange and for male (M) participants marked in blue. The two classes represent two different age groups with the following years of birth: 2008-2009 and 2001-2002; their were 11-12 years and 18-19 years respectively. This study analyses two different representative subsets, hence the cross-sectional analysis approach applies. The groups are separated by 8 years of education process to maximise the chances of visible development in English L2 pronunciation.
According to Czech law 110/2019 paragraph § 7, children below 15 years of age need to have parental consent regarding personal data processing. Therefore, parental consent regarding the students of the younger age group was acquired in advance of their participation in the research (see Appendix II). All participants and parents were informed that the data would be treated on an anonymous basis. For the purpose of this study, the younger class is referred to as ‘Class 1’ and the older class as ‘Class 2’.
3.3 Procedure
The 52 subjects (26 from each group) were recorded in a sound-treated room, where they read aloud the two sets of words (Czech and English) with a short pause. The short pause was guaranteed by instructing the participants to take a breath before they were about to read the next word. The set of words was randomised (see Appendix III), meaning each participant was presented different order of the words. Responses were recorded onto Praat while using a high-quality microphone positioned 15 cm from the lips of the participant. When recording, I used the default sampling rate, recommended by Styler (2017), 44 kHz (p. 10). Each
recording was saved as .wav extension file for subsequent analysis.
3.4 Analysis
The secluded formant values for each vowel were analysed with the help of Praat and treated in Hz. The frequencies F1 and F2 were measured from an analysis of speech recordings shown on a spectrogram. The maximum formant frequency was manually set for each
measurement to see all the formants displayed on the spectrogram. For Class 1, the maximum formant was set to 6500Hz, as the younger learners had higher frequencies of the higher formants. Class 2 was treated with the maximum frequency as suggested for adult speakers (Styler, 2017, pp. 22-23), with the maximum formant of 5500Hz for female and 5000Hz for male speakers.
The formant values were determined by clipping the targeted vowel phoneme out from the Praat spectrogram and finding its intermediate portion of 10 milliseconds (see Figure 4). This was applied for both the Czech phonemes (/a/, /ɛ/, /ɪ/, /o/, /u/) and the English phonemes
(/ʌ/, /ɛ/, /ɪ/, /ɒ/, /ʊ/ and /æ/). The two lowest formants of the depicted phonemes were then generated automatically with Praat by using the function ‘Query’ and ‘Log 2’. For further work with the data, Microsoft Excel was used. Since the 11 vowels were represented in two distinct words each and produced by 52 participants, the number of clips for the analysis was 1114. Thus, the analysed collection of data in Microsoft Excel sheets with two distinct vowel
formant values was composed of 2288 parametric values. Certain values were disregarded
Appendix IV - Appendix VII for the deleted values highlighted in red).
The formant values of Class 1 and Class 2 were treated separately. Later, averages of measured frequencies of Class 1 and Class 2 were calculated in Microsoft Excel. The
averages for the first and second formants were established for both the classes and both languages (Czech and English), while considering separate averages for male and female participants counted manually in Excel. The chosen comparison values were the formerly researched values of SSBE citation speech provided by Deterding (1990). The average frequencies of the first and the second vowel formants of all participants were calculated by using the function ‘=AVERAGEA ([…])’. In his research, Deterding (1990) treated his values separately for male and female speakers, so the averages of his values were calculated here. The values from the Excel spreadsheet were later applied as data onto vowel diagrams
corresponding to the vowel chart of recorded classes. To make it comparable to a vowel chart of the speakers, the axes of the graph were defined in reversed order; the horizontal axis represents falling F2 and the vertical axis falling F1 values (both in Hz). For the purpose of the analysis, three distinct graphs were designed to represent the studied vowel qualities. Subsequently, the averages of English vowel frequencies for both classes and Deterding (1990) were plotted with a free software, ‘Vowel Chart’, developed by Adam Baker (2015).
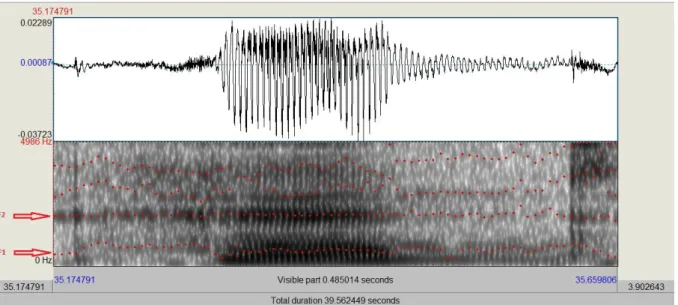
Figure 4. Example of ten milliseconds clipped from a Praat spectrogram for generating F1
4 Results
4.1 Vowel Qualities Data
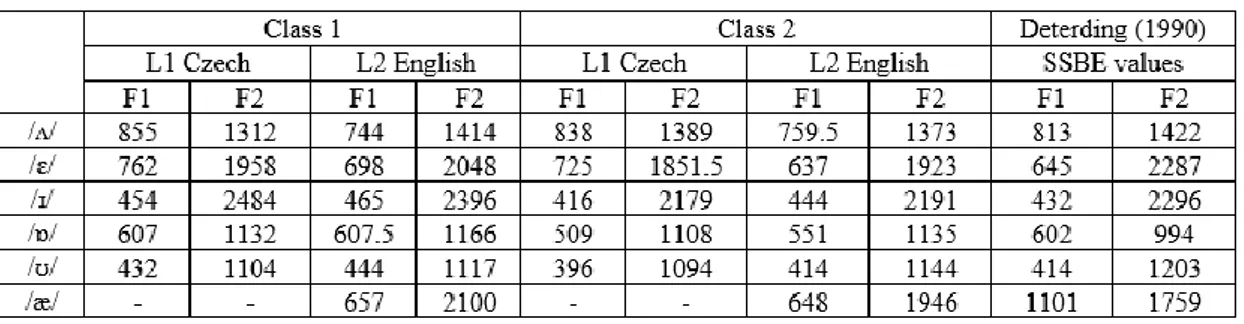
The data selection is composed of three tables (Table 1-3), three graphs (Figure 5-7) and one vowel chart (Figure 8). All the tables present the average formant values of both classes for Czech and English, and they use the Deterding (1990) values for SSBE citation as their reference data set. Table 1 provides the average values of all the participants, Table 2 only of female participants, and Table 3 of male participants. Figure 5 and Figure 6 show the
formants of all the measured phonemes for Class 1 (Graph 1) and Class 2 (Graph 2)
respectively, based on the values of Table 1. These two graphs (Figure 5 and Figure 6) display the respective averages of parametric values for both classes, including both the Czech and English phonemes along with Deterding’s (1990) SSBE values. Figure 7 plots English values of the two classes as compared to Deterding’s (1990) data set. The same graph (Figure 7) is later converted into a vowel chart. Although the differences between the phonemic symbols of Czech and English are considered, the data set presents only one symbol for both the
languages. For a clearer representation, the following tables, graphs and the vowel chart present the phonemes as; /ʌ/ as comparing both the Czech /a/ and the English /ʌ/, /ɛ/ and /ɪ/ remains the same for both the languages, /ɒ/ corresponds to Czech /o/ and English /ɒ/, /ʊ/ for both the English /ʊ/ and Czech /u/, /æ/ is then purely an English phoneme.
The first data output, Table 1, presents the average values for formant frequencies of all the participants for both languages as well as the average values for all participants in Deterding’s (1990) study. As seen in the table, Class 1 has significantly higher frequency values as compared to both Class 2 and the SSBE values (Deterding, 1990). As seen in Table
1, to attempt to achieve native-like pronunciation, the participants shall either raise or lower their L1 values to produce L2 English phoneme in the targeted frequencies. In this analysis,
the participants’ values with ±10 Hz difference from the targeted SSBE frequencies are labelled ‘stable’, hence the increase and decrease for such values was not considered. The pattern for the separate phonemes, if successful, would be: /ʌ/ - lowering in F1 and F2 for Class 1 and increasing in F2 for Class 2, /ɛ/ - lowering in F1 and raising in F2 for both classes, /ɪ/ - lowering for Class 1 but raising in F1 for Class 2, /ɒ/ - falling for Class 1 in F1 and F2, while for Class 2 raising in F1 and lowering in F2, /ʊ/ - lowering for Class 1 in F1 but raising in F2, while for Class 2 raising in both F1 and F2. As seen from the chart, both classes follow the pattern in the production of /ɒ/, while both the classes managed to get closer to the SSBE values (except for Class 1 in F2). Regarding the phoneme /ɪ/, neither of the two classes
managed to produce values closer to targeted model in L2 English. While Class 1 managed to produce lower frequencies for the English citations of /ʌ/, the values of Class 2 were closer in their L1 Czech measurements of /a/, while the learners distanced from the SSBE values in L2 English, as demonstrated by the lower frequency measurements. The F1 frequencies of /ʊ/ for both classes shifted towards the values of SSBE in L2 English /ʊ/.
Table 1. Average frequency values of all participants and SSBE (Deterding, 1990)
Note. Table 1 shows Average L1 Czech and L2 English formant frequency values of /ʌ, ɛ, ɪ, ɒ,
ʊ, æ/ treated in Hz produced by Class 1 and Class 2 and compared to average of all SSBE values (Deterding, 1990).
Table 2 and Table 3 are here treated together, as they present comparison of the average female and male values respectively for both the classes and Deterding’s (1990) data. As seen, majority of the values are higher for female participants rather than male. As stated earlier, female speakers tend to have higher frequency values for all F2 measurements, but also for F1 of the low vowels. The data in Table 2 and Table 3 is a departure from the theory in terms of the Class 1 Czech vowel /u/ where the F2 male formant values are higher than the female values. However, this irregularity does not apply to the English frequency values. Interestingly, the English values of Class 2 male speakers in the phoneme /æ/ are in between the values of /ʌ/ and /ɛ/ in F1, and between values of /ɛ/ and /ɪ/ in F2. On the other hand, the female speakers’ average is significantly closer to their /ɛ/ rather than /ʌ/.
Note. Average female L1 Czech and L2 English formant frequency values of /ʌ, ɛ, ɪ, ɒ, ʊ, æ/
treated in Hz produced by Class 1 and Class 2 and compared to average female SSBE values (Deterding, 1990).
Table 3. Average frequency values of male participants and SSBE (Deterding, 1990)
Note. Average male L1 Czech and L2 English formant frequency values of /ʌ, ɛ, ɪ, ɒ, ʊ, æ/
treated in Hz produced by Class 1 and Class 2 and compared to average male SSBE values (Deterding, 1990).
Figure 5 below shows the graphical representation of Czech and English values of Class 1 participants when opposed to each other, but also provides a comparison of these values to the reference data set (Deterding, 1990). Phonemic values are of different frequencies, while being closer or further from the reference data set. The furthest from the native-like
pronunciation is the front /æ/, that is in proximity to the participants’ L2 English front /ɛ/. The quality of the L2 English /ɛ/ shows a successful shift from the Czech /ɛ/ towards SSBE. In the case of /ʌ/, the participants approached the SSBE model and similar tendency shows the shift from the Czech more front /ɪ/ to English slightly less front /ɪ/, even though not as extensively. Although all three values of Czech /u/, L2 English /ʊ/ and SSBE /ʊ/ are of similar formant frequencies, the speakers seem to attract the L2 /ʊ/ to the established L1 /u/. The same
attraction as for the phonemes /ʊ/ and /u/ then applies to the L2 English /ɒ/, while being close to speakers’ Czech /o/ values.
Figure 5. Vowel quadrilateral of average F1 and F2 values of Class 1 for L1 Czech phonemes
marked in orange, L2 English phonemes in blue and reference SSBE phonemes in red. Figure 6 shows the visual distances of the studied phonemes between the Czech (in orange) and English values (in blue) of Class 2 participants as opposed to each other, but also their comparison to the reference data of SSBE. Figure 6 is generated from the values in Table 1, while showing comparison of L2 English and SSBE values. As seen, the values of Class 2 are of lower frequencies, while being closer to the frequency scale of SSBE in the phonemes /ʊ/ and /ɒ/. Just as Class 1, even Class 2 exhibits attraction of the phoneme /æ/ to /ɛ/. While /æ/ becomes assimilated with the L2 /ɛ/, the latter phoneme shifts significantly from the less front Czech /ɛ/ towards the SSBE’s more front /ɛ/. For Class 2, the formant values of L2 English /ɪ/ are more distant to the reference phoneme than to their values of L1 Czech /ɪ/. In the case of the back phonemes /ʊ/ and /ɒ/, the data shows that participants were closer to SSBE in the pronunciation of L1 phoneme /a/ rather than in their L2 /ʌ/.
Figure 6. Vowel quadrilateral of average F1 and F2 values of Class 2 for L1 Czech phonemes
marked in orange, L2 English phonemes in blue and reference SSBE phonemes in red. Figure 7 plots the frequencies of L2 English pronunciation for both classes and both genders as opposed to SSBE data set. This graph serves as the data outcome showing progress in L2 pronunciation after 8 years of studies. The frequency values for Class 1 are plotted in green, and in yellow are highlighted values of Class 2, SSBE remains marked in red. In terms of backness, F2 frequency belts of Class 1 are higher than those of Class 2. The same can be said for the vowel height, where F1 formants of Class 1 are higher than those of Class 2. Thus, it can be said that the L2 English phonemes of Class 1 are more front and lower than phonemes of Class 2. The vowel closest in pronunciation to SSBE is the high back /ʊ/, where both the classes achieved fair proximity to the targeted pronunciation. When it comes to proximity to SSBE values, visually closest to the targeted model will be the phoneme /ɪ/, while its quality after the 8-year study period moves towards the centre and the phoneme becomes more closed. Figure 7 also plots again the assimilation of /æ/ and /ɛ/ for both the classes. The classes attract /æ/ to their respective L2 English /ɛ/, while both the phonemes become mid-front, unlike in SSBE, where /æ/ is an open front vowel. In terms of F1, Class 1 is surprisingly closer to SSBE F1 values of /ɒ/ and /ʌ/. For both classes, the L2 /ɒ/ is less back than the same phoneme in SSBE.
Figure 7. Vowel quadrilateral for English phonemic values F1 and F2 of Class 1 in green, of
The vowel chart (see Figure 8) emerges from the values in Figure 7, while it helps to visually establish the known distributions of vowel qualities of the two classes and SSBE model along with their front-back and high-low dimensions. As seen in Figure 8, all the vowels except for /æ/ and /ɒ/ have the same dimensional distributions (high-mid-low, front-central-back) within the vowel chart as plotted vowels of SSBE. The L2 /æ/ was assimilated with the speaker’s L2 /ɛ/, while the L2 phoneme, instead of it being low open, became mid open. Similarly, but only for Class 2, the quality of L2 /ɒ/ was close back instead of mid back. Additionally, plotting the values onto a vowel chart helps to highlight the distances between the participant’s production and the targeted pronunciation. To demonstrate, the least problematic for Czech students was the pronunciation of /ʊ/. The second closest to the targeted model was /ʌ/ with Class 1 being closer to the SSBE vowel quality. Both classes distanced from the SSBE production of /ɒ/ and /ɛ/ to a similar degree (as seen in Table 1). A significant improvement was recorded in Class 2 in the /ɪ/ production, while the values of Class 1 for the same phoneme were way more front in backness. As mentioned earlier, both classes failed to acquire the phoneme /æ/.
Figure 8. Vowel diagram for English phonemic values F1 and F2 of Class 1 in green, of
Class 2 in yellow and of SSBE values in red (generated with the help of free software by
Baker, A., 2015).
5 Discussion
The analysis of development in the production of L2 English checked vowels within the 8-year study period showed numerous results as applied on L1 Czech students. The
cross-sectional approach of analysis determined the most deviated slips from the targeted
pronunciation. Seeing as the participants provided both their L1 Czech and L2 English values, the analysis focused on the relationship between the formants of both languages. Both the targeted model of SSBE and the predispositions (L1 mapping) that L1 Czech places on the learners’ acquisition of English were considered, since L1 Czech affected the production accuracy in students’ L2 English. Thus, the final output considers the participants’ improvement in the pronunciation after 8 years, the vowels in which they made the most production slips, and the effect of L1 Czech on L2 English.
Deterding’s (1990) measured values correspond to Ladefoged (2011, p. 88), who claims that the distribution of the SSBE checked vowels on the vowel diagram will be the following: the auditory quality of [ɪ] is high front, [ɛ] is mid-low front, [æ] is low front, [ʊ] is high back, [ɒ] is mid-low back. The only vowel deviating from Ladefoged’s and Johnson’s (2011) theory is [ʌ], while it becomes mid-central in the case of Deterding’s (1990) values, instead of its presupposed low back quality (p. 88).
Participants of Class 1 have higher formant frequencies than Class 2 in all
measurements, as seen in Table 1. As Huber et al. (1999) claims, the F1 and F2 measurements are influenced by the age and gender of the speakers (p. 1532). Seeing that the size and shape of the vocal tracts of 11-12 years old participants are not as developed as those of Class 2 (the young adult participants), the first and second formant frequencies are reasonably higher for Class 1. To normalise the results that were distinctive for male and female participants,
female speakers of both classes tend to have higher frequency values for all F2 measurements. However, there is an exemption for Class 1 in L1 Czech measurements of /u/, where the male formant values were higher in F2. As previous research claims, sex differences for F2 are not apparent until around 15 years of age (Huber et al., 1999, p. 1533).
The differences in pronunciation between the two classes show improvements in terms of pronunciation acquisition. The older participants were often more successful in
approaching the targeted model, while showing visible pronunciation progress for some of the phonemes. The most marked improvement of Class 2 is the proximity of the L2 auditory quality to the native-like pronunciation in /ɪ/ with their L2 values almost overlapping the targeted model. For the same vowel, the L2 values of Class 1 were significantly more front than the native-like /ɪ/. Another improvement after the 8-year study period was in the
production of /ʊ/ and /ɛ/ (see Table 1), where the participants’ L2 English values shifted from L1 Czech towards the SSBE model. However, their resulted production did not overlap with the targeted qualities. As compared to Class 2, the younger participants also, though to a
lesser extent, shifted the values towards SSBE in their L2 /ɛ/. The L1 Czech /u/ overlaps to a degree with the SSBE /ʊ/. However, for Class 1, the L2 /ʊ/ was assimilated with the L1 Czech phoneme. For both classes, the L2 phoneme /ɒ/ assimilates with L1 /o/. Although Class 2 shifted the L2 English quality towards SSBE in F1, the participants distanced from the targeted values in F2. For the phoneme /ʌ/, the L2 English values of both classes are lower than their L1 Czech. Interestingly, the L2 English values for /ʌ/ were closer to the targeted model for Class 1 rather than Class 2 (see Figure 7 and Figure 8). The most marked
improvement in the production of vowel phonemes within the 8 year study period is then the phoneme /ɪ/, while the L2 /ʊ/ can be considered unproblematic for production due to
overlapping auditory quality in L1 Czech.
The most deviated slip is the participants’ production of the English low front /æ/. Participants of both classes assimilated the phoneme /æ/ with their auditory quality of the mid-low front phoneme /ɛ/. The only category of participants for whom the assimilation of /æ/ and /ɛ/ did not fully apply were the male speakers in Class 2, who were inconsistent in
assimilation of the L2 /æ/ with their values in close proximity for both L2 /ʌ/ and /ɛ/. Thus, both classes showed how the Kuhl’s (2000) “Native Language Magnet Model” theory is being applied in the L2 acquisition process (p. 11854). Based on the data (Figure 5 for Class 1, Figure 6 for Class 2), a pattern can be observed of how the participants use their L1 filter, while attracting the L2 phonemes to already established phonetic categories. Participants used the ‘filter’ for unrecognised foreign language phoneme, which they attracted to their already existing ‘map’ around the L1 Czech phoneme. As stated above, all the phonemes except for /ʌ/ for both classes and /ɪ/ and /ʊ/ in the case of Class 2 were assimilated with their respective L1 categories to a smaller or bigger extent. It can be said that in all the cases where the values are closer to speakers’ L1, the ‘Native Language Magnet Model’ hypothesis applies and it ought to be recognised by teachers of English in Czechia.
As the data shows, L1 Czech affects the L2 English pronunciation, as the ‘Native Language Magnet Model’ hypothesis applies for all the depicted vowels. Within the 8-year study period, the most outstanding improvement for Czech students of EFL (English as a foreign language) was in production of L2 English /ɪ/. Since being phonetically similar in L1 Czech, the least problematic phoneme for production was /ʊ/, where the participants made the least production slips. The phoneme causing the most production slips was /æ/, which for majority of students overlapped with their auditory quality of L2 /ɛ/. There were no significant differences between the two classes in terms of acquisition of the phonemes /ɒ/ and /ɛ/ and the production successfully shifted from the L1 /o/ and /ɛ/ towards SSBE values.
Class 1 was more successful than Class 2 in the acquisition of /ʌ/, since the older participants distanced from the targeted pronunciation.
6 Concluding Remarks
6.1 Conclusion
An accurate recognition of vowel phonemes and the cross-language differences in monosyllabic words are important for the successful L2 learning process. As seen, the unproblematic phoneme for Czech learners’ acquisition is the phoneme /ʊ/, to which no special attention needs to be given in the classes. On the other hand, /æ/ is the most
mispronounced phoneme by the Czech students. The results of this study may provide help for English language teachers in secondary and post-secondary schools in Czechia, who may improve their lesson plans by including specific exercises with focus on the problematic phonemes detected by this study. The attention needs to be given to the phonemes /ɛ, ɒ, ʌ, ɪ/, listed in the sequence from the more to the least problematic for production.
To eliminate students’ production slips and their deviation from the targeted model, teachers may establish more efficient exercises focusing on the specific needs of Czech learners suggested by the current study. Exercises can focus on the distinction between /æ/ and /ɛ/ phonemes, or on the /æ/ and /ʌ/ production. Teaching the learners recognition of the distinctive vowel phonemes may improve their perception and production skills. As an example of a suitable exercise developing the production skills of Czech learners is
Pronunciation Pyramid Exercise, testing the learner’s ability to distinguish between L2 vowel sounds. Also, in their classes, teachers may implement a production stage exercise, for
instance by practicing minimal pairs including /æ/, /ɛ/ and /ʌ/ phonemes with their students.
6.2 Limitations
Although this study has provided valuable contributions in the field of EFL teaching in Czechia, certain limitations must be recognised. Firstly, due to the limited amount of time, only the checked vowels were the subject of this research, including the steady-state vowels might have provided a broader data collection. Secondly, this cross-sectional study only considers the comparison between two distinct age groups from one educational institution, while nearly two thirds of the participants were female. A suggestion for further research is to include participants from more than one school in the recording process with equal
distribution of both genders. Alternatively, the Class 1 could be examined again in their last year of school for a better comparison to their own established data.
References
Baker, A. (2015). Formant chart. Adam Baker. Retrieved from
https://www.adambaker.org/formant-chart/formant-chart.html
Baker, W., & Trofimovich, P. (2005). Interaction of native- and second-language vowel system(s) in early and late bilinguals. Language and Speech, 48(1), 1–27. Bičan, A. (2010). Phonematics of Czech. La Linguistique, 46(1), 19-41.
Collins, B., & Mees, M. I. (2013). Practical Phonetics and Phonology: A Resource Book
for Students. Abingdon: Routledge.
Cruttenden, A. (2014). Gimson's pronunciation of English (8th ed.). London and New York: Routledge.
Deterding, D. (1990). Speaker normalization for automatic speech recognition (Unpublished doctoral dissertation). Cambridge University, Cambridge.
Deterding, D. (1997). The formants of monophthong vowels in Standard Southern British English pronunciation. Journal of the International Phonetic Association, 27(1-2), 47-55.
Flege, J.E. (1995). Second language speech learning: theory, findings, and problems. In W. Strange (Ed.), Speech perception and linguistic experience (pp. 233-277). Timonium, MD: York Press.
Huber, J., Stathopoulos, E., Curione, G., Ash, T., & Johnson, K. (1999). Formants of children, women, and men: The effects of vocal intensity variation. The Journal of the
Acoustical Society of America, 106(3), 1532-1542. http://doi.org/10.1121/1.427150
Khan, A., Shehzad, W., & Ullah, I. (2017). Articulation of English Consonants, Vowels and Diphthongs by Pashto Speakers in Khyber Pakhtunkhwa, Pakistan. International
Journal of English Linguistics, 7(5), 19-33. https://doi.org/10.5539/ijel.v7n5p19
Kuhl, P. (2000). A new view of language acquisition. In Proceedings of the National
Academy of Sciences (pp. 11850-11857). PNAS. Retrieved from
https://doi.org/10.1073/pnas.97.22.11850
Ladefoged, P., & Johnson, K. (2011). A course in phonetics. Boston: Wadsworth Cengage Learning.
Šimáčková, Š., & Podlipský, V. J. (2018). Production accuracy of L2 vowels: Phonological parsimony and phonetic flexibility. Research in Language, 16(2), 169-191.
https://doi.org/10.2478/rela-2018-0009
Sound patterns of Czech (2020). Retrieved from
https://fonetika.ff.cuni.cz/en/czech-phonetics/
Styler, W. (2017). Using Praat for Linguistic Research (Version 1.8.1).
http://wstyler.ucsd.edu/praat//UsingPraatforLinguisticResearchLatest.pdf
Viegas, F., Viegas, D., Guimarães, G. S., Souza, M. M. G. de, Luiz, R. R., Simões-Zenari, M., & Nemr, K. (2019). Comparison of fundamental frequency and formants frequency measurements in two speech tasks. Revista CEFAC, 21(6), 1-10.
https://doi.org/10.1590/1982-0216/201921612819
Appendix 1
Citation values of male and female speakers of SSBE from the study of Deterding (1990, accessed via Deterding, 1997, p. 52)
Appendix II
Appendix III
Appendix IV
Class 1 recorded Czech set of words and formant values of individual subjects
nr gender word F1 F2 word F1 F2 word F1 F2 word F1 F2 word F1 F2
1 F kaz 834 1128 les 804 1369 čip 443 2342 toč 545 1154 sud 418 1031
sad 784 1095 pec 800 1257 tyč 441 2590 sob 568 1103 kus 490 1112
2 F kaz 943 1632 les 818 1889 čip 359 2598 toč 742 1182 sud 415 939
sad 925 1735 pec 767 1935 tyč 519 2483 sob 679 1169 kus 463 945
3 F kaz 627 1257 les 731 1925 čip 483 2524 toč 632 1063 sud 358 1015
sad 686 1400 pec 764 2326 tyč 478 2785 sob 632 1063 kus 429 1049
4 F kaz 857 1354 les 792 1960 čip 450 2547 toč 545 1196 sud 424 1157
sad 910 1751 pec 772 2033 tyč 453 2537 sob 563 1104 kus 456 1097
5 F kaz 826 1310 les 813 1525 čip 433 2311 toč 620 1199 sud 479 1125
sad 775 1467 pec 651 2098 tyč 456 2332 sob 624 1215 kus 447 1176
6 F kaz 914 1454 les 895 1830 čip 501 2618 toč 508 995 sud 407 1247
sad 820 1504 pec 837 1867 tyč 375 1888 sob 717 1104 kus 406 1118
7 F kaz 704 1189 les 832 2075 čip 418 2581 toč 642 1181 sud 398 1014
sad 868 1124 pec 832 2213 tyč 386 2148 sob 624 1057 kus 405 926
8 F kaz 1101 1301 les 778 1809 čip 428 2862 toč 791 1147 sud 354 1263
sad 821 1763 pec 827 2173 tyč 484 2884 sob 630 1131 kus 402 1094
9 F kaz 839 1194 les 881 2088 čip 464 2565 toč 499 992 sud 437 1057
sad 807 1362 pec 809 2251 tyč 502 2442 sob 596 1099 kus 445 1114
10 F kaz 766 1383 les 787 1842 čip 493 2366 toč 614 898 sud 447 1081
sad 826 1602 pec 705 1953 tyč 386 2446 sob 665 1124 kus 394 1206
11 F kaz 1039 1465 les 807 1907 čip 504 2660 toč 701 1051 sud 494 1091
sad 1208 1380 pec 767 2183 tyč 500 2747 sob 764 1286 kus 419 1157
12 F kaz 722 1406 les 617 1669 čip 436 2289 toč 599 1139 sud 433 1261
13 F kaz 902 1659 les 709 2110 čip 396 2734 toč 482 1181 sud 393 1134
sad 856 1752 pec 553 2390 tyč 458 2788 sob 565 1101 kus 491 981
14 F kaz 965 1621 les 794 2175 čip 503 2608 toč 523 1201 sud 475 1274
sad 826 1471 pec 740 2088 tyč 503 2778 sob 612 1263 kus 371 1314
15 F kaz 900 1280 les 785 1832 čip 418 2472 toč 496 1128 sud 435 1194
sad 748 1493 pec tyč 433 2267 sob 550 1152 kus 442 966
16 F kaz 922 1553 les 774 1977 čip 461 2282 toč 525 1218 sud 498 1285
sad 843 1600 pec 719 2036 tyč 468 2306 sob 610 1163 kus 450 926
17 F kaz 998 1449 les 746 1881 čip 500 2251 toč 615 1211 sud 420 1058
sad 783 1466 pec 656 2104 tyč 454 2273 sob 590 1120 kus 431 1072
18 M kaz 789 1669 les 795 1895 čip 342 2409 toč 663 1049 sud 404 1288
sad 825 1249 pec 780 1967 tyč 452 2648 sob 542 1101 kus 485 901
19 M kaz 753 1243 les 839 1601 čip 379 2326 toč 597 1196 sud 314 1070
sad 909 1398 pec 656 1760 tyč 416 2388 sob 573 1133 kus 413 1061
20 M kaz 845 1358 les 780 1814 čip 435 2564 toč 556 1177 sud 507 1031
sad 725 1423 pec 651 1979 tyč 434 2531 sob 665 1175 kus 527 1004
21 M kaz 833 1183 les 922 1745 čip 454 2767 toč 727 990 sud 534 1039
sad 804 1347 pec 834 1948 tyč 470 2763 sob 592 1257 kus 511 1136
22 M kaz 818 1334 les 748 1502 čip 340 2420 toč 685 938 sud 378 1044
sad 775 1369 pec 616 1940 tyč 331 2529 sob 576 1020 kus 371 1146
23 M kaz 673 1040 les 750 1918 čip 485 2087 toč 604 1032 sud 424 1287
sad 703 1271 pec 769 2219 tyč 556 2083 sob 631 1041 kus 418 1014
24 M kaz 750 1207 les 758 1919 čip 381 2546 toč 594 1027 sud 447 1348
sad 864 1204 pec 635 2075 tyč 452 2548 sob 522 1089 kus 386 1153
25 M kaz 839 1172 les 745 1619 čip 458 2591 toč 672 1091 sud 471 1221
sad 874 1391 pec 671 2065 tyč 438 2594 sob 660 1101 kus 402 1268
26 M kaz 783 1134 les 624 1728 čip 403 2506 toč 541 966 sud 426 950
Appendix V
Class 2 recorded Czech set of words and formant values of individual subjects
nr gender word F1 F2 word F1 F2 word F1 F2 word F1 F2 word F1 F2
1 F kaz 1082 1787 les 895 1897 čip 434 1765 toč 498 1138 sud 392 1246 sad 1020 1680 pec 822 2011 tyč 381 2178 sob 512 1122 kus 435 999 2 F kaz 857 1360 les 711 1536 čip 345 2079 toč 637 1098 sud 430 973 sad 819 1522 pec 669 1644 tyč 459 2043 sob 557 1148 kus 392 1033 3 F kaz 1018 1303 les 707 1817 čip 400 2189 toč 506 1101 sud 380 1128 sad 825 1366 pec 685 1970 tyč 386 2210 sob 467 1030 kus 412 1217 4 F kaz 1025 1294 les 898 1730 čip 392 2017 toč 524 1110 sud 369 1256 sad 869 1289 pec 932 1804 tyč 429 2282 sob 477 1098 kus 370 1164 5 F kaz 766 1299 les 827 1766 čip 402 1967 toč 454 1105 sud 407 1060 sad 717 1380 pec 728 2028 tyč 430 2152 sob 479 1033 kus 339 922 6 F kaz 675 1310 les 656 1827 čip 392 2326 toč 482 1127 sud 375 1092
sad 636 1348 pec 579 1907 tyč 401 2383 sob 492 1111 kus 391 1133 7 F kaz 934 1232 les 953 1688 čip 387 2015 toč 533 1153 sud 388 1156 sad 868 1259 pec 883 1880 tyč 387 2092 sob 446 1128 kus 381 996 8 F kaz 1170 1297 les 749 1960 čip 483 2563 toč 436 1112 sud 398 1265
sad 823 1470 pec 605 2035 tyč 445 2375 sob 534 1097 kus 357 1015 9 F kaz 847 1567 les 595 1723 čip 443 2311 toč 507 1194 sud 451 962
sad 488 1135 pec 654 2046 tyč 443 2446 sob 465 1174 kus 340 997 10 F kaz 861 1170 les 871 1576 čip 380 2216 toč 602 1049 sud 417 1113
sad 733 1259 pec 779 1825 tyč 406 2203 sob 509 1125 kus 422 977 11 F kaz 637 1341 les 551 1518 čip 448 2206 toč 441 1173 sud 401 1064
sad 908 1630 pec 615 2047 tyč 389 2080 sob 540 1100 kus 366 1182 12 F kaz 794 1231 les 776 1824 čip 394 2098 toč 482 1051 sud 374 1168 sad 869 1385 pec 638 1976 tyč 404 2204 sob 518 995 kus 403 1008
13 F kaz 1092 1447 les 882 1773 čip 395 1969 toč 507 1183 sud 464 1016 sad 752 1640 pec 732 1862 tyč 428 2130 sob 583 1092 kus 382 1141 14 F kaz 928 1436 les 736 1960 čip 430 2231 toč 502 1116 sud 402 1094 sad 893 1519 pec 626 2029 tyč 439 2187 sob 482 1177 kus 405 1036 15 F kaz 972 1235 les 651 1915 čip 433 2148 toč 696 1027 sud 423 1160 sad 808 1318 pec 692 1979 tyč 424 2293 sob 588 1023 kus 415 1112 16 F kaz 611 1283 les 608 1725 čip 417 2136 toč 408 1141 sud 402 1063 sad 703 1474 pec 623 1914 tyč 444 2031 sob 547 1186 kus 392 1035 17 F kaz 812 1387 les 690 1918 čip 462 2369 toč 487 1165 sud 383 1148 sad 682 1570 pec 628 1843 tyč 419 2184 sob 417 988 kus 416 1265 18 M kaz 769 1103 les 526 1311 čip 294 1883 toč 332 1134 sud 324 1013 sad 591 1195 pec 497 1585 tyč 304 1851 sob 387 1068 kus 321 1058 19 M kaz 618 1146 les 545 1625 čip 344 1962 toč 479 1081 sud 363 993
sad 605 1216 pec 483 1670 tyč 342 2063 sob 422 910 kus 343 1034 20 M kaz 635 1155 les 616 1419 čip 384 1994 toč 450 969 sud 360 1012 sad 649 1197 pec 538 1527 tyč 380 1990 sob 494 991 kus 389 994 21 M kaz 603 1083 les 586 1491 čip 393 2022 toč 479 1055 sud 399 945 sad 607 1228 pec 594 1637 tyč 393 2080 sob 479 974 kus 413 1024 22 M kaz 695 1150 les 566 1483 čip 348 1916 toč 479 969 sud 355 1061 sad 624 1257 pec 550 1722 tyč 365 1983 sob 501 1028 kus 331 968 23 M kaz 543 1070 les 562 1264 čip 331 1807 toč 498 937 sud 351 1032
sad 565 1194 pec 520 1491 tyč 360 1885 sob 471 936 kus 380 993 24 M kaz 584 1104 les 478 1292 čip 349 2193 toč 419 991 sud 381 915 sad 565 1175 pec 556 1519 tyč 391 2161 sob 479 989 kus 331 917 25 M kaz 636 1154 les 596 1680 čip 342 2093 toč 410 999 sud 336 933 sad 615 1287 pec 505 1788 tyč 317 2243 sob 426 967 kus 321 1048 26 M kaz 481 1047 les 452 1570 čip 300 2050 toč 366 968 sud 302 921
Appendix VI
Class 1 recorded English set of words and formant values of individual subjects
nr gender word F1 F2 word F1 F2 word F1 F2 word F1 F2 word F1 F2 word F1 F2 1 F pub head 673 1890 sit 482 2170 pot 560 1193 should 464 1181 cat 673 2033 bus 801 962 set 686 1920 hid 408 2460 lot 470 1132 put 319 1281 bag 646 1869 2 F pub head 748 2123 sit 498 2447 pot 723 1319 should 402 938 cat 668 2231 bus 788 1328 set 750 2035 hid 377 2638 lot 595 1214 put bag 746 1899 3 F pub 571 651 head 683 2320 sit 444 2140 pot 574 1177 should 337 1454 cat 707 2193 bus 745 1204 set 693 2272 hid 458 2535 lot 597 1157 put bag 693 2086 4 F pub 824 1595 head 657 2282 sit 480 2463 pot 524 1137 should 445 1118 cat 667 2288 bus 856 1774 set 702 2143 hid 466 2537 lot 587 1167 put bag 736 2136 5 F pub 755 1397 head 668 2061 sit 499 2330 pot 623 1294 should 499 1055 cat 640 2131
bus 690 1351 set hid 420 2366 lot 640 1191 put bag 650 1879
6 F pub 706 1337 head 800 1977 sit 492 2310 pot 636 1193 should 430 1106 cat 649 2181 bus 868 1514 set 645 1905 hid 435 2180 lot 770 1126 put 399 1180 bag 660 1561 7 F pub 761 1558 head 726 2197 sit 432 2346 pot 679 1116 should 540 1161 cat 702 2390 bus 877 1617 set 802 2196 hid 505 2303 lot 711 1080 put 403 983 bag 692 2382 8 F pub head 701 2227 sit 542 2723 pot 742 1125 should 411 1240 cat 622 2257
bus 828 1396 set hid lot 568 1112 put bag 693 2105
9 F pub 746 1186 head 813 2195 sit 482 2221 pot 568 967 should 474 1024 cat 636 2084 bus 654 1190 set 723 1062 hid 474 2377 lot 645 1099 put 487 1117 bag 677 1509 10 F pub 797 1518 head 655 2048 sit 470 2189 pot 685 1138 should 411 1041 cat 608 2193 bus 800 1502 set 669 1858 hid 487 2361 lot 676 1036 put 441 1007 bag 629 1980 11 F pub 893 1649 head 847 2279 sit 484 2636 pot 728 1267 should 481 1017 cat 734 2246 bus 982 1605 set 692 2114 hid 464 2763 lot 687 1159 put 544 1172 bag 700 2257 12 F pub 643 1377 head 602 1960 sit 426 2165 pot 543 1242 should 430 1034 cat 606 1968 bus 615 1321 set 625 1911 hid 424 2367 lot 600 1109 put 428 1293 bag 612 2104
13 F pub 898 1666 head sit 390 2800 pot 413 1257 should 408 1069 cat 550 2512 bus 532 1481 set hid 431 2835 lot 511 1130 put 416 1196 bag 527 2190 14 F pub 538 1547 head 726 2358 sit 542 2253 pot 613 1271 should 505 956 cat 689 2119 bus 732 1580 set 684 1890 hid 504 2402 lot 616 1256 put 465 1265 bag 662 2056 15 F pub 555 1286 head 708 2104 sit 436 2296 pot 526 1232 should 449 999 cat 611 2057 bus 644 1341 set 627 1988 hid 470 2291 lot 422 1109 put bag 600 2192 16 F pub 875 1464 head 717 2083 sit 483 2245 pot 558 1227 should 501 1213 cat 635 2093 bus 754 1579 set 686 1913 hid 500 2251 lot 697 1187 put 491 975 bag 692 2022 17 F pub 620 1246 head 587 2101 sit 449 2298 pot 572 1154 should 417 1074 cat 628 2088 bus 717 1619 set 654 2026 hid 493 2374 lot 599 1081 put bag 690 2096 18 M pub 694 1632 head 755 2074 sit 501 2505 pot 583 1067 should 448 903 cat 524 1612 bus 787 1271 set 757 1851 hid 373 2612 lot 566 1018 put 454 965 bag 636 2034 19 M pub 828 1379 head 645 1950 sit 544 2111 pot 561 1060 should 415 1095 cat 629 1856 bus 751 1286 set 627 1595 hid 539 2309 lot 571 1011 put 302 1297 bag 20 M pub 787 1403 head 627 2006 sit 433 2213 pot 576 1173 should 476 1232 cat 646 2119 bus 800 1386 set 657 2023 hid 449 2353 lot 609 1191 put 416 1013 bag 680 1628 21 M pub head 758 2218 sit 339 2593 pot 676 1147 should 501 1019 cat 665 2250 bus 754 1304 set 713 1742 hid 552 2472 lot 676 1152 put bag 661 1685 22 M pub 719 1241 head 598 1982 sit 393 2219 pot 500 1077 should 424 1241 cat 589 2075 bus 670 1311 set 673 1890 hid 396 2445 lot 550 926 put 369 1242 bag 641 1962 23 M pub 650 873 head 660 2209 sit 526 2025 pot 631 1126 should 436 976 cat 597 2294 bus 724 1222 set 606 1966 hid 562 2764 lot 609 1025 put bag 612 2297 24 M pub 769 1345 head 581 2176 sit 405 2377 pot 420 1221 should 400 1136 cat 655 2251 bus 709 1388 set 562 1775 hid 416 2543 lot 553 1078 put 384 1176 bag 572 1993 25 M pub 835 1256 head 710 1839 sit 466 2305 pot 589 1264 should 440 1137 cat 636 2067 bus 659 1155 set 653 1853 hid 441 2573 lot 638 1161 put 457 1136 bag 632 1963 26 M pub head 643 1943 sit 464 2059 pot 559 999 should 407 1160 cat 624 2141 bus 684 1271 set 551 1689 hid 411 2511 lot 593 997 put 383 1037 bag 640 1984
Appendix VII
Class 2 recorded English set of words and formant values of individual subjects
nr gender word F1 F2 word F1 F2 word F1 F2 word F1 F2 word F1 F2 word F1 F2 1 F pub 959 1722 head 541 2059 sit 438 2168 pot 521 1161 should 405 1322 cat 674 2058 bus 627 1337 set 700 1998 hid 404 2218 lot 529 1119 put 433 1206 bag 659 2084 2 F pub 800 1334 head 681 1682 sit 485 2062 pot 653 1194 should 510 1280 cat 729 1459 bus 843 1419 set 725 1698 hid 404 2147 lot 646 1260 put 486 1094 bag 731 1460 3 F pub 964 1297 head 661 1970 sit 441 2070 pot 496 1158 should 399 1343 cat 659 2034 bus 885 1419 set 623 1914 hid 404 2269 lot 456 1130 put 440 1009 bag 692 1419 4 F pub 695 1233 head 697 1880 sit 490 2103 pot 644 1190 should 438 1437 cat 744 2007 bus 520 1466 set 652 1929 hid 477 2263 lot 605 1119 put 424 1297 bag 680 1375 5 F pub 1005 1315 head 727 1937 sit 426 2380 pot 457 1002 should 393 1165 cat 671 2059 bus 733 1432 set 691 1955 hid 489 2300 lot 557 1120 put 397 1169 bag 689 2051 6 F pub 535 1259 head 638 2015 sit 419 2214 pot 478 925 should 379 1211 cat 554 2099 bus 680 1248 set 609 1912 hid 410 2340 lot 537 960 put 389 1025 bag 642 1958 7 F pub 711 1142 head 477 1868 sit 436 2093 pot 441 1131 should 390 1023 cat 635 2086 bus 759 1324 set 695 1943 hid 422 2327 lot 657 1153 put 384 903 bag 668 1959 8 F pub 733 1150 head 631 2037 sit 463 2206 pot 605 1219 should 418 1133 cat 696 1974 bus 803 1329 set 615 2060 hid 402 2641 lot 445 1013 put 361 1221 bag 583 2181 9 F pub 987 1408 head 652 2022 sit 482 2234 pot 525 1221 should 389 1208 cat 610 2069 bus 632 1395 set 611 1984 hid 477 2359 lot 619 1196 put 393 1011 bag 681 2073 10 F pub 763 1240 head 662 1996 sit 401 2159 pot 466 1113 should 406 1040 cat 586 2058 bus 539 1349 set 565 1662 hid 386 2354 lot 476 1008 put 404 988 bag 584 1862 11 F pub 942 1406 head 608 2099 sit 435 2069 pot 470 1192 should 397 1081 cat 621 2083 bus 728 1463 set 587 1726 hid 483 2311 lot 732 1495 put 359 1048 bag 695 2108 12 F pub 702 1297 head 656 1991 sit 414 1890 pot 442 1125 should 390 1141 cat 679 1940 bus 809 1338 set 618 1848 hid 424 2220 lot 594 1018 put 382 1119 bag 650 1773
13 F pub 679 1445 head 660 1866 sit 447 2178 pot 460 1248 should 455 1151 cat 524 1675 bus 711 1539 set 653 1716 hid 467 2218 lot 449 1164 put 462 1275 bag 623 2086 14 F pub 792 1372 head 576 2067 sit 447 2068 pot 637 1121 should 409 1049 cat 646 1995 bus 804 1414 set 556 1992 hid 413 2266 lot 576 1129 put 363 1123 bag 666 1973 15 F pub 760 1282 head 765 1980 sit 480 2048 pot 621 1190 should 476 1205 cat 666 2171 bus 823 1446 set 640 1990 hid 492 1894 lot 670 1159 put 467 1131 bag 636 2096 16 F pub 838 1359 head 625 1974 sit 473 1968 pot 429 1122 should 423 1053 cat 606 1969 bus 610 1572 set 603 1867 hid 458 2237 lot 588 1014 put 411 1150 bag 611 2017 17 F pub 776 1425 head 653 1983 sit 461 2069 pot 641 1015 should 409 1135 cat 581 2032
bus 678 1502 set 610 1768 hid 440 2150 lot 607 1205 put 422 1162 bag 652 1918
18 M pub 583 1185 head 412 1596 sit 329 1807 pot 508 1230 should 334 1130 cat 453 1631 bus 498 1248 set 344 1481 hid 335 1833 lot 451 1160 put 340 1069 bag 461 1534 19 M pub 618 1235 head 478 1709 sit 391 1920 pot 442 1015 should 359 928 cat 556 1756 bus 580 1118 set 483 1612 hid 391 1920 lot 450 969 put 356 1022 bag 593 1605 20 M pub 709 1172 head 546 1809 sit 378 1797 pot 484 1093 should 365 923 cat 555 1713 bus 638 1172 set 523 1541 hid 424 1929 lot 511 970 put 381 929 bag 570 1727 21 M pub 642 1155 head 543 1756 sit 419 1989 pot 498 1019 should 343 908 cat 461 1651 bus 579 1187 set 520 1582 hid 411 2090 lot 425 997 put 377 923 bag 408 1385 22 M pub 645 1227 head 581 1739 sit 430 1884 pot 583 1072 should 384 1034 cat 564 1752 bus 617 1196 set 527 1639 hid 439 1927 lot 514 882 put 339 908 bag 601 1721 23 M pub 414 825 head 501 1449 sit 413 1653 pot 527 973 should 387 1273 cat 516 1588 bus 573 1048 set 459 1375 hid 374 1801 lot 513 928 put 304 1099 bag 535 1528 24 M pub 614 1240 head 603 1803 sit 378 2070 pot 606 1186 should 350 968 cat 609 1897 bus 633 1028 set 540 1571 hid 386 2171 lot 439 916 put 321 953 bag 598 1774 25 M pub 493 520 head 455 1704 sit 428 1897 pot 402 1015 should 351 1066 cat 529 1765 bus 537 1114 set 487 1608 hid 419 2094 lot 478 1062 put 364 1124 bag 563 1589 26 M pub 542 1174 head 519 1888 sit 327 2083 pot 328 1290 should 322 1331 cat 503 1707 bus 556 1239 set 448 1579 hid 344 2061 lot 388 900 put 359 1009 bag 512 1502
![Figure 2. Czech vowel diagram with the distribution of Czech phonemes ([Legend of the diagram edited by me], “Sound patterns of Czech”, 2020).](https://thumb-eu.123doks.com/thumbv2/5dokorg/4087304.85702/8.892.109.372.431.645/figure-czech-diagram-distribution-phonemes-legend-diagram-patterns.webp)
![Figure 4. Example of ten milliseconds clipped from a Praat spectrogram for generating F1 and F2 of the vowel [ɛ] in the word ‘head’](https://thumb-eu.123doks.com/thumbv2/5dokorg/4087304.85702/15.892.106.785.643.946/figure-example-milliseconds-clipped-praat-spectrogram-generating-vowel.webp)