1
Water vapor sorption-desorption hysteresis in glassy
surface films of mucins investigated by humidity scanning
QCM-D
Sebastian Björklund1,2,* and Vitaly Kocherbitov1,2
1Department of Biomedical Science, Faculty of Health and Society, Malmö University, Malmö,
5
Sweden
2Biofilms Research Center for Biointerfaces, Malmö University, Malmö, Sweden *Corresponding author (sebastian.bjorklund@mau.se)
2
Abstract
HypothesisInvestigating the origin of water sorption-desorption hysteresis in glassy biopolymers is important for understanding the properties of biological barriers, such as the mucus epithelium. In general, hysteresis is a result of a complex interplay between diffusion of water and 5
relaxation of the polymer matrix. Our hypothesis is that for thin films, typical for quartz crystal microbalance with dissipation monitoring (QCM-D) experiments performed in gas phase with defined relative humidity, the diffusion limitation is eliminated and hysteresis results only from relaxation of the polymer matrix.
Experiments 10
We use a recently developed humidity scanning (HS) QCM-D method to obtain water sorption-desorption isotherms of mucin films under controlled conditions where water diffusion is not the limiting factor, neither in the vapor phase nor in the glassy mucin film.
Findings
We present new results on the water sorption-desorption behavior of glassy mucin films with 15
nanoscale thicknesses. Despite the fact that water diffusion is not the limiting factor, the sorption-desorption branches show clear hysteresis effects that are similar to those typically observed in bulk samples. The hydration-induced glass transition, resolved from monitoring the rheological behavior of the films, is shown to be in excellent agreement with the onset of the sorption-desorption hysteresis. We suggest that the hysteresis effect is related to a difference 20
in dynamical and structural properties of the glassy materials depending on the hydration history of the films.
3
Keywords: relative humidity; water vapor pressure; glass; glass transition; relaxation; polymer dynamics; adsorption; sorption; desorption; isotherms; hysteresis
4
Introduction
Hydration and dehydration of biological systems may influence their physical and chemical properties, such as physical phase behavior, permeability, rheology, and progression of chemical reactions. This issue is particularly important for systems that are in direct contact with a surrounding vapor phase with varying relative humidity (RH) or water activity (aw = RH
5
/ 100%), which thus regulates the system’s water content. For these cases, it is crucial to understand how the water content of the system affects the physical and chemical properties of the system. Some examples of biological systems that are affected by the surrounding RH are the skin barrier,1 the lipid tear film formed on eyes,2 or mucus layer, for example, the interior
surfaces of the oral or nasal cavities.3-4 Considering its importance, the topic of water sorption
10
behavior is a widely studied phenomenon.1, 3-14 Still, at the present many aspects remain
incompletely understood, such as the mechanism responsible for sorption-desorption hysteresis.
A multitude of different models of sorption behavior can be found in the literature to describe the interaction with water vapor with various (biological) systems. In fact, this resonates well 15
with Irwin Langmuir’s statement made in 1918: “It is then no longer reasonable to look for a single equation which, for all cases, will give the relation between the pressure and the quantity of adsorbed gas”.15 However, the models are quite often based on assumptions that do not
reflect the physicochemical nature of sorption. For example, models for multilayer adsorption, which in principle are extensions of Langmuir’s model to allow for physiosorption of additional 20
layers of molecules, such as Brunauer–Emmett–Teller (BET)16 and Guggenheim-Anderson-De
Boer (GAB), assume the formation of multilayers of adsorbate even before the completion of a monolayer. However, build-up of multilayers of water molecules, before formation of a reasonable compact monolayer, would lead to separation of adjacent surfaces of biopolymers,
5
with an extensive void separating them, which is not realistic because it would result in a very high surface energy. In contrast to the case of biopolymers, the multilayer assumption is reasonable for porous solid materials where the solid skeleton exists independently of the degree of hydration.13, 17 At low a
w, water adsorbs on the walls of silica (at the solid-gas
interface), and at higher values of aw, capillary condensation of water occurs in the pores.
5
However, this scheme is less applicable to hydration of biopolymers in the bulk phase, such as proteins and carbohydrates, where the existence of a large solid-gas interface would be energetically unfavorable at low values of aw.10 In spite of this, these models, especially the
BET model, are widely used to describe the adsorption process of gas molecules onto solid surfaces with the aim to calculate the surface area. In fact, it has been shown that the less 10
complicated Langmuir model is more suitable for modelling water sorption isotherms of biopolymers such as microcrystalline cellulose (MCC)11 or globular proteins such as
lysozyme.10 However, the reason for the validity of the Langmuir model in these two cases
differs. For MCC the solid-solid interface between the 4 nm thick cellulose microfibrils limits the formation of multilayers.11 While, for lysozyme, the tight packing of biomolecular globules
15
prevents an available solid-gas interface and therefore sorption of water occurs at a protein-protein, not at a protein-gas, interface.10
Another common drawback of most sorption models is that they are unable to explain the phenomenon of hysteresis between the sorption and desorption branches of the isotherm. This may be connected to the fact that most models ignore dynamical and/or structural phase changes 20
taking place in the biological system during the sorption process. Even though it is quite possible to fit a particular model to both the sorption and desorption branches of the isotherm, the validity of doing so is questionable. Models for explaining hysteresis in rigid porous materials, such as the Barrett-Joyner-Halenda (BJH) model,18 are also not appropriate for many
6
biological materials where the water acts as a plasticizer and may induce glass transitions and thus affect the viscoelastic properties of the system.
One proposed theory for describing the sorption by glassy polymers is the dual-mode model where the total absorbed amount consists of two distinct molecular populations that are described by a combination of the Langmuir isotherm expression and Henry’s law.19 According
5
to this model, the sorption in the glassy state generally takes place by two processes operating concurrently; one where a molecular population dissolves directly into the polymer according to Henry's law, while the second process involves sorption by hole-filling according to the Langmuir expression.19 The concept of hole filling however contradicts experimental data on
comparison between sorption of water and nitrogen in biopolymers, such as cellulose.11 In
10
particular, cellulose absorbs two orders of magnitude more water than nitrogen, indicating that the holes (corresponding to the size of gas molecules) are not initially present in the material, but are created by the absorbed gas. Another approach that is more theoretically justified is the free-volume theory,20-22 which does not assume existence of holes, but rather considers specific
volumes of liquid and glassy polymers. For description of sorption isotherms, the free volume 15
theory uses a modified version of the Flory-Huggins equation by including an additional term for the glassy state that is dependent on the heat capacity difference and the glass transition temperature of the polymer-absorbate mixture.22
The transition from the glassy to the rubbery state, or liquid state for low-molecular weight compounds, is very common in both synthetic and biological polymers and low-molecular 20
weight molecules. However, despite intensive research of this topic for a long time there are still many aspects that are not fully understood of the glassy state. For example, there is no clear explanation for the experimental observation that glassy polymers absorb higher amounts of water, resulting in sorption-desorption hysteresis, and that sorption of glassy polymers is more
7
exothermic as compared to what is expected from the properties of the same materials in the rubbery/liquid-like state. A key question related to hysteresis is whether the time to reach equilibrium, during water sorption or desorption, is controlled by the diffusion rate inside the polymer matrix or not. To answer this question, it is important to consider that transport of water from a humid vapor phase to the surface of the film can be the rate-determining process, 5
which was recently shown from DVS (dynamic vapor sorption) studies on water sorption-desorption of complex salt films (i.e. films of ionic surfactants with polymeric counterions).9
Notably, it was shown that the sorption-desorption kinetics were governed entirely by transport of water through the vapor phase for a significant part of the isotherms, while all other equilibration processes, including the internal equilibration of the water content through 10
diffusion inside the 10-100 µm thick films, were much more rapid.9
In this work we investigate the water sorption-desorption behavior of pig gastric mucin (PGM) and bovine submaxillary gland mucin (BSM) with the aim to increase the understanding of the mechanisms that influence their hydration. Mucins are high-molecular-weight glycoproteins that are components of the slippery mucus secretion that covers epithelial cell surfaces. The 15
mucus layer is found in various internal organs, including the digestive, respiratory, and reproductive systems, and function primarily as a protective and lubricious viscoelastic barrier. Thus, the studied mucins were selected based on their biological relevance as major components of the mucus barrier, which is in contact with the external vapor phase where changes of the humidity are highly relevant. In particular, we focus on answering if the sorption 20
of mucin films is determined by the water diffusion inside the polymer matrix, or not. Another problem we aim to investigate is how the sorption behavior is affected by the state of the polymer matrix. For example, is the sorption behavior different if the polymer is in a glassy or a liquid-like state and, if so, how can this difference be understood.
8
To approach these questions, we use a suitable method based on QCM-D (quartz crystal microbalance with dissipation monitoring) where the mucin film is coated onto a quartz sensor and exposed to an atmosphere with controlled humidity. This method has been used previously to investigate hydration of various films made up of polymers, lipids or surfactants.3, 5-8, 13 In
particular, we employ a humidity scanning method (HS QCM-D), which is explained in detail 5
elsewhere,5 that allows for studies of both the sorption and desorption behavior on relatively
thin films ( 100 to 1000 nm). In a typical HS QCM-D experiment, the mucin film is exposed to a gas atmosphere with continuously adjusted RH from either low to high humidities or in the opposite direction.
The results are clear and show that there is significant hysteresis between the sorption and 10
desorption branches for both type of mucin films. Based on the HS QCM-D results, we present new approaches on how to determine the hydration-induced glass transition in terms of water activity and water content. We show that the onset of the sorption-desorption hysteresis coincides precisely with the glass transition water activity, which is resolved from simultaneous monitoring of the rheological behavior of the mucin films. The reason for the observed 15
hysteresis, despite the fact that the mucin films have thicknesses in the nanometer scale, is analyzed in terms of water diffusion (inside the film and outside in the vapor phase) and discussed within the frameworks of the free volume theory. The conclusion from this analysis is that the water sorption behavior of the studied mucin films is not diffusion-controlled, neither by water transport inside the polymer matrix nor by transport in the vapor phase outside of the 20
mucin film. This limiting case of thin surface films, where the sorption behavior is not diffusion-controlled, allows for clarification of the mechanism of the hysteresis effect, which likely can be explained by a difference in dynamical and structural properties of the glassy materials arising from dissimilar hydration histories of the films.
9
Materials and Methods
MaterialsLithium chloride (LiCl, anhydrous, p.a. quality), sodium dodecyl sulfate (SDS, reagent plus quality), pig gastric mucin (PGM, catalog number M1778, type III, bound sialic acid 0.5-1.5 wt. %, partially purified powder), and bovine submaxillary gland mucin (BSM, catalog number 5
M3895, type I-S, bound sialic acid 9-24 wt. %, non-sterile powder), were purchased from Sigma Aldrich. All water used in this work was of ultrapure grade. Saturated LiCl solution was prepared by mixing excess amounts of LiCl in water for several days. The saturated solution was then filtered two times to remove excess LiCl salt. To calculate the thickness of the dry coated films a density of ρ=1.08 g cm-3 was used for PGM and BSM.3
10
Humidity Scanning QCM-D (HS QCM-D)
The instrument used in this work was a q-sense QCM-D E4 unit equipped with a humidity module QHM 401 and AT-cut SiO2 (QSX 303, 5 MHz) sensors from Biolin Scientific AB.
New sensors were washed with water and ethanol before use. Reused sensors were cleaned by treatment with UV radiation for approximately 10 minutes, followed by immersion in 2 % 15
sodium dodecyl sulfate (SDS) aqueous solution for at least 30 minutes at room temperature. Next, the sensors were rinsed with water and dried with N2 gas and finally treated one more
time with UV radiation for about 10 minutes.
The sorption/desorption method is based on controlled dilution/concentration of a LiCl solution to change the water activity (aw) in a continuous manner. A schematic illustration of the set-up
20
is shown in Fig. S1. The humidity module is equipped with a Gore® membrane, which separates the flowing solution from the sensor. The membrane is designed to allow fast transport of water vapor, which diffuses from the solution into the gas phase above the sensor
10
and thus regulates the relative humidity (RH) above the film coated on the sensor. A short description of the method is given here, while a more detailed description is given elsewhere.5
In brief, to scan the humidity with precision, the method is based on controlled dilution or concentration of a LiCl solution to adjust the aw. The LiCl solution with known aw is pumped
through the humidity module according to the set-up shown in Fig. S1 (where bottle 1 contains 5
the LiCl solution with continuously adjusted aw). Based on a gravimetric analysis of the mass
changes of bottle 1, 2, and 3, before and after the experiment, the molal composition of the LiCl solution can be calculated as a function of time. From this, the aw in the LiCl solution (in bottle
1) can be calculated from literature data on aw as a function of LiCl molal concentration.23 In
the sorption mode, the experiment starts with a close to saturated LiCl solution in bottle 1, 10
which is continuously diluted with incoming pure water. For desorption, the experiment starts with a diluted LiCl solution (with known aw), which is continuously concentrated with
incoming (close to saturated) LiCl solution. To obtain correct values of the aw from the
calculations it is crucial that the LiCl molal concentration is accurately determined. Therefore, the LiCl molality is regularly analyzed by gravimetry with both good accuracy and precision; 15
the relative standard deviation (RSD) of this procedure is less than 0.1 %. In other words, 0.1 % RSD is the expected precision for the calculated values of aw, which has been validated by
multiple determinations of the initial and final composition of the LiCl solution in bottle 1, together with experimental measurements of the aw in the corresponding solutions.5
Here, the general procedure of an experiment started by measuring the uncoated sensor in dry 20
N2 atmosphere at 25 °C. Next, the sensor was coated by spin-coating from an aqueous solution
that was applied in 20 µl aliquots 3-10 times in total. The concentration of the aqueous solutions used for coating the sensor varied between approximately 2-20 wt. % for spin-coating. The reason for using spin-coating is that this technique produces relatively homogeneous films, as
11
compared to drop-coating 5. However, a few samples were prepared by drop-coating with the
aim to investigate hydration-induced rheological properties. For this, a drop of approximately 20 µl mucin solution (0.1-0.2 wt. %) was spread out to cover the surface of the sensor and letting the solution dry overnight. Subsequently, the coated sensor was dried in vacuum for minimum 15 min and then put back in the module for measurement under the flow of N2 gas
5
until a stable baseline of the frequency was obtained. Meanwhile, the tubings (ID 0.13 mm) from the peristaltic pump (Ismatec IPC4) were connected to the different bottles according to Fig. S1. In the case when a sorption experiment was followed by a desorption experiment, the final LiCl solution from the sorption experiment, was in most cases reused as initial LiCl solution for desorption. The desorption experiment was then initiated immediately by the above 10
described procedures, except that the experiment started from humid conditions instead of dry N2 atmosphere.
QCM-D data analysis
The quartz resonator technique operates by applying an alternating potential field across the quartz crystal at a frequency close to the resonance frequency of the particular crystal, which 15
induces an oscillating shear motion of the crystal. Resonance is achieved when the standing wave produced by the alternating expansion and contraction is an odd integer of the thickness of the quartz sensor.24 The resonance frequency is monitored and gives information on the
adsorbed mass on the quartz crystal sensor. Under the assumptions that the material is rigidly adsorbed and homogeneously distributed over the active area of the sensor, and that the mass 20
of the film is small relative to the mass of the quartz crystal, the Sauerbrey equation (eq. 1) can be used to calculate the mass of the adsorbed material.25
12
∆𝑓𝑛 =2𝑓02𝑚
𝑍𝑞 (1)
The Sauerbrey equation (eq. 1) describes the proportionality between the frequency change, normalized per overtone n, ∆𝑓𝑛 = ∆𝑓/𝑛 (Hz), and areal mass, m (kg m-2). Z
q is the acoustic
impedance of quartz (Zq =8.8 x 10⁶ kg m-2 s-1) and f0 is the fundamental resonance frequency
of the quartz sensor (f0 ≈ 5 MHz). The QCM-D instrument also monitors the dissipation (DQCM),
which is related to the decay time of the resonator when the alternating potential field is turned 5
off. The decay time is proportional to the energy dissipation of the quartz crystal and greatly depends on the viscoelastic properties of the adsorbed material. Thus, the dissipation gives information on the rheological properties of the film.
In the present study, the frequency data were analyzed according to the single viscoelastic film in air model,26 which previously has been used for QCM-D hydration studies on various
10
systems.3, 6, 8 According to this model the frequency shift is proportional to the square of the
𝑛th overtone by the following relation:
∆𝑓𝑛 = − 2𝑓02𝑚 𝑓 𝑍𝑞 (1 + 𝑍𝑞2𝑚 𝑓2𝜋2𝑛2 3𝑍𝑓2𝑚 𝑞2 ) (2)
where mf corresponds to the total mass of the coated sensor with respect to the uncoated sensor
and mq is the areal mass density of quartz, while f0 and Zq have the same meaning as in eq. 1.
As previously shown, the total mass of the dry or hydrated film can be derived from the single 15
viscoelastic film in air model by extrapolating the frequency shift to the zeroth overtone, which allows for determination of the water content of the film during the sorption or desorption experiment.3, 5, 8 In general, for this analysis a majority of overtones (i.e. n = 1, 3, 5, 7, 9, 11,
13
the zeroth overtone. Iv vt can be pointed out that this analysis is relatively robust in terms of the final obtained sorption-desorption isotherms of mucin films, including the degree of hysteresis, when including or excluding different overtones.
For calculations of the mean values of the water content of different sorption-desorption isotherms, and the corresponding standard deviations (±SD), the data of the individual 5
isotherms were resampled with a 1-D interpolation function in MATLAB from data points distributed in the water activity scale (aw) between 0.12 and 1 in activity steps of 0.005.
Similarly, the same 1-D interpolation function was used to calculate both the difference in water content between the sorption and desorption branch between aw = 0.12 -1 in activity steps of
0.0001 and, finally, the aw values at specific water contents between 0 and 60 wt. % in steps of
10
0.1 wt. %.
Results and discussion
The outline of this section is as follows. First, we present results from the HS QCM-D experiments on water sorption of mucins films, including comparisons with the corresponding water sorption isotherms obtained from bulk samples. Then, we present results on water 15
sorption-desorption isotherms, showing a clear hysteresis effect between the two sorption branches. Subsequently, we confirm that the present water sorption-desorption isotherms of mucin films are not limited by water diffusion inside or outside the mucin film and thus cannot be the reason for hysteresis. To draw this conclusion, we analyze the effect of mucin film thickness and water activity scan rate on the sorption-desorption isotherms and show that none 20
of these parameters affect the present results. Then, we show that the onset of the hysteresis between the sorption and desorption isotherms, in terms of water activity, coincide with drastic changes of the rheological properties of the mucin films. Finally, the mechanism of the
14
sorption-desorption hysteresis is discussed within the framework of the free volume model by Vrentas and Vrentas.21-22
Representative set of raw data from humidity scanning (HS) QCM-D
The HS QCM-D methodology for sorption and desorption has previously been described in detail.5 In brief, the results from a representative sorption-desorption experiment are presented
5
in Fig. S2 in the Supporting Information, which was performed on a PGM film where the aw
was initially scanned from low to high values (sorption mode) followed by the opposite scan direction (desorption mode). Before starting the sorption experiment it is required to determine the dry mass of the film, which is done by first measuring the resonance frequency of the uncoated sensor under the flow of N2 gas. Next, the sensor is removed from the QCM-D
10
module, coated with the sample, dried, and put back for measurement of the resonance frequency of the coated sensor under the flow of N2 gas. The data in Fig. S2 are given as a
function of time, while the results in Fig. S3 show the same data plotted as a function of aw. It
can be noted that the scan rate of aw is not constant during the experiment, see Fig. S4. This is
due to that the concentration of the LiCl solution changes in a non-linear manner and also that 15
the aw depends on the LiCl concentration in a non-linear manner.5, 8
Water sorption isotherms – film versus bulk samples
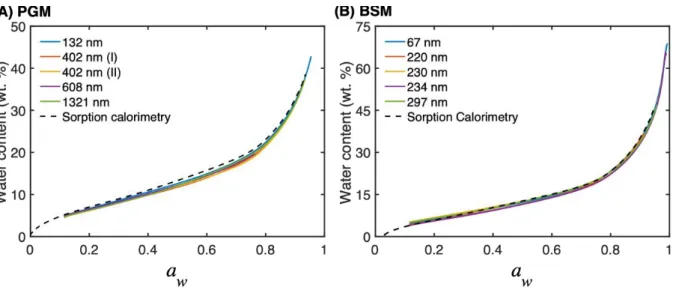
We start by comparing the water sorption isotherms obtained with mucin films with the corresponding isotherms obtained with bulk samples. Fig. 1 show sorption isotherms, plotted as water content (wt. %) as a function of water activity (aw), of (A) PGM and (B) BSM films
20
measured by HS QCM-D, together with the corresponding isotherms obtained by sorption calorimetry with bulk samples. The results show good agreement between the two experimental methods and also good reproducibility of the sorption isotherms determined with HS QCM-D.
15
Figure 1. Sorption isotherms of (A) PGM and (B) BSM films with varying thicknesses (as indicated by the numbers in units of nm). The corresponding isotherms from water sorption calorimetry on bulk samples are included for comparison (dashed lines, data from14).
Water sorption-desorption isotherms 5
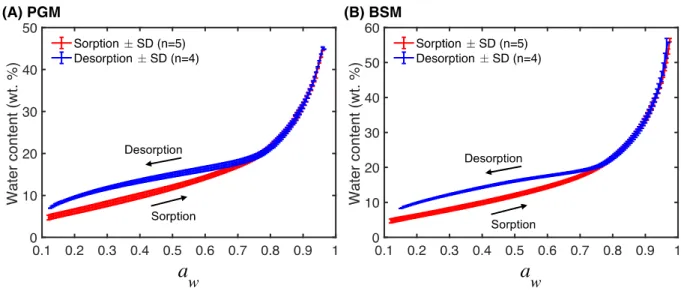
To investigate the sorption-desorption behavior of films of PGM and BSM we performed several HS QCM-D experiments. The results are presented in Fig. 2 as the average water content (± standard deviation, SD), based on several sorption (n=5) and desorption experiments (n=2-4) performed with mucin films with thicknesses ranging from approximately 100 to 1000 nm, plotted as a function of water activity (aw). The water sorption-desorption isotherms in Fig.
10
2 are strikingly similar for both PGM and BSM, which is an interesting result considering the fact that these biopolymers have notable differences between their molecular compositions. For example, the sialic acid content is lower in PGM (about 2 %) as compared to BSM (about 10−25 %), while the content of carbohydrates in PGM is higher (about 85 wt. %) as compared to BSM (around 65 wt. %).14 Still, the only difference in the sorption behavior when comparing the
15
isotherms is that the BSM films contain slightly more water at high water activities, which is in line with previous work.14 A likely explanation of this finding was previously proposed;14 in
16
brief, Znamenskaya et al.14 suggested that the higher water content of BSM can be attributed to
the presence of a greater number of negatively charged carbohydrate side chains, due to a higher content of sialic acid and sulfate moieties in BSM, which induce stronger electrostatic repulsion forces and, consequently, a higher capacity to swell by water uptake at high levels of aw.
The isotherms show clear hysteresis between the sorption and desorption branches below 5
roughly aw ≈ 0.76 for PGM and aw ≈ 0.79 for BSM (see Fig. S5 for a close-up of the hysteresis
region); the water contents that these water activity values correspond to are summarized in Table 1. Hysteresis is a common feature of an amorphous polymer-absorbent system, which exhibit different sorption behaviors above and below the glass transition temperature of the pure polymer. In other words, the hysteresis is related to the physical properties of the mucins, 10
which clearly are different in the glassy state as compared to the liquid-like state. Therefore, we summarize the hysteresis effect in Table 1 by compiling the water activity levels and water contents below which hysteresis is observed. The different approaches used to determine the water activities and water contents are explained in detail in the coming sections.
15
Figure 2. Sorption-desorption isotherms from (A) PGM and (B) BSM films obtained with HS QCM-D. The results are presented as the average water content (± standard deviation, SD) from
17
several sorption (n=5) and desorption experiments (n=2-4) performed with mucin films with thicknesses ranging from approximately 100 to 1000 nm.
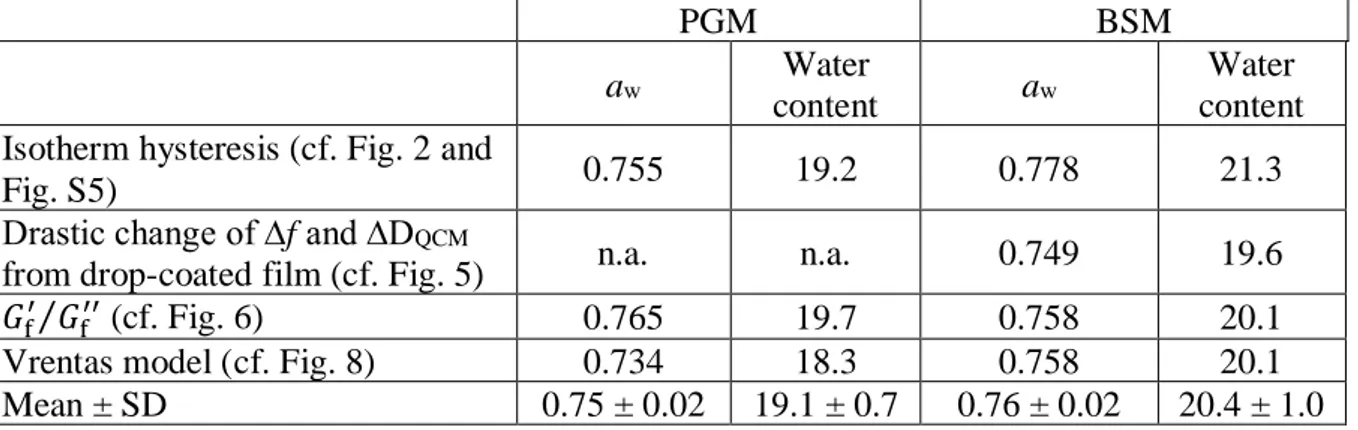
Table 1. Summary of water activity and water content (wt. %) values for the onset of the glass transition of PGM and BSM films at 25 °C.
PGM BSM
aw Water
content aw
Water content Isotherm hysteresis (cf. Fig. 2 and
Fig. S5) 0.755 19.2 0.778 21.3
Drastic change of ∆f and ∆DQCM
from drop-coated film (cf. Fig. 5) n.a. n.a. 0.749 19.6 𝐺f′ 𝐺
f′′
⁄ (cf. Fig. 6) 0.765 19.7 0.758 20.1
Vrentas model (cf. Fig. 8) 0.734 18.3 0.758 20.1
Mean ± SD 0.75 ± 0.02 19.1 ± 0.7 0.76 ± 0.02 20.4 ± 1.0
Water diffusion through the gas phase is not rate-limiting in humidity 5
scanning (HS) QCM-D experiments
In this section we considering the possibility that the rate of transport of water from the humid vapor phase to the film surface may be the rate-determining process, which was shown to be the case for sorption-desorption studies on complex salt films with thicknesses in the range of 10-100 µm performed with a dynamic vapor sorption balance.9 To evaluate the possibility that
10
this effect can influence the HS QCM-D results we treated our data according to the model presented by Gustavsson and Piculell.9 In this model, a central parameter is the characteristic
time constant 𝜏 (s), which is a measure of the time required to transport water from the humid vapor phase to the film surface to reach the equilibrium water content according to:
𝜏 = 𝑚𝑑𝑟𝑦𝛿𝑅𝑇 𝑀𝑤𝐷𝑤𝑝𝑤0
∆(𝑚𝑤⁄𝑚𝑑𝑟𝑦)
∆𝑎𝑤 (3)
From eq. 3 it is clear that 𝜏 depends on the areal mass of the dry film 𝑚𝑑𝑟𝑦 (kg/m2), the
15
18
and the slope of the sorption isotherm ∆(𝑚𝑤⁄𝑚𝑑𝑟𝑦) ∆𝑎⁄ 𝑤 (where the water content is given as mass ratio between water 𝑚𝑤 and the dry film 𝑚𝑑𝑟𝑦). The present sorption isotherms were evaluated according to eq. 3 with values of the molecular weight of water 𝑀𝑤 = 1810-3 kg/mol,
the saturation pressure of water 𝑝𝑤0 = 3.167103 Pa (at 25°C), and the diffusion coefficient of
water in air 𝐷𝑤𝑎𝑖𝑟 = 2.610-5 m2/s (at 25°C).
5
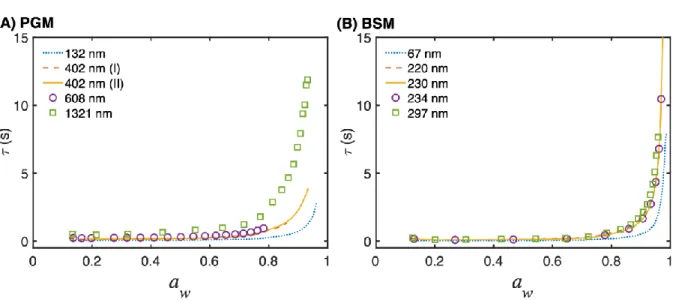
Figure 3. The characteristic time constant 𝜏 (s), calculated with eq. 3, for external transport of water through the vapor gap in the humidity module plotted as a function of water activity for (A) PGM and (B) BSM films with varying thicknesses. The characteristic time constant is an estimation of the time required to transport water from the humid vapor phase to the film surface 10
to reach the equilibrium water content of the mucin films.
The results are presented in Fig. 3 and show that the external transport of water from the vapor phase to the film surface occurs within seconds, which is much faster than the time scale of the experiments (i.e. several hours, see e.g. Fig. S2 and Fig. S4). In addition, a similar analysis based on eq. 3 for the characteristic time for water vapor transport across the Gore® membrane, 15
which is designed to facilitate a high flow of water vapor from a separated aqueous solution, gives similar results (see Fig. S6). However, the characteristic times are shorter by a factor of
19
approximately 0.5 due to the fact that the Gore membrane is thinner (about 200 µm in total thickness) as compared to the vapor gap (1000 µm) and the effective diffusion coefficient is lower (about a factor 0.4) due to the porosity and tortuosity of the membrane.
These are important results which allow us to conclude that the sorption-desorption isotherms, and the observed hysteresis, are not affected by slow transport of water in the vapor phase. 5
Some additional interesting features observed in Fig. 3 are the drastic increase of 𝜏 at high water activities and a small, but noticeable, increase of 𝜏 as the film thickness increase. The former effect occurs due to the fact that the mucin films take up significant amounts of water at high water activities, which means that the time required to transport this amount of water, from the vapor phase to the film, increases. Similarly, the latter observation is due to the fact that a 10
thicker film requires transport of more water from the vapor phase to reach the equilibrium water content of the film.
Taken together, the main conclusion from Fig. 3 is that the characteristic time for transport of water across the vapor phase, including transport through the porous Gore® membrane (Fig. S6), to the film surface does not influence the sorption-desorption process for the mucin films 15
studied here.
Film thickness and water activity scan rate do not influence the sorption behavior of mucin films
The difficulty to distinguish between diffusion-controlled or relaxation-controlled mechanisms for explaining the water sorption behavior and the observed hysteresis effect represents a 20
complex issue. One way to approach this issue is to investigate if the isotherms are dependent on experimental conditions, such as water activity scan rate or film thickness, where it is
20
expected that the obtained isotherms are affected by these parameters if the sorption behavior is controlled by the diffusion of water inside the mucin film.
Starting with the water activity scan rate, if the scan rate is fast in relation to the time it takes to reach the equilibrium water content at a specific water activity, during either sorption or desorption, it is expected that non-equilibrium conditions will prevail. To investigate this, we 5
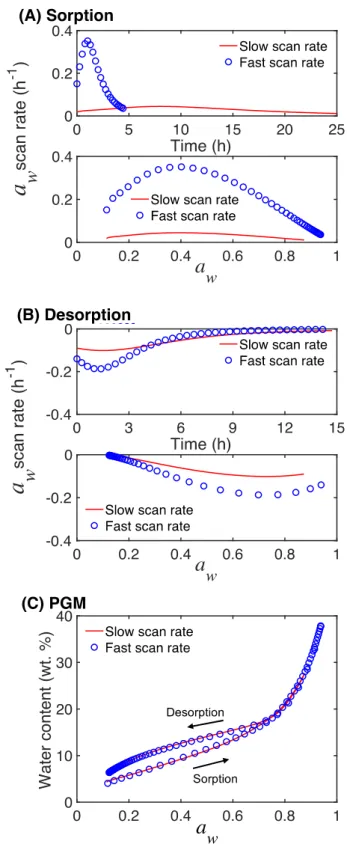
performed experiments with varying scan rates on the same sensor coated with a 402 nm thick PGM film. As illustrated in Fig. 4, no significant difference was observed between the two sorption-desorption cycles, obtained on the same PGM film, when comparing the results from experiments with a relatively fast or slow scan rate of the water activity.
21
Figure 4. The data in (A and B) show the water activity scan rate as a function of time (top subplot) and as a function of water activity (bottom subplot) from sorption (A) mode and desorption mode (B), respectively. The sorption-desorption isotherms in (C) correspond to the
22
data in (A) and (B). All experiments were performed on the same PGM film with a thickness of 402 nm. The water content was calculated based on the mean value of the mass of the dry film (corresponding to a thickness of 402 ± 0.2 nm or ∆f = -2444 ± 20 Hz), which was measured each time before the sorption-desorption experiment started.
Another aspect that can result in a non-equilibrium water content is the mucin film thickness. 5
For very thin films confinement effects may occur. For example, it has been observed that the
rate of water absorption in polyelectrolyte films with thickness < 50 nm was significantly
decreased, as compared to thicker films, in experiments where the dry film was exposed to 100% RH, while the equilibrium water content was not affected by the film thickness.12 Perhaps
more relevant here is the case of thick films where it can be a risk of not reaching the 10
equilibrium water content in the deeper regions of the film due to slow water diffusion. To address this issue, we can compare the results from sorption experiments on films with thicknesses varying from roughly 100-1000 nm. The conclusion from Fig. 1 is that there is no significant difference between the sorption isotherms corresponding to relatively thin or thick films. Another non-equilibrium aspect that may be related to the film thickness is the extent of 15
hysteresis in terms of water content between the sorption (𝑚𝑤,𝑠) and desorption (𝑚𝑤,𝑑) isotherms. A closer analysis of this aspect is provided in Fig. S7 where the hysteresis effect is represented as the percentage of 𝑚𝑤,𝑑− 𝑚𝑤,𝑠 and plotted as a function of water activity. In
general, the hysteresis effect is similar for all studied PGM and BSM films, irrespective of film thickness, which implies that the observed hysteresis is not limited by diffusion of water inside 20
the mucin films. In conclusion, the collection of experiments performed on mucin films with varying thicknesses and with varying scan rates indicates that these parameters have no effect on the sorption behavior in the studied range with the HS QCM-D methodology. This
23
conclusion may be put in context of the expected difference in time scales for diffusion in the glassy and rubbery states. The characteristic half-time 𝜏1/2 required to diffuse a rms distance equal to the thickness of a (mucin) film can be estimated according to:
𝜏1/2 = 𝑑2
2𝐷(𝑎𝑤) (4)
In eq. 4, 𝑑 is the distance (here corresponding to the film thickness) and 𝐷(𝑎𝑤) is the diffusion coefficient of water inside the film, which is dependent on the water activity (aw) of the system.
5
The value of 𝐷(𝑎𝑤) is not accurately known for the broad range of water activities in the mucin polymers studied here. However, a similar trend is seen in data for different systems where 𝐷(𝑎𝑤) decreases, in some cases by orders of magnitude, upon dehydration.27-29 For example,
the diffusion coefficient of water in the biopolymer amylose29 changes merely a factor of 3,
from about 310-11 m2/s at a
w ≈ 1 to 110-11 m2/s at aw ≈ 0.2, while the water diffusion in
10
disaccharides27-28 (maltose or sucrose) changes several orders of magnitude, from 10-9 m2/s at
aw ≈ 1 to 10-16 m2/s at aw ≈ 0.2. For the sake of argument, using the diffusion coefficients of
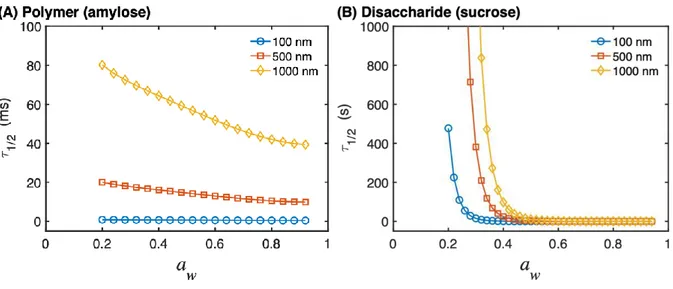
water in these systems, as a function of water activity (see Fig. S8), the characteristic times required for a water molecule to transverse films with varying thicknesses was calculated according to eq. 4. The results are presented in Fig. 5A for water diffusion in a polymer 15
24
Figure 5. The characteristic half-time 𝜏1/2 required to diffuse a rms distance equal to 100, 500, or 1000 nm in (A) the biopolymer amylose and in (B) the disaccharide sucrose. The characteristic diffusion time was calculated with eq. 4 and the distances were selected to represent similar distances as the thicknesses of the mucin films investigated here. Note that 5
the time is given in milliseconds in (A) and in seconds in (B).
The fact that all sorption isotherms (see Fig. 1) are very similar implies that the water sorption behavior is not limited by the time required for water to diffuse inside the mucin film, neither in the rubbery nor the glassy state. If this was not the case it would be expected that the water content of a thick film would be lower as compared to the water content of a thin film during 10
sorption due to insufficient time to reach the equilibrium water content, which is not the case (see Fig. 1). Likewise, it would be expected that a desorption isotherm obtained with a thick film would contain more water and consequently result in a higher difference in the water content between the sorption-desorption isotherms, as compared to the case of a thin film, which is not the case (see Fig. S7). These findings imply that the water diffusion is relatively 15
fast inside the mucin films, perhaps similar to the diffusion in amylose in Fig. 5A, and occurs in time scales of milliseconds-seconds. This time scale can be related to the scan rates of the
25
water activity; for example, the scan rate for the sorption experiment performed on the thickest film was approximately 0.1 aw-units per 3600 seconds (i.e. one hour). In other words, the
changes of the water activity occurred in all cases at much slower time scales, as compared to the time required to equilibrate the water content by diffusion inside the mucin films. Still, at low water activities, the time required to diffuse through a glassy film can be the limiting factor 5
and strongly increase the hysteresis effect. For example, the characteristic diffusion time through a sucrose film with 1000 nm thickness is drastically increased below aw ≈ 0.4.
However, there is no indication in the present study that the glass transition, which occurs around aw ≈ 0.76-0.78 (see Table 1), drastically decrease the water diffusion in mucin films and
influence the water sorption-desorption isotherms of the mucin films with varying thicknesses. 10
Therefore, water diffusion inside the mucin matrix is concluded to not constitute a limiting factor in the present HS QCM-D experiments.
Diffusion in glassy polymers is sometimes discussed in association with models developed primarily for sorption of solvent molecules into an immersed sample of a glassy polymer, a situation usually referred to as case II diffusion.30-31 In general, this situation implies that the
15
activity is close to zero inside the glassy polymer and unity in the solvent outside, at start of the experiment. In fact, most literature dealing with case II diffusion involves a similar situation where the swelling of glassy polymers is investigated from an essentially dry state to a fully swollen state.32 In this case, the diffusion can be characterized by the rate of the movement of
a sharp boundary, which separates the glassy and the rubbery states. However, this condition is 20
different as compared to the experimental situation investigated here where the mucin film is exposed to relatively small changes of the water activity over relatively extended time scales.
26
Hydration-induced rheological changes Drop-coated films versus spin-coated films
We have previously investigated the hydration behavior of spin- and drop-coated lysozyme films and concluded that the deposition technique used to prepare the films influence the film distribution and surface roughness, which was clearly observed by optical microscopy.5 In
5
general, spin-coated films are relatively homogenous and appropriate for QCM-D experiments with the aim to measure the mass of sorbed or desorbed water for determination of isotherms, as illustrated in this work. However, to identify hydration-induced changes of the rheological properties of the film from QCM-D experiments it is more suitable to perform experiments on drop-coated films that are associated with significant hydration-induced changes of the 10
frequency and dissipation data.5 The most likely reason for this is that drop-coated films are
relatively heterogenous, with peaks and valleys, which implies that some regions of the film is less supported by its surrounding material. This can lead to drastic changes of the QCM-D data due to, for example, a hydration-induced glass transition from the glassy state into a more fluid-like state, after which the less supported peaks are effective in dissipating the energy of the 15
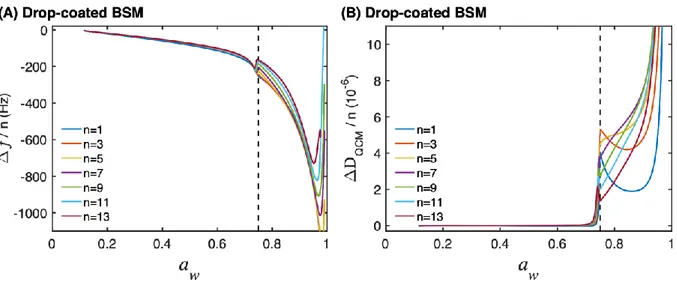
oscillating quartz sensor. To illustrate this, Fig. 6 show ∆f/n and ∆DQCM/n data as a function of
aw for a drop-coated BSM film with 140 nm thickness. The results clearly show that ∆f/n and
∆DQCM/n changes significantly at aw ≈ 0.75, which is in the same region of aw where the
desorption branch starts to deviate from the sorption branch due to hysteresis (cf. Fig. 2 and Table 1). This implies that the water sorption behavior of the mucin film is related to a 20
27
Figure 6. (A) Frequency and (B) dissipation data as a function of aw for a drop-coated BSM
film (140 nm). The vertical dashed line is located at aw = 0.75, or 20 wt. % water content, where
the glass transition occurs.
Additional information on the rheological properties of the film can be extracted by treating the 5
data according to the model of a single viscoelastic film in air26 where the ratio between the
shear storage modulus (𝐺f′) and shear loss modulus (𝐺
f′′) can be used to describe the elastic
behavior (𝐺f′) in relation to the viscous properties (𝐺
f′′) of the film.8, 14 This is achieved by the
following equation: 𝐺f′
𝐺f′′ =
−∆𝑓n+ ∆𝑓n (n→0)
∆Γn (3)
where ∆𝑓n (n→0) is obtained by extrapolating the linear fit of ∆𝑓n versus 𝑛2 to 𝑛 = 0 and ∆Γ n=
10
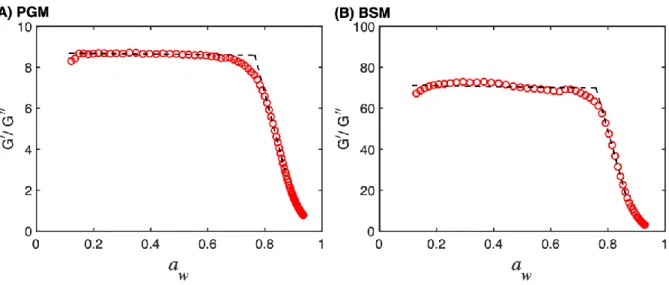
∆Γ 𝑛⁄ is the half-band-half-width of the 𝑛th overtone and related to 𝐷 and 𝑓 according to Γ = 𝐷𝑓 2⁄ . The evaluation of this ratio is presented in Fig. 7 for (A) PGM and (B) BSM and shows the same general features with high, and relatively constant, values at low water activities and continuously decreasing values of the ratio above aw ≈ 0.75. This implies that the films behave
more as elastic solids below aw ≈ 0.75 (i.e. the elastic behavior is dominating), while the films
28
become more and more fluid-like above aw ≈ 0.75 (i.e. the viscous behavior become more
dominating).
Figure 7. Ratio of shear storage modulus (𝐺f′) and shear loss modulus (𝐺
f′′) as a function of aw
for (A) PGM (1321 nm) and (B) BSM (234 nm). The black dashed lines are linear fits of 𝐺f′ 𝐺 f′′
⁄ 5
before and after the glass transition water activity at 25 °C; the water activities where the lines cross is aw = 0.765 for PGM and aw = 0.758 for BSM, respectively (see Table 1).
Can hysteresis be understood by the free volume theory?
As we showed above, the water sorption-desorption hysteresis in mucin films cannot be explained by slow diffusion of water. The hysteresis phenomenon can however be rationalized 10
within the framework of the free volume theory as proposed by Vrentas and Vrentas.22 This
theory relates the sorption isotherm in the glassy state of a polymer to the limiting case of an equilibrium sorption isotherm, which would exist if the glass transition did not occur, at otherwise identical conditions. According to the theory, the glassy state is considered to be obtained by cooling down the liquid-like polymer from a temperature above the glass transition 15
to the temperature of the sorption experiment. Below the glass transition temperature, the heat capacities of the glassy and liquid-like polymers are different, which means that the cooling
29
process will produce a glassy state with a different Gibbs energy, as compared to the liquid-like state. The difference in Gibbs energies results in a situation where the water activities observed in the hypothetical liquid-like state is different as compared to the glassy state. Following the Vrentas-Vrentas approach, the water activity in the glassy state is described by the following equation:
5
𝑎𝑤,𝑠 = 𝜙1exp(𝜙2+ 𝜒𝜙22) exp (𝐹) (6)
where 𝑎𝑤 is the water activity during sorption (indicated by the subscript s), 𝜒 is the
Flory-Huggins interaction parameter, 𝜙1 is the volume fraction of water, and 𝜙2 is the volume fraction of the polymer. The parameter 𝐹 is related to the difference between the polymer specific heat capacities in the glassy (𝑐̂𝑝𝑔) and in the liquid-like (𝑐̂𝑝) states and to the absorbates capacity to depress the glass transition temperature 𝑇𝑔𝑚 for the polymer-absorbate mixture
10 according to eq. 7. 𝐹 = 𝑀1𝜔2 2(𝑐̂ 𝑝𝑔− 𝑐̂𝑝) 𝑑𝑇𝑔𝑚 𝑑𝜔1 𝑅𝑇 ( 𝑇 𝑇𝑔𝑚− 1) (7)
In eq. 7, 𝑀1 is the molecular weight of water, 𝜔1 is the mass fraction of water and 𝜔2 is the mass fraction of the polymer. From eq. 7 it is clear that the parameter 𝐹 is equal to zero when 𝑇 = 𝑇𝑔𝑚, at which eq. 6 reduces to the Flory-Huggins equation that is valid when the mixture
is in a liquid-like state (i.e. 𝑇 ≥ 𝑇𝑔𝑚). In the glassy state, when 𝑇 < 𝑇𝑔𝑚, this parameter is 15
negative (i.e. 𝐹 < 0).
The difference between the hypothetical equilibrium water activity and the water activity observed during the sorption process is thus dependent on the thermal history, although Vrentas
30
and Vrentas21 claim that “it appears that the volumetric and sorption behavior of the system is
not overly sensitive to the exact sample preparation history when penetrant added to the system”. In the desorption case, the thermal history of the system is different as compared to the sorption experiment; the desorption process is performed at constant temperature and hence the glass transition occurs isothermally. This type of sample history does not, however, result 5
in any equations that are different from eqs. 6 and 7. Instead, in order to account for the difference between the sorption and desorption behaviors, an empirical coefficient 𝑘2 is introduced. This coefficient describes the ratio of the deviations of the Gibbs energy of the polymer in the glassy state (𝐺̂2𝑔0 ) from the equilibrium conditions (𝐺̂
20) during the desorption
(d) and the sorption (s) processes: 10
[𝐺̂2𝑔0 (𝜔
1, 𝑇)]𝑑 − 𝐺̂20(𝑇) = 𝑘2{[𝐺̂2𝑔0 (𝜔1, 𝑇)]𝑠− 𝐺̂20(𝑇)} (8)
Then, the equation for the water activity during the desorption process (indicated by the subscript d) has the following form:
𝑎𝑤,𝑑 = 𝜙1exp(𝜙2+ 𝜒𝜙22) exp (𝐹𝑘
2) (9)
Since mucins are very complex substances that include various structural units, e.g. bottle-brushes and protein globules, such a simple model as Flory-Huggins is not appropriate for quantitative description of their water sorption isotherms. Therefore, instead of directly using 15
eqs. 6 and 9, for describing the sorption and desorption branches, we take the ratio of 𝑎𝑤,𝑠/𝑎𝑤,𝑑:
𝑎𝑤,𝑠
𝑎𝑤,𝑑 =
𝜙1exp(𝜙2+ 𝜒𝜙22) exp (𝐹)
𝜙1exp(𝜙2+ 𝜒𝜙22) exp (𝐹𝑘
2). (10)
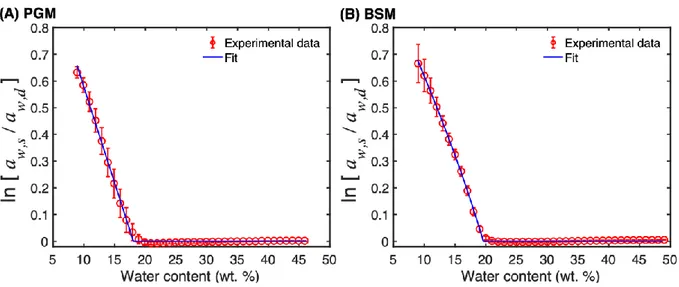
31 ln [𝑎𝑤,𝑠
𝑎𝑤,𝑑] = 𝐹(1 − 𝑘2). (11)
Since parameter F is concentration dependent, the left-hand side of eq. 11 can be evaluated as function of water content. The logarithm of activity ratio ln[𝑎𝑤,𝑠⁄𝑎𝑤,𝑑] as a function of water content for both PGM and BSM is shown in Fig 8.
Figure 8. The logarithm of the water activities ratio for (A) PGM and (B) BSM as a function of 5
water content. The red curves are experimental data and the blue curves are fitted data according to eq. 12.
To explain the results presented in Fig. 8 we can start by noting that the parameter 𝐹 is expected to go to zero when the temperature 𝑇 is equal to the glass transition temperature of the mixture 𝑇𝑔𝑚 (cf. eq. 7), while in the glassy state, when 𝑇 < 𝑇𝑔𝑚, this parameter is negative (i.e. 𝐹 < 0).
10
In addition, the Flory-Huggins equation is expected to be valid when the mixture is in a liquid-like state (i.e. 𝑇 ≥ 𝑇𝑔𝑚). Thus, the evaluation in Fig. 8 can be used to determine the concentration of water required to depress the glass transition temperature of the mucin-water mixture to 25 °C (which is the experimental temperature here). For this, the linear part of
32
ln[𝑎𝑤,𝑠⁄𝑎𝑤,𝑑] at water contents between about 10-15 wt. % was used to extrapolate ln[𝑎𝑤,𝑠⁄𝑎𝑤,𝑑] = 0, which occurs at 18.3 wt. % for PGM and 20.1 wt. % for BSM (see Table
1).
Furthermore, fitting the dependence of the logarithm of the activity ratio on the water content, one can estimate the parameters of eqs. 7 and 11. For this purpose, eqs. 7 and 11 can be 5
rearranged in the following way:
ln [𝑎𝑤,𝑠 𝑎𝑤,𝑑] = 𝑤12𝑘3𝐴 ( 1 𝑇𝑔2− 𝐴𝑤1− 1 𝑇) (12) where 𝑘3 = (1 − 𝑘2)𝑀1(𝑐̂𝑝𝑔− 𝑐̂𝑝) 𝑅 (13)
and 𝑅 is the gas constant. Eq. 12 contains three fitting parameters: the slope of the glass transition line 𝐴, the glass transition temperature of the pure polymer 𝑇𝑔2 and the constant 𝑘3,
which combines the change of the heat capacity and the constant 𝑘2 (see eq. 8 for the definition 10
of 𝑘2). The fitting of the experimental data using eq. 12 is included in Fig 8 and the fitting parameters are presented in Table 2.
Table 2. Summary of fitting parameters of eq. 12 obtained for PGM and BSM.
Parameter in eq. 12 PGM BSM
𝐴 1751 ± 312 1832 ± 958
𝑇𝑔2 (K) 610 ± 70 655 ± 181
𝑘3 -0.403 ± 0.119 -0.477 ± 0.404
As one can see from Fig. 8, eq. 12 reproduces the experimental data on sorption-desorption hysteresis very well and the parameters shown in Table 2 have reasonable values. One should, 15
33
the results, which is probably the reason for high values of standard deviations shown in Table 2. Unfortunately, the parameter 𝑘2, which characterizes the hysteresis in the Vrentas-Vrentas model cannot be obtained directly from fitting if the change of heat capacity at the glass transition is not known.
Another limitation of this approach is the constant value of the slope of the glass transition line 5
𝐴. It is well-known that the slope of the glass transition line is not constant in biopolymer systems and, typically, the slope is highest close to the dry polymer. Several approaches have been proposed for estimating the glass transition temperature of mixtures based on knowledge of the properties of the pure components and one of the most popular equations for predicting the transition line is the Gordon-Taylor equation.33 However, perhaps surprisingly, using this
10
equation, instead of a constant value of the slope 𝐴, does not produce neither better nor more stable fitting (data not shown). The reason for this can be due to the fact that the parameter 𝑘2 is not necessarily constant in the whole range of water contents of the glassy state. Indeed, the constant value of this parameter is an assumption made by Vrentas and Vrentas21 and to the
best of our knowledge, does not have a thermodynamic justification. 15
From the discussion above we conclude that the Vrentas-Vrentas model can describe water sorption-desorption hysteresis in the mucin systems, where the limiting stage of the process is not due to slow water diffusion. The model, however, describes the difference between sorption in the glassy and liquid states based on the thermal properties of the glass transition in the binary system and does not explicitly take into account the direction of the process. It is important to 20
note that in the experiments described here, there is no difference in thermal history of the sample during sorption and desorption. Indeed, the liquid sample is deposited on the sensor at room temperature and then drying is performed at the same temperature. After that, the sorption
34
experiment is followed by a desorption experiment, both conducted at 25 ºC. Thus, the only difference between the sorption and desorption experiments is in the direction of the process. Since glassy systems are associated with long relaxation times, an alternative way to describe the hysteresis effect would be to use a rheological approach, where the material is modelled using concentration-dependent (or activity-dependent) viscosity and elastic moduli. Then the 5
times needed to achieve the equilibrium state are much longer than the experimental times, which results in sorption-desorption hysteresis due to direction of the process. However, this is beyond the scope of this study.
Conclusions
In this work we present results on the water sorption-desorption behavior of thin mucin films 10
( 100 to 1000 nm), which show clear hysteresis effects related to their hydration history and not to their thermal history. The experiments are performed with a recently developed technique based on humidity scanning (HS) QCM-D and the studied mucin films consist of either pig gastric mucin (PGM) or bovine submaxillary gland mucin (BSM). The results clearly show that the sorption behavior of thin mucin films is associated with hysteresis between the sorption and 15
desorption branches. In particular, the mucin films have nanoscale thicknesses, but still show similar hysteresis effects as those typically observed in bulk samples.14 The hydration-induced
glass transition, resolved from monitoring the rheological behavior of the films, is in excellent agreement with the onset of the sorption-desorption hysteresis for both mucin films. The glass transition for PGM at 25°C occurs at aw = 0.75 ± 0.02, corresponding to a water content of 19.1
20
± 0.7 %. For BSM, these values are aw = 0.76 ± 0.02 and 20.4 ± 1.0 %.
The technique is shown to be very suitable to discriminate between the case of diffusion limiting processes and processes related to the sample history in terms of their hydration. Notably, we
35
show that the sorption-desorption kinetics is neither governed by transport of water through the vapor phase, as previously shown for 10-100 µm thick complex salt films,9 nor by water
diffusion inside the mucin films. In other words, slow water transport from the vapor phase to the mucin film, or slow diffusion of water inside the mucin film, irrespective of the glassy or liquid-like state of the mucin, is not the reason for hysteresis in the present HS QCM-D 5
experiments. The observed hysteresis can be rationalized by differences of the mucin structure depending on the sample history in terms of hydration. Thus, the only difference between the sorption and desorption experiments is in the direction of the hydration process. The Vrentas-Vrentas model20-22 can partly describe the observed water sorption-desorption hysteresis.
However, our work illustrates that some of the assumptions of the model are not accurate, which 10
should be investigated in future work in more detail.
Supporting Information
The Supporting Information contains Figures S1-S8 and is available free of charge.
Acknowledgements
We are grateful to Biofilms – Research Center for Biointerfaces (Malmö University) and the 15
Gustav Th Ohlsson Foundation for financial support. Björklund also acknowledge the Knowledge Foundation (grant number 20150032), the Crafoord Foundation (grant number 20180740) and Malmö University (career support grant LED 1.3-2017/498) for financial support.
References
1. Björklund, S.; Nowacka, A.; Bouwstra, J. A.; Sparr, E.; Topgaard, D., Characterization of 20
stratum corneum molecular dynamics by natural-abundance 13C solid-state NMR. PLoS ONE 2013, 8 (4), e61889.
36
2. Butovich, I. A.; Millar, T. J.; Ham, B. M., Understanding and analyzing meibomian lipids - A review. Current Eye Research 2008, 33, 405.
3. Znamenskaya, Y.; Sotres, J.; Gavryushov, S.; Engblom, J.; Arnebrant, T.; Kocherbitov, V., Water Sorption and Glass Transition of Pig Gastric Mucin Studied by QCM-D. Journal of
Physical Chemistry B 2013, 117 (8), 2554-2563.
5
4. Falk, Y. Z.; Engblom, J.; Pedersen, J. S.; Arnebrant, T.; Kocherbitov, V., Effects of Hydration on Structure and Phase Behavior of Pig Gastric Mucin Elucidated by SAXS. Journal of
Physical Chemistry B 2018, 122 (30), 7539-7546.
5. Björklund, S.; Kocherbitov, V., Humidity scanning quartz crystal microbalance with dissipation monitoring setup for determination of sorption-desorption isotherms and 10
rheological changes. Review of Scientific Instruments 2015, 86 (5), 055105.
6. Björklund, S.; Kocherbitov, V., Hydration-Induced Phase Transitions in Surfactant and Lipid Films. Langmuir 2016, 32 (21), 5223-5232.
7. Gonzalez-Martinez, J. F.; Znamenskaya, Y.; Björklund, S.; Erkselius, S.; Rehnberg, N.; Sotres, J., Humidity-induced phase transitions of surfactants embedded in latex coatings can 15
drastically alter their water barrier and mechanical properties. Polymers 2018, 10 (284), 1-16. 8. Graf, G.; Kocherbitov, V., Determination of Sorption Isotherm and Rheological Properties of Lysozyme Using a High-Resolution Humidity Scanning QCM-D Technique. Journal of
Physical Chemistry B 2013, 117 (34), 10017-10026.
9. Gustavsson, C.; Piculell, L., Isotherms and Kinetics of Water Vapor Sorption/Desorption for 20
Surface Films of Polyion-Surfactant Ion Complex Salts. Journal of Physical Chemistry B 2016,
37
10. Kocherbitov, V.; Arnebrant, T., Hydration of Lysozyme: The Protein-Protein Interface and the Enthalpy-Entropy Compensation. Langmuir 2010, 26 (6), 3918-3922.
11. Kocherbitov, V.; Ulvenlund, S.; Kober, M.; Jarring, K.; Arnebrant, T., Hydration of microcrystalline cellulose and milled cellulose studied by sorption calorimetry. Journal of
Physical Chemistry B 2008, 112 (12), 3728-3734.
5
12. Vogt, B. D.; Soles, C. L.; Lee, H. J.; Lin, E. K.; Wu, W. L., Moisture absorption and absorption kinetics in polyelectrolyte films: Influence of film thickness. Langmuir 2004, 20 (4), 1453-1458.
13. Znamenskaya, Y.; Björklund, S.; Kocherbitov, V.; Alfredsson, V., Effect of hydration and dehydration on the properties of SBA-15 layer studied by humidity scanning QCM-D. 10
Microporous and Mesoporous Materials 2016, 230, 58-65.
14. Znamenskaya, Y.; Sotres, J.; Engblom, J.; Arnebrant, T.; Kocherbitov, V., Effect of Hydration on Structural and Thermodynamic Properties of Pig Gastric and Bovine Submaxillary Gland Mucins. Journal of Physical Chemistry B 2012, 116 (16), 5047-5055. 15. Langmuir, I., The adsorption of gases on plane surfaces of glass, mica and platinum. Journal 15
of the American Chemical Society 1918, 40, 1361-1403.
16. Brunauer, S.; Emmett, P. H.; Teller, E., Adsorption of gases in multimolecular layers.
Journal of the American Chemical Society 1938, 60, 309-319.
17. Björklund, S.; Kocherbitov, V., Alcohols react with MCM-41 at room temperature and chemically modify mesoporous silica. Scientific Reports 2017, 7 (9960), 1-11.
38
18. Barrett, E. P.; Joyner, L. G.; Halenda, P. P., The determination of pore volume and area distributions in porous substances. 1. Computations from nitrogen isotherms. Journal of the
American Chemical Society 1951, 73 (1), 373-380.
19. Michaels, A. S.; Vieth, W. R.; Barrie, J. A., Solution of Gases in Polyethylene Terephthalate. Journal of Applied Physics 1963, 34 (1), 1-12.
5
20. Vrentas, J. S.; Duda, J. L., Diffusion in polymer—solvent systems. I. Reexamination of the free-volume theory. Journal of Polymer Science: Polymer Physics Edition 1977, 15 (3), 403-416.
21. Vrentas, J. S.; Vrentas, C. M., Hysteresis effects for sorption in glassy polymers.
Macromolecules 1996, 29 (12), 4391-4396.
10
22. Vrentas, J. S.; Vrentas, C. M., Sorption in Glassy Polymers. Macromolecules 1991, 24 (9), 2404-2412.
23. Robinson, R. A., The Water Activities Of Lithium Chloride Solutions Up To High Concentrations At 25 Degrees. Transactions of the Faraday Society 1945, 41 (11-1), 756-758. 24. Dixon, M. C., Quartz crystal microbalance with dissipation monitoring: enabling real-time 15
characterization of biological materials and their interactions. Journal of Biomolecular
Techniques 2008, 19 (3), 151.
25. Sauerbrey, G., Verwendung Von Schwingquarzen Zur Wägung Dünner Schichten Und Zur Mikrowägung. Zeitschrift Fur Physik 1959, 155 (2), 206-222.
26. Johannsmann, D., Viscoelastic analysis of organic thin films on quartz resonators. 20
39
27. Price, H. C.; Murray, B. J.; Mattsson, J.; O'Sullivan, D.; Wilson, T. W.; Baustian, K. J.; Benning, L. G., Quantifying water diffusion in high-viscosity and glassy aqueous solutions using a Raman isotope tracer method. Atmospheric Chemistry and Physics 2014, 14 (8), 3817-3830.
28. Zhu, L.; Cai, T.; Huang, J.; Stringfellow, T. C.; Wall, M.; Yu, L., Water Self-Diffusion in 5
Glassy and Liquid Maltose Measured by Raman Microscopy and NMR. Journal of Physical
Chemistry B 2011, 115 (19), 5849-5855.
29. Russo, M. A. L.; Strounina, E.; Waret, M.; Nicholson, T.; Truss, R.; Halley, P. J., A study of water diffusion into a high-amylose starch blend: The effect of moisture content and temperature. Biomacromolecules 2007, 8 (1), 296-301.
10
30. Alfrey Jr., T.; Gurnee, E. F.; Lloyd, W. G., Diffusion in glassy polymers. Journal of Polymer
Science Part C: Polymer Symposia 1966, 12 (1), 249-261.
31. Thomas, N. L.; Windle, A. H., A THEORY OF CASE-II DIFFUSION. Polymer 1982, 23 (4), 529-542.
32. De Kee, D.; Liu, Q.; Hinestroza, J., Viscoelastic (non-fickian) diffusion. Canadian Journal 15
of Chemical Engineering 2005, 83 (6), 913-929.
33. Gordon, M.; Taylor, J. S., Ideal copolymers and the 2nd-order transitions of synthetic rubbers .1. Non-crystalline copolymers. Journal of Applied Chemistry 1952, 2 (9), 493-500.