DETERMINATION OF FOSSIL SHARE
IN COMBUSTION OF WASTE
Development of a novel method using NIR spectroscopy to predict the content
of plastics in RDF-material
CHRISTIAN DAHL
School of Business, Society and Engineering Kurs: Degree project energy engineering Kurskod: ERA403
Ämne: Energiteknik Högskolepoäng: 30 hp
Program: Master of science in engineering – energy systems
Handledare: Ioanna Aslanidou Examinator: Erik Dahlquist
Uppdragsgivare: Mälardalens högskola Datum: 2018-05-24
E-post:
ABSTRACT
Incineration of waste materials has become a common way to handle a worldwide increase of produced waste materials. The problem with waste as fuel is that the material is not
homogeneous and include a mixture of fossils and renewables. The fossil part ends up in an emission of fossil carbon dioxide in a combustion process, which is included in the emissions trading system. However, since waste material varies a lot in composition depending on the time of the year, origins, etc. it is preferable to have a method for real-time measurement of the fossil share of combusted waste. No real-time measurement technologies are available today which is the reason to investigate if near-infrared (NIR) spectroscopy could be a potential solution.
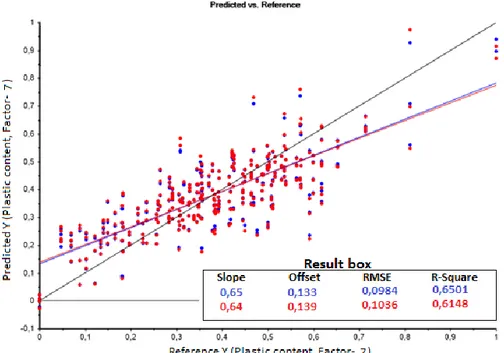
An artificial mixture of refused derived fuel has been used to investigate the possibilities of NIR for prediction of the fossil share in waste material. The fossil share is assumed to be equal to the content of plastic material with an origin of oil products. Mixtures with different plastic content are scanned by the NIR instrument to obtain individual absorption spectra. A Partial least square (PLS) regression model is created on measured spectra and known content of plastics. The best model for the prediction on new spectral data using one of four measured replicates is a PLS model preprocessed with Savitzky-Golay smoothing that gives an 𝑅2 of 0,782. If the prediction is done, depending on a delimitated wavenumber interval
and an average of all four replicates is the best model instead of a PLS model pre-processed with standard normal variate without seven outliers that have an 𝑅2 of 0,81. 𝑅2 is the
coefficient of determination which has been used to figure out the best model. An 𝑅2 above
0,65 are recommended for process modelling, where 1 is the highest possible value.
Keywords: NIR, Near infra-red, spectroscopy, chemometrics, waste material, fossil share,
PREFACE
This is a degree project to obtain a master’s in science of engineering with a focus on energy systems at MDH University in Västerås. The work has been done after an idea by Jan Skvaril, Assistant Professor in Energy Engineering at MDH, with a goal to end up in a technology that could be implemented in waste to energy plants. An interesting topic where the NIR
technology applies to a relatively new research area connected to the control of emissions of carbon dioxide. The possibility to be a part of a new scientific field of NIR spectroscopy was the main driving force to fulfil the work.
I would like to thank my supervisor Ioanna Aslanidou for guidelines during the work and especially the structuring and content of the report. I will also thank Jan Skvaril for
instructions in the practical part involving how to use NIR instrument and also modelling in the unscramble software.
Finally, I would like to thank myself for a well-structured work that was submitted in time to the expected deadlines.
Västerås in June 2018
____________________________________________ Christian Dahl
SAMMANFATTNING
Förbränning av sopor har vuxit fram som en primär lösning på problemet med en global ökning av producerad mängd sopor. Miljökraven för hantering av avfall skärps succesivt, vilket har medfört att deponi av sopor som historiskt sett varit det billigaste alternativet erlagts med höga miljöavgifter inom EU. Hårdare miljökrav och högre avgifter har bidragit till att deponi idag endast används som en sista åtgärd för avfallshantering. Istället har alternativet att exportera sopor för förbränning i länder som Sverige och Danmark, där fjärrvärmenätet är väl utbyggt, blivit ett ekonomiskt fördelaktigt alternativt. Problemet för svenska förbränningsanläggningar är att de årligen ska redovisa det totala utsläppet av fossil koldioxid och tillhandahålla motsvarande mängd utsläppsrätter. Med sopor som bränsle varierar bränslesammansättningen beroende på när och var soporna hämtats, vilket försvårar kontrollen av utsläppen jämfört med ett homogent bränsle.
Nuvarande mätmetoder för att avgöra den fossila andelen genomförs huvudsakligen utifrån mätningar i förbränningsanläggningen i kombination med laboratorieanalys. Kol-14 metoden är ett alternativ, liksom manuell sortering utav ett bränsle prov. Problemet är att metoderna är tidskrävande och inte kan ske i realtid, samtidigt som bränslet har en stor variation i sammansättning. En ny metod som mäter bränslesammansättningen och den fossila andelen i realtid skulle därför vara ett bättre alternativ.
I det här examensarbetet utvärderas nära infraröd spektroskopi (NIR) som ett alternativ till dagens mätmetoder. Teoretiskt set så är NIR intressant då tekniken bygger på kemisk absorptions av NIR-ljus beroende på specifika kemiska bindningar i undersökta material. Frågan är således ifall NIR kan urskilja den fossila plasten i en mix av sopor, och med vilken noggrannhet den fossila andelen kan prediceras.
Arbetet är uppdelat i två delar. Den första inkluderar mätningar där en konstgjord mix av sopor med varierande halt av plast (symboliserar den fossila andelen) scannas av NIR instrumentet. Mätningarna sker i laboratoriemiljö där materialet placeras på en roterande platta för att illustrera sopor på ett transportband. Beroende på sammansättning av
materialet absorberas olika våglängder av NIR ljuset vilket ger ett absorptionsspektrum med toppar där ljuset absorberats av materialet.
I den andra delen av arbetet skapas en regressionsmodell utifrån uppmätt NIR spektrum och förbestämda plasthalter i de olika materialmixarna. Modellerna skapas i datorprogrammet Unscrambler, och är resultatet som visar hur väl NIR kan predicera plasthalten i en okänd mix av sopor.
Resultatet visar att NIR har potential att användas för mätning av plasthalt (fossil andel) i sopor på väg in i en förbränningsanläggning. Prediktionsförmågan bestäms utifrån en determinationskoefficient, 𝑅2, där 1 är max och över 0,65 är rekommenderat för
processindustrier. De bästa modellerna erhåller ett 𝑅2 på ca 0,7 efter förbehandling av NIR
spektrumen vilket är över 0,65. Jämfört med tidigare studier för prediktion av plasthalter utifrån NIR så är ett 𝑅2 över 0,9 erhållet vilket är betydligt högre än 0,7. Skillnader i
mätmetod är att tidigare studier i huvudsak använder NIR på väl synligt plastmaterial. I det här examensarbetet används istället ett mer mixat material där plasten till viss del är dold under papper, tyg, och matrester. Den lägre prediktionsförmågan i ett mixat material visar
att NIR i RDF kan prediktera plasthalten, men med lägre prediktionskraft än vid väl synligt plast. Vidare studier behövs för att undersöka noggrannheten när prediktionsresultatet överförs till motsvarande utsläpp av koldioxid vid förbränning.
Nyckelord: Sopor, förbränning, fossilt bränsle, NIR, nära infraröd strålning,
CONTENT
1 INTRODUCTION ...1
1.1 Background ... 1
1.1.1 Import of waste materials ... 2
1.1.2 Description of the technical area (scope) ... 2
1.2 Purpose and research questions ... 3
1.3 Delimitations ... 4
2 LITERATURE REVIEW ...5
2.1 Composition of waste ... 6
2.2 Example of RDF preparation at WTE plant in Västerås ... 8
2.3 Plastics ... 9
2.4 General NIR spectroscopy technology ...10
2.5 Applications and usage of NIR spectroscopy ...12
2.6 NIR spectroscopy related to plastic materials...13
3 METHODOLOGY ... 14
3.1 Artificial Mixture of RDF, and presentation of used materials ...14
3.2 Preparation of RDF mixtures ...16
3.3 NIR spectroscopy of RDF mixtures ...18
3.4 Pre-processing of NIR spectral data ...19
3.5 Chemometric of regression model ...21
3.6 Prediction ability of PLS model ...23
3.7 Workflow of the methodology ...24
4 RESULTS ... 26
4.1 Raw spectral data and PLS without pre-processing ...26
4.3 Savitzky-Golay 2nd derivatives pre-processing ...31
4.4 Baseline transformation pre-processing ...34
4.5 Savitzky-Golay smoothing ...37
4.6 Standard Normal Variate pre-processing ...39
4.6.1 Standard Normal Variate + 2nd derivatives pre-processing ...42
4.7 Summary and comparison of model prediction results ...44
4.8 Effects of delimitation in wavenumber interval ...47
5 DISCUSSION... 51
5.1 Results ...51
5.1.1 Delimitate the NIR spectral wavenumber ...53
5.1.2 Comparison to earlier studies ...54
5.2 Method discussion ...54
5.3 Sustainability ...55
6 CONCLUSIONS ... 57
7 FUTURE WORK ... 58
REFERENCES ... 59
APPENDIX 1 – Mass of Mixture compositions APPENDIX 2 – NIR spectral settings APPENDIX 3 – Raw NIR spectra of calibration- and validation data set APPENDIX 4 – Extended results of prediction ability of PLS models APPENDIX 5 – Regression coefficients plots of pre-processed PLS models
LIST OF FIGURES
Figure 1 overview of a general fuel composition ... 5Figure 2 composition of MSW and RDF in Spain divided into main components as organic matter, plastic, paper with more, data received from Montejo et al. (2011) ... 7
Figure 3 fuel preparation at Mälarenergi heat and power plant located in Västerås ... 9 Figure 4 fractions of different plastic types divided between MSW and RDF, produced in
Spain, data received from Montejo et al. (2011) ... 10 Figure 5 organic waste material after drying in 70℃ during 6 hours ... 15 Figure 6 example picture of a sample mixture of paper, textile, wood, organic wastes and
different plastic materials, before- (left figure) and in measurements (right figure) ...16 Figure 7 setup of the NIR spectral instruments above the rotating plate, number 1 is a Bruker
FT-NIR spectrometer used for this degree project ... 18 Figure 8 Example of raw spectral data including extreme spectra’s, noisy spectra, and clean
spectra's (examples of own measured spectra) ... 20 Figure 9 explained variance of created regression model depend on the number of factors;
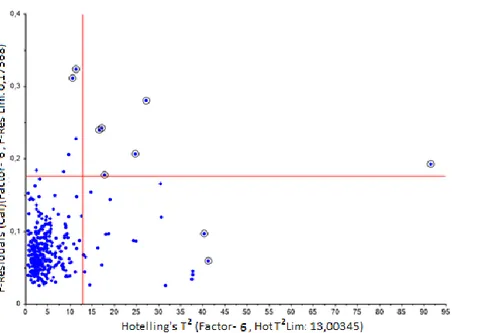
red line belongs to the cross-validation and blue line to the calibration ... 22 Figure 10 overview of potential outliers in spectral data shown in score plot with Hotelling’s
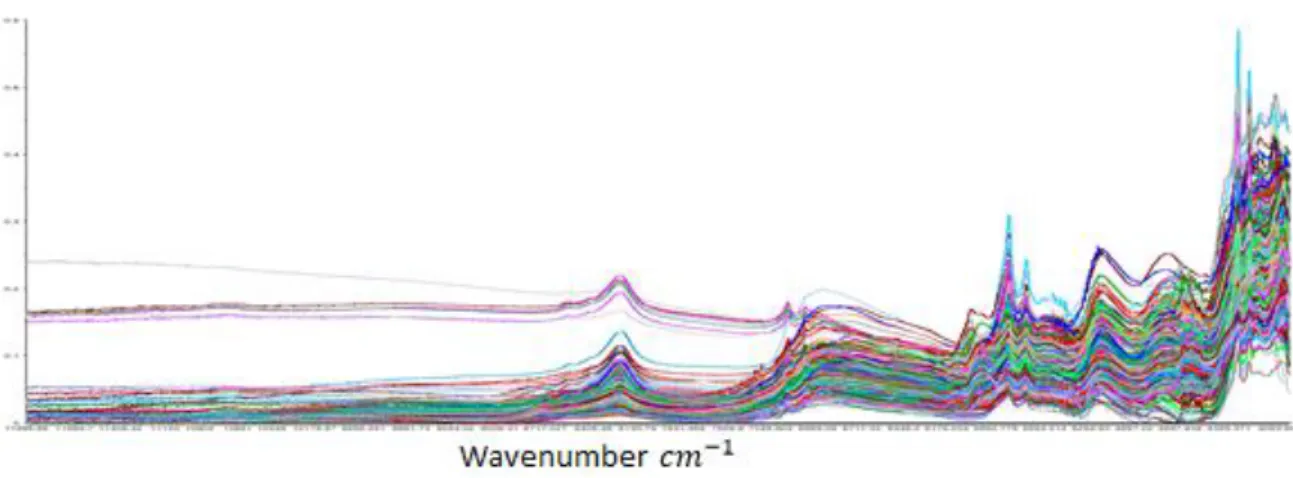
𝑇2 ellipse and in an influence plot with Hotelling’s 𝑇2 distribution ... 23 Figure 11 raw spectra of all sample measurements, three spectra is marked with a red dot
which is spectra’s that seems to be extreme ones ... 26 Figure 12 raw NIR spectra of measured data divided into a validation set figure A, and a
calibration set figure B, see Appendix 3 for sharper figures ... 27 Figure 13 shows the first PLS model created on raw calibration data. Red colour corresponds
to cross-validation and blue colour to calibration. ... 27 Figure 14 influence plot of the first PLS model on raw calibration data. There are five
variables marked as extreme outliers in the upper right corner and one outlier in the lower right corner ... 28 Figure 15 best-created PLS model of raw calibration data depend on cross-validation
R-square value, recalculated without outliers ... 28 Figure 16 prediction ability of the best version of PLS 1 model presented in Figure 15, by
using all four replicates of the validation data set ... 29 Figure 17 NIR spectra after pre-processing by using unit vector normalisation of the
calibration data set ... 29 Figure 18 shows the PLS model after pre-processing of the calibration NIR spectra, by using 7 PLS factors. The red colour is cross-validation, blue line calibration, and the black line is the target line ... 30 Figure 19 influence plot of normalisation pre-processed calibration data; seven extreme
outliers have been marked ... 30 Figure 20 shows the PLS model of normalized calibration data set, recalculated without
marked outliers in Figure 19 ... 31 Figure 21 Prediction by using PLS model in Figure 20, pre-processed with normalisation and
seven outliers ... 31 Figure 22 Pre-processed calibration spectrum by using Savitzky-Golay 2nd derivatives, 35
smoothing points and polynomial order 2 ... 32 Figure 23 results of PLS model by using Savitzky-Golay 2nd derivatives with 35 smoothing
points and 3 PLS factors. The red colour is cross-validation, blue line calibration, the black line is the target line ... 32
Figure 24 influence plot of Savitzky-Golat 2nd derivatives, 35 smoothing points and
polynomial order 2. one extreme outlier and two potential outliers are marked ... 33 Figure 25 recalculated PLS model in Figure 23 by excluding three outliers marked in Figure
24 ... 33 Figure 26 Prediction PLS 2nd derivatives 35 smoothing points, 3 outliers ... 34
Figure 27 NIR spectrum after pre-processing of calibration dataset by using Baseline offset transformation ... 34 Figure 28 PLS model after pre-processing with Baseline transformation and full
cross-validation; The red colour corresponds to calibration, Blue colour correspond to cross-validation, and the black line is the target line ... 35 Figure 29 Influence plot of PLS model presented in Figure 28, six extreme outliers and four
potential outliers has been marked ... 35 Figure 30 shows the results of the best cross validated model presented in Table 11, which is
pre-processed with baseline transformation without ten outliers (6+4) ... 36 Figure 31 prediction results by using PLS model pre-processed with baseline transformation
and ten outliers excluded ... 37 Figure 32 NIR spectra after pre-processing by using Savitzky-Golay smoothing with 21
smoothing points and polynomial order 2 ... 37 Figure 33 results of PLS model created after pre-processing by using Savitzky-Golay
smoothing with 21 smoothing points. Red colour corresponds to cross-validation, and blue colour to calibration ... 38 Figure 34 influence plot of PLS model after SG-smoothing, with 12 outliers marked, five
extreme and seven potential outliers ... 38 Figure 35 results after recalculation of PLS model in Figure 33 by excluding 12 outliers
marked in Figure 34 ... 39 Figure 36 prediction results if PLS model pre-processed with SG-smoothing without 12
outliers are used to predict the total fraction of plastics in the validation data set 39 Figure 37 calibration NIR spectra after pre-processing by using standard normal Variate ... 40 Figure 38 PLS model created from SNV pre-processed spectra in Figure 37; the blue colour is
calibration results, the red colour is cross-validation results, and black colour the target line ... 40 Figure 39 influence plot of PLS model shown in Figure 38, marked variables has been
evaluated as model outliers ...41 Figure 40 results of recalculated PLS model without investigated outliers of the PLS model
presented in Figure 39 ...41 Figure 41 prediction results if the PLS model pre-processed with SNV without eight outliers
are exposed to new data from the validation data set ... 42 Figure 42 calibration NIR spectra after combining SNV and SG 2nd derivatives with 71
smoothing points as pre-processing transformation ... 42 Figure 43 influence plot of PLS model pre-processed with SNV and 2nd derivatives with 71
smoothing points ... 43 Figure 44 results of PLS model after pre-processing with SNV and 2nd derivatives with 71
Figure 45 prediction results of a PLS model pre-processed with SNV in combination with SG-2nd derivatives, excluding six outliers. The model is exposed to all four replicates of
the validation set ... 44 Figure 46 comparison of measured NIR spectra of 100%-, 51,62%-, 29,15%-, 14,89%-, and 0%
plastics. The figure is also presenting potential functional groups in the
wavenumber interval based on data from Burns and Ciurczak (2008) ... 48 Figure 47 regression coefficients of factor 2 in PLS model after normalisation pre-processing
... 49 Figure 48 regression coefficients of factor 1 in PLS model with SNV 2nd derivative
pre-processing without six outliers ... 49
LIST OF TABLES
Table 1 municipal solid waste composition divided into materials and income level of countries, the last column presents total annual waste. Data received from
Hoornweg et al. (2012) ... 6 Table 2 present a summary of main compositions in MSW produced in the UK, divided into
paper, organics, plastic, glass, metals, data received from (2007) ... 6 Table 3 Swedish MSW compositions of three different WTE plants created through manual
sorting of real waste material, data received from Jones et al. (2013) ... 8 Table 4 Comparison of the gross calorific heating value of the waste material, data received
from Montejo et al. (2011) ... 9 Table 5 shows the most common types of plastics, and applications, data received from
Mudgal et al. (2011) ... 10 Table 6 absorption wavenumbers in the infrared region of water and common chemical
bonds including carbon, data received from Burns and Ciurczak (2008) ... 11 Table 7 summary of all types of plastics used in RDF-plastic mixtures, divided into plastic
types, the origin of material,l and material index ... 15 Table 8 overview of weight percentages of plastic material in sample mixtures. Divided in
total range, mean of plastic material in all samples, mean of plastic material if the mass is greater than zero ... 17 Table 9 identification number of data sets used for validation ... 27 Table 10 results of using Savitzky-Golay 2nd derivatives and 15 or 57 smoothing points,
presented as 𝑅2-value and RMSE for model calibration and cross-validation ... 32 Table 11 Results of PLS model by using Baseline transformation recalculated without 6 or 10
outliers. The results contains of 𝑅2 and RMSE values of calibration and cross-validation ... 36 Table 12 PLS model calibration and cross-validation results if 31, 41, 71 or 81 smoothing
Table 13 overview of created models comparing results of calibration, validation and
prediction ability on new spectral data ... 46 Table 14 prediction ability of the best obtained-calibration model in Table 13, predicted with
one replicate of the validation set ... 47 Table 15 prediction ability of the best-obtained calibration model of each pre-processing tool
in Table 13, predicted with an average of all replicates in the validation set ... 47 Table 16 plastic material included in NIR spectrum in Figure 46 ... 48 Table 17 summary of results after NIR spectral pre-processing, removed outliers, delimitated
wavenumber interval. Presented results are calibration, cross-validation, and prediction of all four replicates, one of four replicates, an average of all replicates ... 50
LIST OF NOMENCLATURE
Beteckning Beskrivning Enhet
m Mass weight g Wavenumber 𝑐𝑚−1 Bandwidth nm T Temperature ℃ d Diameter m I Irradiation W/𝑚2 A Relative absorbance -
LIST OF DEFINITIONS
Definitions ExplanationsWTE Waste to energy plant – A plant where waste is used as combustion fuel to produce heat and power
MSW Municipal solid waste – waste produced by
households including organic wastes, paper, plastics etc.
Definitions Explanations
RDF Crushed, sorted and dried wastes (municipal,
industrial, commercial) where the combustible part of waste remains and unburnable parts has been
removed
CFB Circulated fluidized bed boiler DS Dry substance of a material
LIST OF ABBREVIATIONS
Definition Explanation
NIR Near-infrared region
FT-NIR Fourier transform-NIR
RPM Rotations per minute
PP Polypropylene
LDPE Low density Polyethylene HDPE High density Polyethylene PET Polyetylentereftalat
PS Polystyrene
PVC Polyvinyl chloride
ABS Acrylonitrile butadiene styrene RMSE Root mean square error
PLS Partial least square
𝑅2 Coefficient of determination
𝑦𝑖 Reference Y value 𝑦̂ Predicted Y value
𝑦̅ Mean of reference Y value n Number of samples
f Material fraction S Sample variables P Weight percentage
MSC Multiplicative scatter correction PCA Principal component analysis
Definition Explanation
SNV Standard normal variety
SG Savitzky-Golay
X Independent variable
Y Dependent variable
𝛽 Regression coefficient 𝜀 Error, noise
1
INTRODUCTION
This is a degree project to obtain a master of engineering in energy systems. The aim is to develop a model that predicts the fossil share in refused derived fuel (RDF) material by using near-infrared (NIR) spectroscopy and a partial least square (PLS) regression model. The first part of the degree project report presents a background to the problem by
combusting RDF materials. Then a literature review gives information about RDF
compositions and how the NIR technology works and have been used in earlier works. Then a description of used methodology and results are presented before the discussion and conclusion complete the report.
1.1
Background
Incineration of wastes in waste to energy plants (WTE) has been a standard way to handle an increased production of various types of wastes in Sweden and the rest of Europe, called refused-derived fuel (RDF). Mohn et al. (2008) emphasise the overall positive environmental impacts of combustions compared to correspondent impacts of landfilling. But still,
incineration of all types of fuels end up in different kinds of emissions like carbon dioxide (CO2), Sulphur oxides (SOx), Nitrogen oxides (NOx) where CO2 is a greenhouse gas included in the European emission trading system.
The government of Sweden includes incineration of wastes in the emission trading system, although the European directive says that this type of waste handling should be excluded (Bisaillon, 2011). This choice means that Swedish heat and power plants using waste as fuel need to receive emission rights equal to the amount of emitted fossil CO2. How much of combusted waste that has fossil origin varies a lot depending on where the waste comes from, countries, cities etc. Profu AB (2013) had summarised different perspectives on future waste handling in Sweden and how it will affect the climatic and future demand of heat and power. Profu present Sweden as a top country regarding waste handling, where energy, biological, and material recovery replace landfilling. Further on, Profu presents that Sweden already reaches the goal of minimum 50% recovery of paper, glass, and metals compared to the year 2010, but the same goal for plastics are not yet fulfilled.
In point of fossil share is the majority located in different types of plastics manufactured by oil products. An increased amount of recovered plastics will, therefore, reduce the fossil share in waste and in that way reduce the amount of emitted fossil CO2 in combustion processes. Biological waste used for biogas production instead of combustion in WTE plants has great potential to reduce the amount of fossil emitted CO2 if biogas replaces fossil vehicle fuels (Profu AB, 2013).
Sweden force the development into a fossil free heat and power sector since taxes and emission trading systems make it more favourable to reduce emissions of fossil CO2. A
consequence of this development is less waste available for combustion since more waste is recycled or used in biogas production. Lack of waste material makes a gap between the capacity of WTE plants and the access to Swedish waste, which is covered by the import of waste from other European countries (Profu AB, 2013).
1.1.1
Import of waste materials
Nations as the United Kingdom (UK) and Poland, for example, have had a tradition to deposit waste rather than recycling or incinerate in WTE plants. Plastics Europe (2015) present data of how different European countries are handling produced wastes with focus on plastics. Presented data shows that countries where landfilling are banned is in the top when it comes to recycling or energy recovering from wastes. However, in countries where landfilling are still accepted, it is a commonly used method of waste handling.
Big difference in waste handling between countries means that some nations have untouched wastes including a high content of plastics, textiles, bioorganic materials. Top nations as Sweden will instead have more separated wastes where a lot of bio-organic wastes uses for biogas production, and some amount of paper, glass, and metals are separated and recycled. Hoornweg and Bhada-Tata (2012) present data of how waste characteristics are varying between countries and groups of high/low-income countries, for more information, see chapter 2.1. The data concluded that countries with less waste handling like the UK produce waste with higher contents of plastics, paper, and glass compared to nations like Sweden and Denmark. Since plastics mainly originates from fossil oil, it will produce fossil CO2 in a combustion process. According to Swedish requirements, presented in the previous chapter, should emission of fossil CO2 be reported and the company should guarantee that they have equal emission rights.
The problem with incineration in combination with waste trading is the variety of waste content between different loads. Especially for Swedish companies, it would be preferable to have a method that continuously measures/predict how much of inserted waste fuel that have fossil origin and how much that is renewable. If it is possible to figure out the fossil share in wastes and a corresponding amount of fossil produced CO2 out of the combustion process, the companies would be able to obtain better emission results in the annual report. Further on, the knowledge of fuel characteristics is preferable to control and optimise an industrial process.
1.1.2
Description of the technical area (scope)
There are four main technologies available to determine whether produced CO2 have fossil or renewable origin. There are manual sorting, selective dissolution, radiocarbon method (14
C-method) and balance method. The first three are standard methods included in European Standard EN 15440 and ASTM standard D6866, and the balance method is close to being a standard method as well (Schwarzböck, Rechberger, Cencic, & Fellner, 2016). Selective dissolution is a laboratory method to determine biomass content of a waste fuel sample, described more in detail by Staber, Flamme and Fellner (2008). Staber et al. also present the
balance method as a combination of standard fuel composition values and measured process data. This combination gives an equation system of five mass balances and one energy balance, where the content of organic carbon is one equation factor. A disadvantage of this method is that bioplastics and vegetable oil are counted as fossils because of likely chemical composition.
14C-method utilise the decomposition of 14C into 12C with a half-life time of 5730 years (Van
Dooren, 2012). Staber et al. (2008) say that natural form of carbon is 14C developed in the
atmosphere and then oxidised into CO2 which bounds into growing plants. Further on, Staber et al. describe that renewable fuels include almost 100% 14C and fossil fuels 100% 12C
because of decomposition and no adding of new carbon-14 into “dead” organic materials. This method use absorbed CO2 in flue gases of a WTE plant in combination with equal CO2 amounts measured in a laboratory bomb calorimeter. Absorbed CO2 is used to measure the total content of carbon, and the content of 14C (renewable origin) using a particle accelerator
to separate 12Cand 14C isotopes.
Another technology that is more frequently used and examined in scientific reports and industrial applications right now is the near-infrared spectroscopy (NIRS). Siesler et al. (2002) describe that different functional groups as C-O, C-H, S-O, for example, have different absorption bands in the infrared region which is measured by NIR spectral instruments. Measured absorption gives an absorption spectra with peaks at different wavenumbers that are related to chemical bonds in investigated sample. Identification of different types of plastics using NIRS has been studied by Mauruschat et al. (2016) with reasonable accuracy. Other applications summarised by Skvaril, Kyprianidis and Dahlquist (2017) present that NIRS could be used to describe the content of cellulose and lignin in pulp manufacturing and also ratios of ash, moisture, with more.
The idea is, according to Methrom (2013), to correlate absorption spectra of a sample with known characteristics, for example, moisture content, by using chemometrics. If the chemometric model shows good prediction ability (low value of root mean square error (RMSE)), it could be possible to use this method for online measurements in a real process. An advantage of using NIR is that no sample preparation is needed, and it has a relatively low investment cost.
1.2
Purpose and research questions
The purpose of this degree project is to investigate the potential in NIR spectroscopy as a method to determine the fossil share in wastes. The focus will be to predict the total amount of plastics in the solid waste material before the combustion takes place. Since plastics are a product of fossil oil, the content of plastics are assumed to be equal to the content of fossil material in the total waste mixture.
The idea is to use NIR absorption spectra of samples with a known content of plastics to create a regression model that correlate these two data matrices. If the model validation shows acceptable predictive accuracy, it could be extended with recalculations of plastic content into carbon content by doing a material analysis of used plastics to find out exact chemical structures and the amount of carbon.
What type of model is recommended to use for correlation of NIR spectra with the content of plastics, to predict the fossil share in RDF mixtures?
Could a reliable model be created to prejudge the content of plastics of an RDF mixture if plastics are assumed to represent the fossil share?
1.3
Delimitations
The content of plastic material is predicted by using partial least square regression, and no other regression models are being investigated.
Measured plastic content is in a mass percentage of the total mixture weight. Following pre-processing tools are examined:
o Baseline correction o Standard normal variety o Savitzky-Golay 2nd derivatives o Savitzky-Golay smoothing o Vector normalisation
The software Unscrambler X 10,5 is used to create the regression models. Work with artificial refused derived fuel.
2
LITERATURE REVIEW
Combustion is an exothermal reaction where fuel bounded carbon and hydrogen oxidise into carbon dioxide and water in attendance of oxygen. An exothermic reaction releases heat energy, but it also produces different types of emissions depending on fuel content and combustion quality. Equation 1 shows an example of a complete combustion reaction, and Equation 2 an incomplete combustion reaction of methane.
𝐶𝐻4+ 2 ∗ 𝑂2→ 𝐶𝑂2+ 2 ∗ 𝐻2𝑂 + ℎ𝑒𝑎𝑡 Equation 1
2 ∗ 𝐶𝐻4+ 3 ∗ 𝑂2→ 2 ∗ 𝐶𝑂 + 4 ∗ 𝐻2𝑂 + ℎ𝑒𝑎𝑡 Equation 2
Carbon dioxide is always an emission factor in combustion processes of solid fuels, and so on for sulphur dioxide if sulphur is in the fuel. Fossil fuels usually have some content of sulphur in the chemical structure, and there is no conventional way to avoid Sulphur emissions before the combustion process takes place. Sulphur reaction showed in Equation 3 are also an exothermic reaction that releases heat energy, which is the aim of a combustion process. The problem is that produced Sulphur dioxide readily reacts into Sulphuric acid in contact with water, which in turn cause acidification in nature.
𝑆 + 𝑂2→ 𝑆𝑂2+ ℎ𝑒𝑎𝑡 Equation 3
Different Nitrogen compounds (NOx) are other common emissions of a combustion process, which cause acidification and have negative health impacts on humans. NOx is a result of a reaction between nitrogen and oxygen at high temperatures (1300-1600 0C).
A fuel composition consists of different pieces, which could be seen in Figure 1. Wet fuel is unwanted in a combustion process because some heat energy is needed to evaporate water moisture that in turn reduce the fuel heating value. Further on ash is a combustion rest of un-burnable elements as heavy metals, silica, Alumina, with more. Flammable substances are the burnable part of a fuel that causes a release of heat energy. For more information about basics in combustion processes see compendium Combustion- and flue gas cleaning
technology by Wester (2013).
2.1
Composition of waste
Waste is material that in some way is unusable or unwanted by humans, and need to be taken care of. Mainly used methods of waste handling consist of landfilling, material recycling, incineration in WTE plants, biogas production, or composting. The optimum way is to combine different waste handling methods according to the waste staircase described by Vafab (2018). The best is to reduce production of waste, second is to reuse as much material as possible, third is to recycle material like plastics and metals, fourth is to convert waste to energy, and the last step is the deposit. According to an information publication by Hoornweg et al. (2012), there are significant differences in waste handling between countries. Deposit in landfills is described as the cheapest method commonly used in low-income countries, which according to the waste staircase is the worst way to handle produced waste. High-income countries are described to work more along the waste staircase with the deposit as a last resort, and instead use recycling and energy recovery as much as possible.
Differences in waste handling depend on the economical level make differences in the final composition of municipal solid waste (MSW), as could be seen in Table 1. Presented data has been received from Hoornweg et al. (2012), and are collected by the WorldBank.org. As could be seen in Table 1, there are higher contents of organic waste in low-income countries
compared to high-income countries. There is a higher content of the paper, plastics, glass and metals in high-income countries and also a higher total mass of produced wastes.
Table 1 municipal solid waste composition divided into materials and income level of countries, the last column presents total annual waste. Data received from Hoornweg et al. (2012)
Income level, countries Organic (%) Paper (%) Plastic (%) Glass (%) Metal (%) Other (%) Total waste (millions ton) Low income 64% 5% 8% 3% 3% 17% 75
Lower middle income 59% 9% 12% 3% 2% 15% 369
Higher middle income 54% 14% 11% 5% 3% 13% 243
High income 28% 31% 11% 7% 6% 17% 602
The corresponding composition of MSW in the UK presented in Table 2, summarised by Burnley (2007) shows that the range of main MSW composition correlates with the data presented in Table 1. By comparing Table 1 and Table 2 it seems like the UK is a high-income country, but with some deviation in the content of the paper and organic material.
Table 2 present a summary of main compositions in MSW produced in the UK, divided into paper, organics, plastic, glass, metals, data received from (2007)
Paper and card 23-25%
Kitchen and garden waste 35-38%
Plastics 8-10%
Glass 6-7%
Metals 3-5%
Fråne et al. (2016) present export of waste as a more commonly used method to replace deposition with incineration in WTE plants located in another country. Especially European countries are using this solution, because of introduced deposit taxes that makes it more favourable with actions earlier in the waste staircase. Actions like new taxes are presented as
a response to European Union goals to reduce the usage of waste deposition. The main reason for a country to export waste rather than take care of it by themselves is explained by Fråne et al. (2016) to be that no or low capacities of WTE plants is available in these
countries. Another reason is that it is cheaper to export waste to, for example, Sweden where the need of district heat is well-spread, compared to incinerate wastes in their own plants. Generally, waste as fuel in a WTE plant has to be of better quality compared to the
composition of MSW presented in Table 1 and Table 2. According to Fråne et al. (2016) and Montejo et al. (2011), it is primarily favourable to reduce the amount of organic matter. The main reason is that organic matter includes a high content of moisture that has a negative impact on a combustion process because moisture reduces the fuel heating value. Further on, it is recommended to recycle as much recyclable material as possible.
Before export of MSW, it undergoes some preparation steps where materials are separated, and the new fuel composition is named refuse-derived fuel (RDF). Montejo et al. (2011) present data of the situation in Spain where the composition of MSW is set in relation to RDF presented in Figure 2. The content of organic matter shows the significant differences
between MSW and RDF. The fraction of plastics, paper, wood and textiles increase as a result of removed organic material; the total RDF weight is only 42% of the initial MSW weight. Further on Montejo et al. present that the recovery of paper and plastics are only 15.24% and 10.20% respectively.
Figure 2 composition of MSW and RDF in Spain divided into main components as organic matter, plastic, paper with more, data received from Montejo et al. (2011)
Further on, Jones et al. (2013) investigate corresponding RDF composition of three WTE plants located in Sweden. Wastes from seven WTE plants are included in their study to determine the content of fossil carbon by using carbon-14 method, manual sorting, a sampling of flue gas, and the balance method. Manual sorting where used as a method to analyse waste in three of the studied plants and the results could be seen in Table 3. What is common between all of these plants is the usage of a grate-fired boiler with only partly pre-treated wastes. This means that the waste fuel consists of large pieces of material, and also heavy material as glass and metals. As could be seen in Table 3, two plants are using 100%
MSW material as fuel, and the third one uses a combination of 40% MSW and 60% industrial waste (IW).
Table 3 Swedish MSW compositions of three different WTE plants created through manual sorting of real waste material, data received from Jones et al. (2013)
Plant 1 Plant 2 Plant 3
Waste origin 100% MSW 100% MSW 40% MSW, 60% IW Biological waste 14,6% 31,4% 24,8% Paper 37,6% 23,2% 20,8% Plastics 25,7% 13,8% 15,8% Glass 3,4% 1,4% 1,8% Metal 3,1% 2,8% 3,8% Inorganic 0,4% 2,7% 3,0% Electrical wastes 0,1% 0,3% 0,6% Other 15,1% 24,4% 29,4%
2.2
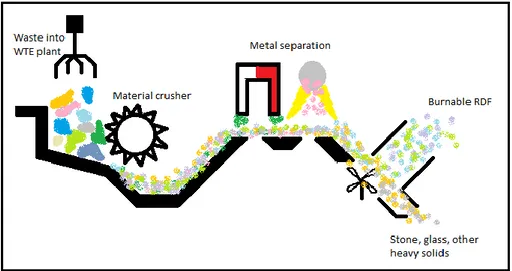
Example of RDF preparation at WTE plant in Västerås
Mälarenergi heat and power plant in Västerås uses waste as fuel in the combustion unit block 6. This unit has a combustion chamber based on the circulated fluidised bed (CFB)
technology, combusting a mix of imported waste and waste from the nearby region. Delivered waste enters as a first step a fuel preparation unit where waste material is crushed into pieces equal to a size of a credit card. Further on the waste material passes through different
separation steps, as could be seen in Figure 3. Because of varying waste quality with a focus on material recycling between different loads, it is more or less essential to have these separation steps.
Magnetics and electrical fields are used in a first separation step to remove ferrous and nonferrous metals. The second separation step removes un-burnable material as glass, stones, etc. that is unwanted in a combustion chamber. Generally, these types of material are heavy and could be separated by using a fan where light burnable material as plastics and paper are blowing into the next preparation step, and more massive pieces drop into a truck for recycling or deposit. The composition of separated burnable pieces is the final RDF mixture that is inserted as fuel to the boiler to produce district heat and electrical power. For more information about Mälarenergi block 6 see malarenrergi.se (2014).
Figure 3 fuel preparation at Mälarenergi heat and power plant located in Västerås
The CFD boiler at Mälarenergi have some specific requirements related to the RDF material composition. According to Elena Tomás-Aparicio at Mälarenergi (personal message 7/3-2018) the limits for their boiler is to have an RDF composition with contents of Aluminum respectively other metals below 1% of dry substance (DS). Further on, should the glass content be below 2% DS, and other non-fluidized material below 3% DS.
For a combustion process is the heating value vital since it describes how much energy that is possible to release from the fuel. A comparison of gross calorific heating values of RDF
materials is presented in Table 4 summarised by Montejo et al. (2011). As could be seen is the energy density almost the double in plastic material compared to textile, wood, organic matter, and paper and cardboard.
Table 4 Comparison of the gross calorific heating value of the waste material, data received from Montejo et al. (2011)
Material Gross calorific value [MJ/kg]
Organic matter 14.905
Paper and cardboard 14.739
Textiles 21.298 Wood 18.825 HDPE 41.269 LDPE 45.670 PET 22.995
2.3
Plastics
Plastics are a collection name of different materials consisting of polymer and various additives to get desired material characteristics. According to the European Union report written by Mudgal et al. (2011), there are approximately 63% plastics used for packaging in Europe, 16% in furniture, and the rest divided between agriculture, automotive, construction material with more. Further on, there are about 70% of total MSW plastics that could be related to packaging materials, which is a significant majority.
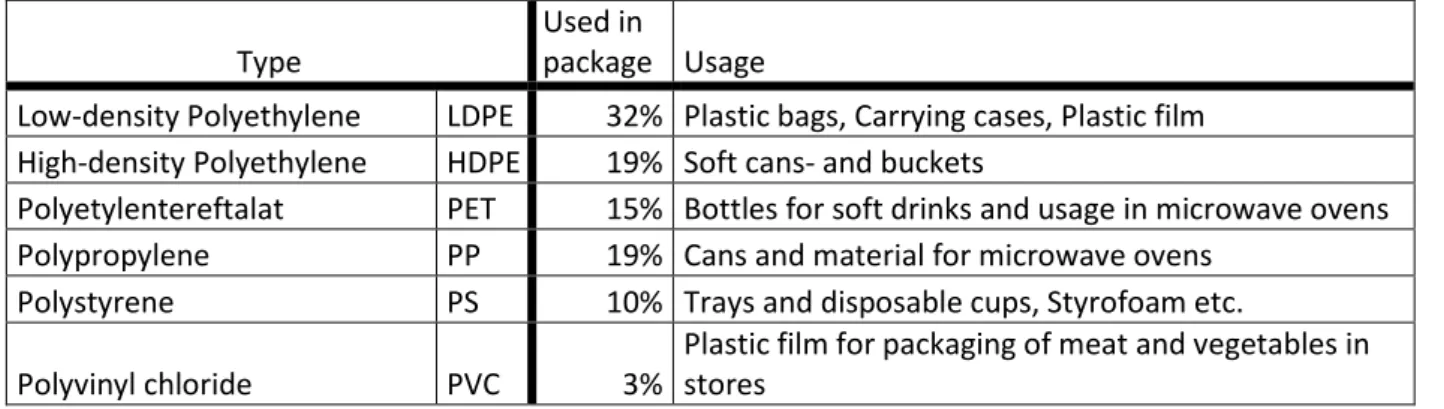
Table 5 presents the six most commonly used plastic types according to Mudgal et al. (2011) and (Livsmedelsverket.se, n.d). As could be seen is the LDPE used for plastic bags are the most frequently used polymer for packaging, followed by HDPE, PET and PP used for
manufacturing of bottles and cans. Mudgal et al. explain that the usage of PVC decrease in Europe because of dangerous traits due to additives of different plasticisers.
Table 5 shows the most common types of plastics, and applications, data received from Mudgal et al. (2011)
Type
Used in
package Usage
Low-density Polyethylene LDPE 32% Plastic bags, Carrying cases, Plastic film High-density Polyethylene HDPE 19% Soft cans- and buckets
Polyetylentereftalat PET 15% Bottles for soft drinks and usage in microwave ovens Polypropylene PP 19% Cans and material for microwave ovens
Polystyrene PS 10% Trays and disposable cups, Styrofoam etc.
Polyvinyl chloride PVC 3%
Plastic film for packaging of meat and vegetables in stores
As presented in section 2.1 Montejo et al. (2011) says that some plastic is removed and recycled in the conversion of MSW into RDF. The total amount of plastics in Spanish wastes, 11% in MSW and 24% in RDF, could be divided into more specific polymer types as presented in Figure 4.
Figure 4 fractions of different plastic types divided between MSW and RDF, produced in Spain, data received from Montejo et al. (2011)
2.4
General NIR spectroscopy technology
The NIR spectroscopy technology was first investigated in the year 1881 when organic liquids were measured in the infrared region with wavenumbers between 14285-8333 𝑐𝑚−1
according to Osborn et al. (1993). More research followed this experience, and the first electrical detector of the NIR absorbance was developed and used in the 1950’s. The idea of NIR spectroscopy is to illuminate a material with infrared light and detect those
wavenumbers where material absorbs infrared light. The relative absorbance is calculated in the NIR software depend on measured irradiation of reference (IR)- and sample (IS) scan by
Equation 4. 𝐴 = log10(𝐼𝑅
𝐼𝑆) Equation 4
Further, Osborn et al. (1993) present NIR as primarily a surface measuring tool, to detect what is in the top of a sample, but the light could penetrate a sample more or less depending
on material composition. The absorption depends on chemical bonds that starts to vibrate as a result of light energy. Functional groups including hydrogen are the most important once in NIR spectroscopy as C-H, O-H, N-H but also C=O. According to Metrom (2013), the NIR spectral region involves wavenumbers between 14285 𝑐𝑚−1 to 4000 𝑐𝑚−1. Table 6 presents
some absorption bands of water and common chemical bonds including carbon in the NIR spectral region; more absorption data could be seen in the book by Burns and Ciurczak (2008). Further on, the NIR spectra is divided into four regions, as showed in Table 6. These are: the third overtone (14285-9090 𝑐𝑚−1), second overtone (10000-6060 𝑐𝑚−1), first
overtone (6896-4878 𝑐𝑚−1), and the combination band (5128-4000 𝑐𝑚−1). Because of broad
absorption bands, there are overlapping absorptions between different chemical bonds, and the one and same chemical bond are also absorbing light at more than one wavenumber. For example, an absorption peak at wavelength 5714 𝑐𝑚−1 could, according to Table 6, be
because of either CH2, CH or SH bonds in the material.
Table 6 absorption wavenumbers in the infrared region of water and common chemical bonds including carbon, data received from Burns and Ciurczak (2008)
Region
Chemical bonds Third overtone[𝑐𝑚−1] Second overtone [𝑐𝑚−1] First overtone [𝑐𝑚−1] Combination band [𝑐𝑚−1] H2O 13422-13245 5263-5102 10416-10101 7142-6896 CH 13513-12820 8510-8163 5917-5633 4395-4089 10928-10638 7017-6849 CH2 13793-13157 8733-8230 5970-5714 4444-4140 11173-10810 7194-6993 CH3 14084-13513 8968-8403 5952-5847 4545-4166 11627-10928 7299-7092 CC 4651-4545 CHO 4566-4504
For a laboratory NIR experiment, there are, according to Burns and Ciurzak (2008), some particular things to keep in mind when it comes to handling sampling. The analysed material should be representative of the original state of collected material as moisture content and sample composition. Moisture content will be more or less affected during the preparation because of water evaporation both at room temperature, but also when NIR light heats the material. The weighing of the substrate before and after measurement are therefore essential to be able to see how much mass of water that evaporates.
The NIR spectroscopy is, according to Methrom (2013), a secondary method, which means that detected absorption of light and obtained absorption spectra’s alone are not able to give any useful material information. Instead, the NIR spectra’s has to be combined with a model that use absorption spectra’s to predict desired material information. A collection name of the methodology to obtain a prediction model is chemometrics that includes following progress steps described by Siesler et al. (2002):
Design a model that describes the relationship between independent variable, X, (NIR spectra) and the dependent variable, Y, (desired material information). Desired material information obtains by using some reference method, for example, weighing. The model could be designed for a single- or multivariate dependent variables, by using linear regression, partial least squares regression or any other statistic mathematic regression model. Important to know is that obtained regression model is only applicable to dependent data that is in the range of dependent data used in the calibration data set. This means that the model has to be calibrated to cover all data variances that are expected in the area of model application.
Validation:
Checks how well the calibration model can predict the dependent variable by using the NIR spectra of a sample that are not in the calibration data set. The predicted numbers are correlated with the real number of dependent variables measured by the reference method Regularly, the accuracy of a model illustrates by calculated 𝑅2-value or RMSE-value, (Equation 5 respectively Equation 6).
2.5
Applications and usage of NIR spectroscopy
In the report by Skvaril, Odlare et al. (2017), NIR spectroscopy was evaluated as a method to determine properties of solid biofuels. Investigated properties are the content of moisture, ash and higher heating value. To obtain the NIR spectra’s the authors use a Fourier
transform-NIR (FT-NIR) spectrometer to illuminate a sample of biomass placed on a rotating plate to illustrate a moving conveyer belt with a speed of 1 m/s. The absorbance spectra were collected with a resolution of 8 𝑐𝑚−1 and 32 scans of each sample in the
wavenumber interval between 12000-4000 𝑐𝑚−1. Pre-processing of raw spectral data were
used to avoid scattering effects and base-line shifts by using multiplicative scatter correction (MSC) described in detail by Fearn et al. (2009). Further on is the model of desired biofuel properties developed by using multivariate linear regression technic by a partial least squares regression model, described by Wold, Sjöström and Eriksson (2001). The model was
validated by calculating the value of root mean square error (RMSE) Equation 5, and the coefficient of determination (𝑅2) Equation 6, where the RMSE should be as small as possible
and 𝑅2 close to 1. The results and conclusions of their report are that MSC provides reliable
results of sample correction. Further on, is the model validation results good enough to be used in the control of a thermochemical plant, based on the 𝑅2 and RMSE values (moisture:
𝑅2= 0.88, Heating value: 𝑅2= 0.69, Ash: 𝑅2 = 0.85). The definition of a good model varying
according to Odlare (2017). In Consumer behaviour science is an 𝑅2-value of at least 0.5
recommended, in process modelling at least 0.65, and in analytical chemistry at least 0.99.
𝑅𝑀𝑆𝐸 = √∑ (𝑦̂𝑖− 𝑦𝑖)2 𝑛 𝑖=1 𝑛 Equation 5 𝑅2= 1 −∑𝑛𝑖=1(𝑦𝑖− 𝑦̂𝑖)2 ∑𝑛 (𝑦𝑖− 𝑦̅)2 𝑖=1 Equation 6
Another report by Zhang et al. (2016) investigates the possibility to in real time determine the total content of Nitrogen in fresh soil without drying. Similar to the methodology used by Skvaril, Odlare et al. (2017), Zhang et al. (2016) are using an FT-NIR spectrometer with 32
scans and rotating plate to obtain the spectra’s. Instead of a resolution of 8 𝑐𝑚−1 Zhang et al.
are using a resolution of 4𝑐𝑚−1. According to Schilling (2017) typical resolutions is 8 𝑐𝑚−1 or
16 𝑐𝑚−1. A higher number of resolutions are normally not needed to detect natural
bandwidths in the region of NIR spectral light. Smaller resolutions could be useful in analysing of minerals and gaseous with a smaller bandwidth that could be missed with too high resolution.
The study by Zhang et al. (2016) containing three different spots with 30 samples of each. The calibration model was containing 20 samples of each spot and remaining 10 samples containing the validation set. Two different types of models were developed by using PLS regression and support vector machine (SVM) regression. A correlation analysis investigated the most significant wavenumbers correlated to nitrogen, and the absorbance connected to this wavenumber were included in the PLS regression model. The final model gives a
validated 𝑅2-value of 0.634 which is too low to be used for precise prediction, but for a rough
estimation; it is useful. The SVM model in other way has an 𝑅2-value of 0.81 which is
accepted for process industries.
2.6
NIR spectroscopy related to plastic materials
According to Siesler et al. (2002) NIR spectroscopy has become a useful method to analyse plastics because of the chemical structure including functional groups as CH, NH, C=O, COOH. These bonds have great absorption in the NIR spectral region which make it
interesting in a NIR perspective to get a sensitive analysing method. The technology has been implemented in Poland for automatic sorting of waste material as glass, plastics etc.
presented by Guziana et al. (2011). More examples of material sorting by using NIR spectroscopy could be founded in France, Austria, Spain with more, where the technology usually is combined with other techniques. Cimpan et al. (2015) present a summary of the usefulness by using NIR in material sorting. They present that a material separation system is using NIR spectroscopy to detect a material, a camera locates the physical position, and a mechanical system separates the material.
Zheng et al. (2018) have done a more in-depth analysis of NIR spectroscopy as a method to classify different types of plastics, and in that way improve the recycling industry. They use plastic materials like PP, PS, PET, PVC, PE and Acrylonitrile butadiene styrene (ABS) placed on a moving conveyer belt. The measurement contains a NIR spectrometer combined with a hyperspectral image system. A total of 94 samples of plastic material were analysed, of those was 21 samples used for validation of the model. They use a resolution of 8 𝑐𝑚−1 with 32
scans of each measurement in the wavenumber interval of 10000-4000𝑐𝑚−1. Pre-processing
by using Savitzky-Golay smoothing and first order derivatives described by Yang et al. (2015) was used to reduce noise effects and baseline drifts. Zheng et al. use principal component analysis (PCA) to classify each plastic, and fisher discrimination to create five linear
discriminant functions to describe the unknown plastics. The final results of their study show that five linear functions have a predictive ability of 100%.
Similar results to Zheng et al. (2018) has been investigated in an earlier degree project by Al-Rawi and Larsson (2010). According to Al-Al-Rawi and Larsson, it is possible to identify and predict the content of specific plastics with an 𝑅2 values between 0.90-0.98 and 0.86 in
plastic mixtures. A difference in measuring method between the booth studies is that Al-Rawi and Larsson place the plastic material at the top of RDF material and not on a conveyer belt as in the report by Zheng et al. (2018). Al-Rawi and Larsson highlight the disadvantage of using this method if the goal is to create a model that could be used for online measurements. The main reason is that real RDF does not have the plastic material at the top of the
mixture/conveyor belt, and it would probably be tougher for a NIR spectrometer to detect plastic in a material mixture. Therefor Al-Rawi and Larsson recommend a further study in this area which is the aim of this degree project.
Prediction of plastic content in a wood plastic composite material including wood and PP by using NIR spectroscopy has been evaluated by Li et al. (2016). The material was milled into a powder which was illuminated by the NIR spectrometer. A PLS-regression model was created after pre-processing of the raw spectral data in Unscrambler. Used pre-processing tools was Savitzky-Golay first- and second derivatives, MSC, Standard normal variety (SNV), Baseline correction, and combinations of derivatives with MSC or SNV. The best values of 𝑅2 and
RMSE was obtained with Baseline correction as a single pre-processing method with an 𝑅2 of
0.947.
3
METHODOLOGY
This chapter describes the current study and the methodology of how the degree project has been done. It starts with a description of used materials and what type of material mixtures that are presented to the NIR instrument. It is continuing with a description of NIR spectral measurements and how the model is calibrated and validated to obtain final results.
3.1
Artificial Mixture of RDF, and presentation of used materials
For this degree project, an artificial RDF mixture has been used because of personal lack of vaccination to be in direct contact with real RDF. The composition of the artificial mixtures is constructed in a manner to imitate real RDF presented in Figure 2 and Table 3, but also in some samples equal to the composition in MSV to illustrate cases with RDF of low quality. All samples with corresponding weights of plastic free material and different plastics used for this study are presented in Appendix 1. Each sample mixture has got an ID-number to make it easier to connect a sample with correct NIR spectra.
The plastic-free part of the artificial RDF mixtures contains organic wastes (onion shell, cabbage, potatoes, leek), wood chips, textiles from a shirt, paper from a magazine. The paper and textile material are 100% dried material, but the wood chips and organic wastes contains some water. Used wood chips have been stored at room temperature (about 21℃) during a couple of months which means that most of the surface bounded water has been evaporated. The organic wastes originate from rests of fresh matter with higher moisture content.
Because of higher moisture content, it was necessary to dry the organic wastes material and remove some amount of surface bounded moisture, this was done in an oven at 70 ℃ for 6
hours. The temperature of 65-70℃ is used as it is normal that material storage of wood and organic wastes naturally reach this temperature because of self-heating (Hofmann et al., 2018). The organic waste material after drying preparation could be seen in Figure 5.
Figure 5 organic waste material after drying in 70℃ during 6 hours
The fossil part of the RDF contains different types and origin of plastics. Table 7 presents information about what kind of plastics that have been included in the RDF mixtures and the origin of each plastic material. Included plastic types are related to the most frequently used plastics in packaging material presented in Table 5, since package material are the most common plastic in MSV and RDF material. Each plastic types are chosen from materials that generally are consumed in households as plastic bags, food trays, etc. All kinds of plastics have got a reference number as could be seen in Table 7, which is used in Appendix 1.
Table 7 summary of all types of plastics used in RDF-plastic mixtures, divided into plastic types, the origin of material,l and material index
Index Description - Origin Type of plastic Plastic - 1 Plastic bag NETTO LDPE
Plastic – 2 Cream fresh can PP
Plastic – 3 Pasta Bag HDPE
Plastic – 4 Black meat plate PP Plastic – 5 Disposable cutlery PS Plastic – 6 Black foam meat plate PS Plastic – 7 Transparent meat plate PET Plastic – 8 PE-300 lab sample HDPE Plastic – 9 Plastic bag ÖoB LDPE
Plastic – 10 liquid dunk HDPE
Plastic – 11 Heinz ketchup bottle PET Plastic – 12 White foam package PS
Plastic – 13 PVC in lab PVC
3.2
Preparation of RDF mixtures
The RDF mixtures presented to the NIR spectral instrument are manufactured at the start-up of each day in the spectral laboratory. Plastic-free materials are acting as background
material to the plastics during all measurements, except for the case with 100% plastic material. The idea is to have a composition of plastic free material close to the data presented in Figure 2 recalculated into material fractions by using Equation 7. The recalculation gives the corresponding content of organic waste, paper, textile and wood as shown in Figure 2 if plastic, glass, and metals are excluded. The recalculation ends up in a mass fractions around 0.34 organic waste, 0.41 paper, 0.13 textile and 0.12 wood. Ferrous and non-ferrous metals and glass are not included in the artificial RDF mixtures because of low contents as presented in Figure 2 and Table 3.
𝑓
𝑚𝑎𝑡𝑒𝑟𝑖𝑎𝑙 𝑖𝑛 𝑏𝑎𝑐𝑘𝑔𝑟𝑜𝑢𝑛𝑑=
𝑓𝑚𝑎𝑡𝑒𝑟𝑖𝑎𝑙 𝑖𝑛 𝑓𝑖𝑔𝑢𝑟𝑒 21−𝑓𝑝𝑙𝑎𝑠𝑡𝑖𝑐−𝑓𝑔𝑙𝑎𝑠𝑠−𝑓𝑚𝑒𝑡𝑎𝑙𝑠 Equation 7
All materials are mixed in a circular tray as could be seen in Figure 6, which is how the mixture is presented to the NIR spectrometer. Covering the whole plate with the material is important to avoid reflectance of light because of the tray. For this degree project, a
minimum depth of 2 cm is used according to what was investigated in an earlier degree project by Winn and Thekkemadathil Sivaram (2017).
Figure 6 example picture of a sample mixture of paper, textile, wood, organic wastes and different plastic materials, before- (left figure) and in measurements (right figure)
The materials are mixed according to the sample description in Appendix 1. Each material is weighted in an aluminium tray, and measured weight is noted in the laboratory
documentation. The contents of plastics are varying, as could be seen in Table 8, between 0% up to 100% plastics to be able to create a robust model that could be applied to all types of mixtures. Even if the sample mixtures covering all types of plastic contents, there have been a focus on plastic contents between 10% up to 40%. Focus in this range means that more samples have been created for this interval because it is, according to the data in chapter 2.1, the most common plastic contents in real WTE plants. Each sample has a unique
same fraction of plastics, it will deviate in types- and weights of plastic materials. Table 8 presents the average weight percentage of each plastic material, both as a mean of all samples and as a mean of all samples where the mass are greater than zero, calculated with Equation 8.
𝑃𝑝𝑙𝑎𝑠𝑡𝑖𝑐 𝑡𝑦𝑝𝑒= ∑ 𝑚𝑝𝑙𝑎𝑠𝑡𝑖𝑐 𝑡𝑦𝑝𝑒
∑ 𝑚𝑝𝑙𝑎𝑠𝑡𝑖𝑐𝑠+∑ 𝑚𝑝𝑙𝑎𝑠𝑡𝑖𝑐 𝑓𝑟𝑒𝑒 𝑚𝑎𝑡𝑒𝑟𝑖𝑎𝑙∗ 100 Equation 8 Table 8 overview of weight percentages of plastic material in sample mixtures. Divided in total range, mean of plastic material in all samples, mean of plastic material if the mass is greater than zero Type of plastic material Total weight percentage range Mean weight
percentage, all samples
Mean weight percentage, mass>0 Content LDPE 0-100% 20% 20% Content HDPE 0-41% 6% 10% Content PP 0-30% 4% 8% Content PS 0-29% 4% 7% Content PET 0-37% 4% 7% Content PVC 0-11% 1% 2% All plastics 0-100% 39% 39%
The first thing that was done each day in the laboratory was to create a first sample mixture with either high or low content of plastic materials. Weights of each material depend on the desired mixture composition and how much material that is needed to get a material depth of minimum 2 cm. The first created sample mixture is acting as a base for next mixtures which means that more plastics or background materials are added to the previous mix to obtain a new content of plastics. This methodology is then repeated through all measurements with the structure as presented in Appendix 1.
As described by Burns and Ciurczak (2008) there are risks of reduction in material weight as a result of moisture evaporation because of the NIR light energy. In the artificial mixtures, there are mainly the weights of organic wastes and the wood chips that are affected by
moisture evaporation. However, if the total sample weight is reduced this will affect the mass content of the plastics, that has to be corrected. The correction is done by measuring the total weight of sample and tray after each spectral measurement and then recalculate the real weight of the plastic free sample material by using Equation 9. Further on, the plastic content is recalculated by Equation 10, which is the reference method of this degree project to
calculate the dependent response variable in the regression model.
𝑚𝑝𝑙𝑎𝑠𝑡𝑖𝑐−𝑓𝑟𝑒𝑒 𝑚𝑎𝑡𝑒𝑟𝑖𝑎𝑙 = 𝑚𝑝𝑙𝑎𝑡𝑒+𝑠𝑎𝑚𝑝𝑙𝑒 𝑚𝑖𝑥𝑡𝑢𝑟𝑒− 𝑚𝑝𝑙𝑎𝑡𝑒− ∑ 𝑚𝑝𝑙𝑎𝑠𝑡𝑖𝑐𝑠 Equation 9
𝑓𝑡𝑜𝑡𝑎𝑙 𝑝𝑙𝑎𝑠𝑡𝑖𝑐𝑠=
∑ 𝑚𝑝𝑙𝑎𝑠𝑡𝑖𝑐𝑠
𝑚𝑝𝑙𝑎𝑠𝑡𝑖𝑐 𝑓𝑟𝑒𝑒 𝑚𝑎𝑡𝑒𝑟𝑖𝑎𝑙+ ∑ 𝑚𝑝𝑙𝑎𝑠𝑡𝑖𝑐𝑠
Equation 10
Manual sorting of the last sample mixture has been used as a method to ensure that only water has been affected by the NIR spectral light. The mixture was manually divided into
each material category, and the weight was checked with the mass of actual material added to the material mix. By using this method, it is possible to see if any dry material as plastic, paper or textiles has disappeared, or if there are any changes in weight depending on moisture evaporation in wood and/or organic wastes.
3.3
NIR spectroscopy of RDF mixtures
The next step of the methodology is to measure the NIR absorption spectra of prepared RDF mixtures described in section 3.1 and 3.2. For this degree project, three types of NIR
instruments are used in parallel to obtain different spectra´s that could be used for further studies in the area of spectral effects depending on the choice of instrument. All instruments are measuring the spectra in the same way, but with some deviation in light intensity which gives variation in the size of absorption number. Figure 7 shows the setup of NIR spectral instruments. NIR spectra is measured by using head number 1 (Bruker MATRIX-F FT-NIR instrument with detection head Q412/A), and obtained models are used for further
regression modelling, because of problems with water moisture in head number 2.
Figure 7 setup of the NIR spectral instruments above the rotating plate, number 1 is a Bruker FT-NIR spectrometer used for this degree project
Before the measurements take place, it was recommended by Jan Skvaril (personal message, 17/3-2018), to preheat the instruments during 30 minutes by starting the spectral lights. The reason is to reduce potential spectral problems that could be occurring if scans are done with incorrect operation temperature. Further on, it is necessary to calibrate the spectrometer before the measurements are started. The calibration is done by doing a white reference background scan on an external white Teflon plate of instrument 1 or internal in instrument 2 and 3. The instruments are after preheating and calibration ready to be used for scans of prepared samples.
The first scan that is done during each day in the laboratory is to an empty circular tray. This scan gives a reference absorption spectra to check if following sample scans contains enough