DEGREE PROJECT IN MECHANICAL ENGINEERING, FIRST CYCLE, 15 CREDITS STOCKHOLM, SWEDEN 2016
Guiding Shirt
Aiding the Visually Impaired
Using Wearable Technology
YARED EFREM AFEWORK
MAGNUS VALTERSSON
KTH ROYAL INSTITUTE OF TECHNOLOGY
III
Bachelor Thesis MMKB 2016:21 MDAB 082 Guiding Shirt
Yared Efrem Afework Magnus Valtersson
Approved
2016-06-07
Examiner
Martin Edin Grimheden
Supervisor
Baha Alhaj Hasan
Abstract
The purpose of this thesis was to research how wearable technology mounted on the torso can be used to aid the visually disabled, particularly in their ability to move around in the world. The project was divided into two parts: the first on how to help them avoid obstacles in their paths, the second on how to help guide them to a specific destination using a navigation system. The obstacle avoidance system is composed of a number of ultrasonic sensors for distance measuring purposes, each of which are paired to their own vibration motor which provides a tactile feedback to the person. The intensity of each vibration motors are proportional to the distance measured by the corresponding ultrasonic sensor, allowing for the user to get an intuitive feeling of the distance to various objects in the space surrounding them.
The navigation system is composed of a GPS sensor, magnetometer and a collection of stored GPS coordinate checkpoints. By comparing the real-time position of the user with a stored goal GPS coordinate, a guiding direction and a distance measurement is calculated. The distance measurement is used to keep track of when a new goal GPS coordinate should be loaded. The magnetometer is used as a compass and its value is compared to the guiding direction, providing a degree error. Tactile feedback is provided using vibration motors, making the user aware of how they should turn their body.
V
Kandidatarbete MMKB 2016:21 MDAB 082 Guiding Shirt
Yared Efrem Afework Magnus Valtersson
Godkänt
2016-06-07
Examinator
Martin Edin Grimheden
Handledare
Baha Alhaj Hasan
S
AMMANFATTNING
Syftet bakom denna uppsats är att forska i hur kroppsnära teknik placerad på dess användares överkropp kan stödja de som är synskadade, framförallt i deras förmåga att röra sig i världen. Projektet delades upp i två delar: den första med fokus på hur de skulle kunna undvika hinder, den andra med fokus på hur de skulle kunna ledas till ett specifikt mål med hjälp av ett
vägledningssystem.
Den första delen består av en uppsättning ultraljudsavståndsmätare, som alla parats ihop med vibrationsmotorer. Vibrationsmotorerna används för att förmedla känselbaserad återkoppling till användaren. Vibrationsmotorernas styrka är proportionell mot de avstånd som är uppmätta av de korresponderande ultraljudsavståndsmätarna, vilket ger användaren en intuitiv förståelse för avstånden till de olika objekten i rymden runt omkring.
Den andra delen består av en modul, en magnetometer och en samling sparade koordinater. Genom att jämföra användarens aktuella position med de sparade GPS-koordinaterna tas en vägledande gradriktning samt ett avståndsvärde till den specifika
målkoordinaten fram. Avståndsvärdet används för att bestämma när en ny målkoordinat ska läsas in. Magnetometern används som en kompass och jämförs med den vägledande gradriktningen för att ta fram en felsignal i grader. Den kommer i sin tur användas för att vibrationsmotorerna ska ge en känselbaserad återkoppling till användaren om hur de bör vrida sin kropp för att röra sig mot rätt håll.
VII
P
REFACE
We would like to thank our supervisor Baha Alhaj Hasan for his support and feedback, Staffan Qvarnström for his expertise, and the teaching assistants for giving us help in the Mechatronics lab. We would also like to thank our opponent Dhanushka Chamara Liyanage for providing us with some very helpful tips, and the rest of our fellow FiM classmates for taking time from their own projects to help us with our own.
Magnus Valtersson Yared Efrem Afework KTH, Stockholm, May 2016
VIII
N
OMENCLATURE
Abbreviations
PWM Pulse-Width Modulation
GPS Global Positioning System
SD Secure Digital
GND Ground
IX
C
ONTENTS
SAMMANFATTNING ... V PREFACE ... VII NOMENCLATURE ... VIII CONTENTS ... IX 1 INTRODUCTION ... 11 1.1 BACKGROUND ... 11 1.2 PURPOSE ... 11 1.3 SCOPE ... 11 1.4 METHOD ... 12 2 THEORY ... 13 2.1 OBSTACLE AVOIDANCE ... 13 Ultrasonic Sensor... 13 Vibration Motors ... 13 PWM (Pulse-Width Modulation) ... 14 2.2 NAVIGATION ... 15 Storage ... 15 Magnetometer ... 15 GPS-module ... 15 3 DEMONSTRATOR ... 17 3.1 PROBLEM FORMULATION ... 17 3.2 SOFTWARE ... 17 Obstacle Avoidance ... 17 Navigation ... 183.3 HARDWARE AND ELECTRONICS ... 20
Parts List ... 20
Obstacle Avoidance Electronics ... 20
Navigation Electronics ... 21
Design of the shirt ... 22
Sensor and Vibration Motor Placement ... 22
3.4 RESULTS ... 23
GPS Sensor... 23
Magnetometer ... 24
Ultrasonic Sensors ... 25
4 DISCUSSION AND CONCLUSIONS ... 27
4.1 DISCUSSION... 27
GPS Sensor... 27
Magnetometer ... 27
Ultrasonic Sensors ... 28
4.2 CONCLUSIONS ... 29
5 RECOMMENDATIONS AND FUTURE WORK ... 31
GPS Sensor... 31
Magnetometer ... 31
Ultrasonic Sensors ... 31
REFERENCES ... 33
11
1 I
NTRODUCTION
1.1 Background
In today’s society engineers are doing their best to create tools that can help groups that are in some way disabled, and have a hard time doing things that many others take for granted. One such group are the visually impaired. Not being able to see can at times make it really difficult to perform normal tasks, and technology has unfortunately not progressed far enough to be able to restore sight to someone who has lost theirs.
Although a lot of tasks can be
performed without the ability to see, when it comes to moving around a lot of unexpected things can happen that a blind person just cannot sense. Most blind people have a cane that they use to feel the way before them as they walk but this is not perfect since if they do not expect there to be something they are not going to sense for it.
Another big problem of moving around for a blind person is that they might have a hard time knowing if they are moving in the right direction. That means that if they have never walked to a place before, and they have no one to help them, there is a big risk of getting lost.
1.2 Purpose
Because blind people sometime have a hard time moving through some environments on their own we want to create a shirt to help solve some of those problems. To help with obstacle avoidance we will include ultrasonic sensors connected to vibration motors that will tell the person when there is something close by. We will also include a navigation system with a GPS and a compass working together to guide the person to their destination.
With the well-being of these people in mind, the question is as to whether or not it could be possible to take inspiration from modern technology and use that to help in this endeavour. That is why throughout the project we will answer the question of “How do you design a smart shirt for a blind person?”. We will also get more in depth and figure out how to implement the
multiple ultrasonic sensors on a single Arduino, we will also investigate how well someone can be guided through the use of a GPS sensor and compass.
1.3 Scope
Vibration motors are very good in the aspect that they by only using the sense of touch are able to give a signal that can be regulated to give a feeling that does not only tell the person if there is something there but also how far away that thing is. To keep the project more focused on the core problem while finishing within the timeframe, no sound will be used as feedback since that would make for a much more complicated project.
Because only the sense of touch is used to give signals to the person wearing the shirt and not sound, other disabled groups such as the deaf-blind could be able to benefit from using it as well. However it was decided to put the main focus on creating it for blind people in general since that makes it possible to focus on the technical parts of the project without having to worry about other problems that might only apply to a more specific group.
12
For the obstacle avoidance part of the project, the only sensors that will be used are ultrasonic sensors and for the navigation part, only a GPS receiver and compass module for the Arduino is required.
No interface that would make it possible to add GPS-coordinates to the navigation system while it is in use will be designed since that would take a lot of time and is not necessary for the shirt to work. Coordinates will instead have to be imported through the computer beforehand.
Finally, the biggest factor constraining this thesis project, after limited time, is the monetary limit. Instructions to stay at a soft limit of 1000 Swedish Crowns, and to not cross that limit
unnecessarily, were given by the project supervisors.
1.4 Method
This bachelor thesis project is about Mechatronics and not about the interactions between humans and computers. As such, while one of the aims is to develop a working demonstrator, the data used in the results section cannot come from having visually impaired people try the smart shirt and report their experience. Instead, the data should come from objective
measurements that can be repeated by any other group of researchers.
As such, in order to preserve scientific integrity, it has been decided that the testing of the demonstrator will be limited to testing its sensors individually and then investigating their respective suitability for this project, particularly in helping answering the research question. A sensor is suitable if it can be trusted to deliver accurate and precise data that will not compromise the functionalities of the shirt.
13
2
T
HEORY
2.1 Obstacle Avoidance
Ultrasonic Sensor
In order to sense obstacles, some form of range finding sensor is needed. Different distance measuring sensors were considered but ultrasonic sensors were ultimately chosen as the most suitable sensor type.
The ultrasonic rangefinder is comprised of two main components, one that emits ultrasonic waves and another that detects them. The sensor works by emitting an ultrasonic sound wave and waiting for it to echo back from a surface. By having the microcontroller measure the time between the sensor emitting and detecting a sound wave [Sang, Jones, 2012], it is possible to calculate the distance between the sensor and the object. The time is measured in microseconds and the formula to calculate the distance as a function of that is as following:
𝑑 =Δ𝑡 ⋅ 𝑣 ∙ 𝑝 2
where Δ𝑡 is the time measured, 𝑣 is the speed of sound and 𝑝 is a conversion factor from micrometres to centimetres.
Figure 1: Image showing the basic principle behind the Ultrasonic Sensor. (Source: generationrobots.com) Vibration Motors
In order to create tactile communication with the user, vibration motors are used. The vibration motors are electrical motors that have been equipped with weights on their shafts. The weights have a non-uniform shape, and the asymmetrical load will create a wobbling effect during motor rotation that is felt through the casing as vibration. The higher the voltage applied to the motor, the greater the vibrational effect. In this project, the motor are controlled using PWM to control the voltage applied on them between 0V to 3.3V.
14
Figure 2: Picture showing the inside of the particular model of vibration motors used in this project. (Source: vibration-motor.com)
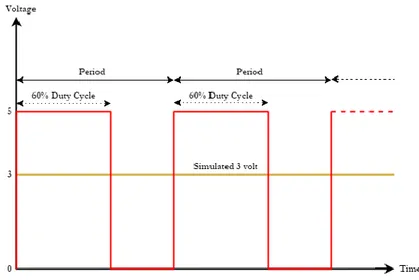
PWM (Pulse-Width Modulation)
The microcontroller that is used in this project, the Arduino Mega, is limited to outputting 5V, 3.3V and GND. However, by using PWM, it is possible to produce voltages in the range between 5V and GND from the Arduino Mega.
PWM works by varying the voltage from the minimum value (i.e., GND) and the maximum value (i.e., 5V or 3.3V) over a very short time period. This is repeated tens of thousands of times per second, depending on the PWM frequency of the specific pin and microcontroller. By varying the ratio of high and low voltage, which is also known as the duty cycle, it is possible to simulate any voltage between the low and the high value. [H. Johansson, 2013].
Figure 3: Graph showing how PWM works.
In Figure 3, the pin outputs 5V 60% of the time and 0V 40% of the time, creating a simulated signal of 3V. If the PWM frequency is 31250 Hz, one period is 32 µs long.
15
2.2 Navigation
Storage
A µSD-card is used to store GPS coordinates that the user is to be guided towards. The Arduino series of microcontrollers can be interfaced with SD-card reader modules, on which
GPS-coordinates can be stored.
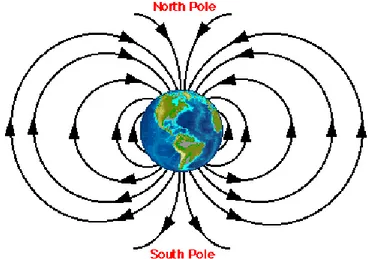
Magnetometer
The magnetometer is a device able to measure magnetic fields around itself [Sang, Jones, 2012]. It is able to do so in three axes at the same time and that makes it possible to calculate the angle it is positioned in relative to magnetic north. By using these signals it is possible to use the
magnetometer as a compass and by putting that on the shirt it can be used to measure what direction the person is facing.
Figure 4: Illustration of the Earth with its magnetic field lines going from south to north. The magnetometer can measure them. (Source unc.edu)
GPS sensor
The GPS sensor picks up GPS coordinates in terms of longitude and latitude [Sanchez, Canton, 1998] and makes them available for calculations on the microcontroller. By creating directional vectors of the coordinates on the SD-card and recalculating the signals on the magnetometer and GPS-module the microcontroller is going to be able to send a signal to the vibration motor mounted on either the left or right shoulder. By doing that it is going to be able to guide the person to where they are supposed to go.
Figure 5: Picture of the Earth with longitudinal (west-east) and latitudinal (north-south) lines drawn out. Picture courtesy of Microsoft Clip Art, used with permission from Microsoft.
17
3 D
EMONSTRATOR
3.1 Problem formulation
The prototype for this thesis project will be based on two functions that would be of use for blind people. The first will be helping them avoid obstacles, while the second will be helping them navigate to distant places using GPS checkpoints. The software algorithms behind those two functionalities are explained in the next section, while the hardware and electronics is explained in the section after that in this chapter. Finally, the sensors used in the obstacle avoidance and navigation will be tested to see how they perform.
3.2 Software
Obstacle Avoidance
The obstacle avoidance part of the shirt comes from the ultrasonic sensors, going through the microcontroller to give an output signal to each corresponding vibration motor. The Arduino already has functions to take a pulse back from one pin and then write a PWM signal to another. However the standard function for this is the “pulseIn” function that works by sending a pulse and then waiting for it to come back. This works really well when you are working with a single sensor but when you are using several ones the program will not be able to have all the sensors pulsing at the same time. That means if the “pulseIn” function is implemented with 6 parallel sensors, 5 of them would always be on standby and the update time would become up to 4 seconds which is way too high.
For this reason the code was written using two different interrupts, one that sends the signal and updates the motor PWM signal for a set time interval (function called “timerIsr”), and another that waits for the interrupt pin to change value and then stores the time accordingly (called “echo_interrupt”). For this purpose an Arduino Mega was chosen since a normal Arduino only has 2 interrupt pins while the Mega has 6.
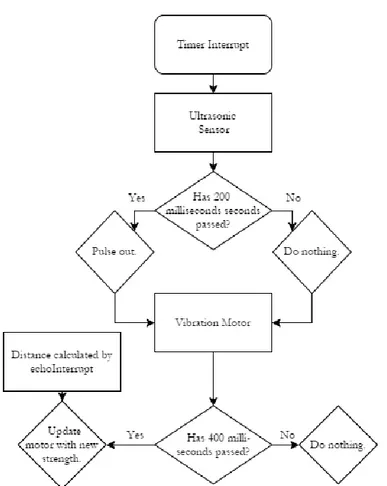
The timer interrupt happens every 50 microseconds and is controlled by the TimerOne library [7]. When the interrupt happens it goes into the “timerIsr” function of the program which first sends out a pulse from each of the six ultrasonic sensors through the “trigger_pulse” function, and then continues to calculate and change the motor PWM signal through the “trigger_motor” function. To reduce unnecessary computing for the Arduino, a wait time for both functions has been implemented. This works by letting the “trigger_pulse” and “trigger_motor” functions only compute if they have been triggered 4000 times since the last time. By then having them trigger every 50 microseconds that leads to a wait time of 200 milliseconds.
The “trigger_pulse” function itself works by setting the trigger pin for the ultrasonic sensor first to HIGH for 50 microseconds and then back to LOW. This is the signal that the
“echo_interrupt” is waiting for and that works by having the corresponding pin on the Arduino react to any changes in its value. When the value rises from LOW to HIGH it means that is the start of the pulse and it stores the start time. When it falls back to LOW again the pulse has ended and the function can calculate its duration.
When the duration has been calculated the value is stored in a global variable that can be reached by the “trigger_motor” function inside of the “timerIsr” interrupt. This function also has a wait time to stop the microcontroller from performing tasks too quickly which has been set to 400
18
milliseconds. From that value the function calculates the appropriate strength between 0-255 and applies it to the sensors corresponding motor.
Figure 6: Flowchart showing the software layout for a single ultrasonic sensor. Navigation
The navigation system runs as its own system, completely separate from the obstacle avoidance system, meaning that it has its own microcontroller, input sensors and output actuators, as shown by the following table. The two output signals are connected to vibration motors, and provide the user with tactile feedback on their left and right shoulders respectively in the form of vibrations.
Table 1: Table listing the navigation algorithm's inputs and outputs.
Input: Output
Stored GPS coordinates Signal Clockwise
Compass heading in degrees Signal Counter-Clockwise
19
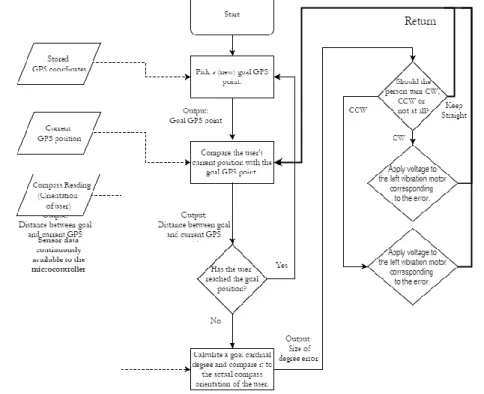
The algorithm itself can be divided into 4 sections, and is presented in the table below:
Table 2: Table showing the 4 main parts of the algorithm. Each part can be further divided into smaller parts.
For a more graphical presentation, a flowchart has been made to illustrate the algorithm:
Figure 7: A flowchart illustrating the navigation algorithm. It will loop through it until there are no more stored GPS coordinates to draw on, at which point the user will have reached their destination. One of the arrows has been
made thicker for visual purposes.
Step in the
algorithm: Action:
1 Declare the next GPS coordinate in line as the goal coordinate to guide the user towards. Proceed to Step 2. 2 Read the current GPS position from the GPS module. Proceed to Step 3
3
Compare the current GPS position with the goal GPS coordinate and calculate two things:
- the distance between them;
- the cardinal degree direction corresponding to a line drawn between the two coordinates, in reference to north.
If the distance between the points is small enough that it can be concluded that the user has reached the goal GPS coordinate, return back to Step 1 for a new goal destination. Else, proceed to Step 4.
4
Receive the user’s cardinal orientation and compare it to the goal cardinal degree calculated in Step 2. The difference between the two is the error. If
the error implies that the person should turn counter-clockwise, the algorithm will send a signal to the vibration motor on the left, and vice-versa
20
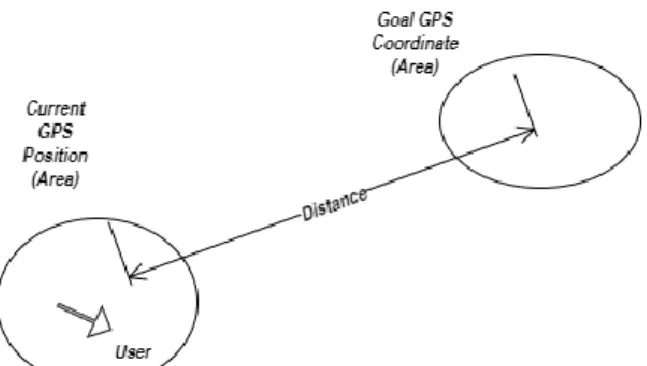
A second figure has been prepared to help the reader visualise what is going on in the physical world. GPS sensor readings might have errors in them, and this uncertainty means that it is more appropriate to think in terms of areas in which the user is likely to be situated in, rather than in terms of absolute points.
Figure 8: A picture illustrating how the terms used in this sub-section are to be visualised.
The user is represented as an arrow in order to show their orientation in regards to north, the degree value of which is measured and used by the algorithm. Similarly, the line’s relation to north in degrees is calculated. Both of those degrees are used in Step 4 of the algorithm, in order to figure out if the shirt, and the person by proxy, is turned in the correct direction.
3.3 Hardware and Electronics
Parts List
Table 3: Table containing the list of all electronic components.
Hardware: Amount Model:
Ultrasonic Sensor [8a] 6x HC-SR04
Vibration Motor [8b] 8x Coin Type Vibration Motor
B103.FL45-00-015
GPS Module [8c] 1x GP3906-TLP
SD-Card Reader [8d] 1x Sparkfun GPS Logger Shield µSD
Socket
µSD-Card [8e] 1x Kingston 4GB SDHC Class 10
Magnetometer [8f] 1x Honeywell HMC6352
Microcontroller [8g] 2x Genuino Mega 2560 Rev3
Obstacle Avoidance Electronics
The obstacle avoidance system is composed of three groups of components: an Arduino Mega, six ultrasonic sensors and six vibration motors. The Arduino is a brand of microcontrollers popular among hobbyists, and the Arduino Mega was specifically selected for the amount of pins that it has. Not only were six interrupt pins required to have all the ultrasonic sensors working at the same time, but each vibration motor also requires a dedicated PWM pin in order to adjust the signal.
The pin producing the PWM signal is not directly connected to the vibration motor, but is rather connected to a transistor which in turn is connected to the vibration motor. This is done in order to create a barrier between the vibration motor and the Arduino, along with making it possible to connect them to an external power supply without losing the ability to control them. The
21
GND, which means that a 100% duty cycle is the equivalent of running the motors at a constant 3.3V.
Figure 9: Block diagram showing the electronics of the obstacle avoidance system.
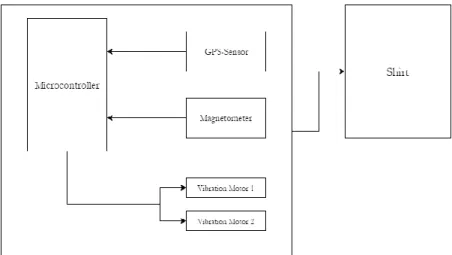
Navigation Electronics
The navigation system uses six groups of components: an Arduino Mega, two vibration motors, one magnetometer, a GPS receiver, a µSD reader and a µSD card. The Arduino Mego is the centrepiece to which every other component is connected.
On top of the Arduino is a Sparkfun GPS logger shield. The GPS logger shield was chosen because it came with both the GPS receiver and a µSD card reader, simplifying the construction. Soldered to the GPS logger shield is the magnetometer, a HMC6352 I2C. The vibration motors are also soldered on the GPS shield and are of the same type as the ones used in the obstacle avoidance system. They are controlled the same way using PWM.
22
Design of the shirt
The shirt used for the project was chosen with a few different criteria that it had to fulfil. It had to be thin so that the vibrations would not be dampened by the material, but also strong enough that it would not break from having all of the electronics assembled on it. It also had to be easy to put on without the risk of getting stuck on, or in some way ruining the components. That is why a work-out shirt with a zipper and thin but still sturdy material was selected. The size was chosen so that most people would be able to wear it, while still being small enough for the sensors to be close to the body.
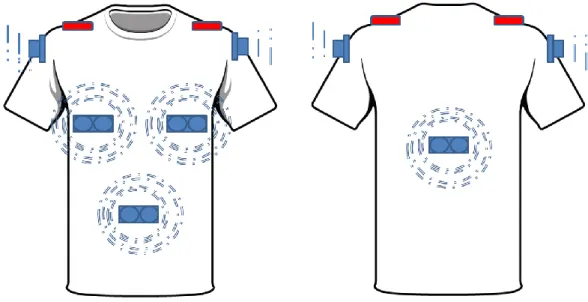
Sensor and Vibration Motor Placement
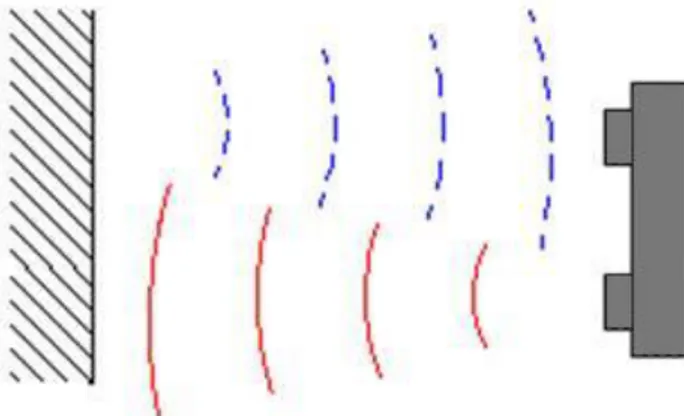
Six sensors and vibration motors are used in the obstacle avoidance part and two separate motors are used for the navigation part of this project and are shown in the figure below:
Figure 11: Picture of the shirt. The blue objects represent the obstacle avoidance ultrasonic sensor and vibration motor pairs, while the red blocks are representing the navigation system's vibration motors. The blue dotted lines
represent the ultrasonic sound waves.
More sensors and motors could be added, but there are limiting factors. More of them would increase coverage, but there is a risk that the user will at some point be overwhelmed to the point where it is not possible to get a clear sense of the outside world. What the number for this specific upper limit has not been looked into, and will require more research which is beyond the scope of this project in terms of time and budget.
23
3.4 Results
GPS Sensor
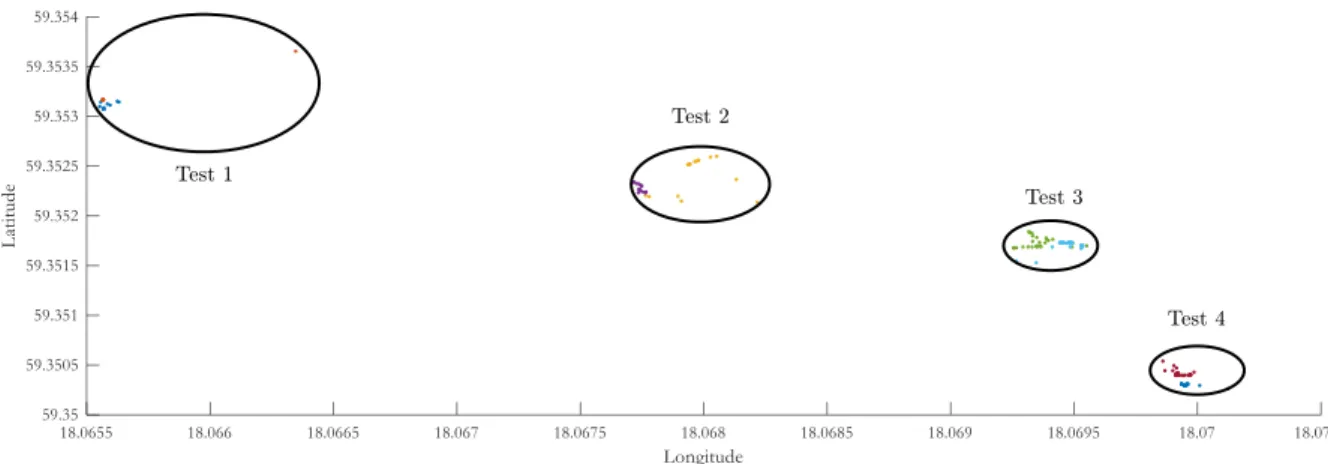
In order to gauge the accuracy and precision of the GPS sensor, four tests were devised and performed twice each over two days, resulting in eight data sets of collected GPS points. In each test, the GPS receiver was left on one spot for a period of time without being moved. It was then left in the same place the day after.
Figure 12: Figure showing the four tests. Within each bubble are two different coloured dots, one colour representing the collected data from day I on that testing area, and the other corresponding to data collected day II.
By comparing the variance in each test, the sensor’s precision can be investigated, and by comparing the calculated expected values of each of the four tests from day one to their counterpart during day two, the accuracy of the sensor can be gauged.
Table 4: Table containing the calculated expected value (mean value) in terms of longitude and latitude of every test.
Test: Expected Value Longitude [deg]: Expected Value Latitude [deg]:
Test 1, day I 18.065581 59.353106 Test 1, day II 18.065637 59.353212 Test 2, day I 18.067964 59.352421 Test 2, day II 18.067743 59.352276 Test 3, day I 18.069349 59.351733 Test 3, day II 18.069469 59.351707 Test 4, day I 18.069927 59.350414 Test 4, day II 18.069952 59.350302
These values have been converted to meters using a conversion equation, the specifics of which can be found in Appendix A. Then, the values from each test were subtracted against each other in order to provide the actual difference in meter in both longitude and latitude. Finally, the Pythagorean Theorem was used in order to calculate the combined actual distance (in a beeline) between the expected value.
24
Table 5: Table containing the comparison values from each test pair.
Test: Expected Value
Longitudinal Difference [m]: Latitudinal Difference Expected Value [m]:
Combined Actual Difference [m]:
Test 1, day I vs. day II 5.876553 11.736014 13.125087
Test 2, day I vs. day II 23.191395 16.053982 28.205871
Test 3, day I vs. day II 12.592613 2.878645 12.917449
Test 4, day I vs. day II 2.623461 12.400317 12.674794
The same procedure for the standard deviation of the test data has been done as well.
Table 6: Table containing the standard deviation in the longitudinal and latitudinal data sets from every test. The values have been converted into meters.
Test: Standard Deviation Longitude
[m]: Standard Deviation Latitude [m]:
Test 1, day I 2.728399 3.542948 Test 1, day II 24.660533 16.275416 Test 2, day I 11.753105 19.707647 Test 2, day II 1.574077 4.428685 Test 3, day I 6.820990 6.089441 Test 3, day II 5.876553 5.646573 Test 4, day I 2.938276 3.321514 Test 4, day II 3.253092 0.885737 Magnetometer
In order to gauge the accuracy and precision of the Magnetometer sensor, it was pointed towards cardinal north, east, south and west at four different locations using a traditional compass, resulting in 12 data sets of degrees.
Figure 13: Graph plotting the 100 data points of every test against their corresponding degree value. Each colour represents one of the three testing areas: Blue for Area I, Red for Area II and Green for Area III.
25
Table 7: Table containing the calculated expected values (mean values) of the 12 data sets of 100 data points each, that were plotted in Figure 13.
Testing Area: Expected Value
North [deg]: Expected Value East [deg]: Expected Value South [deg]: Expected Value West [deg]:
I 255.33 328.08 88.41 193.64
II 255.65 312.22 69.13 185.39
III 259.80 294.18 64.91 197.11
By taking the tabulated data from Table 7 and plotting them as points with the cosine of their value as the x-coordinate and the sine of their value as the y-coordinate, it is possible to plot up and see the inaccuracy of the sensor. This has been done in the following figure, Figure 14.
Figure 14: Two plots showing a graphical representation the mean values of each test (blue, red, green), along with the combined mean values of those mean values (magenta) and what should theoretically be the true readings of
north, east, south and west (black).
The standard deviations in all of the 12 tests have also been calculated in order to measure the precision of the sensor.
Table 8: The standard deviation of all the test data. Testing Area: Standard Deviation
North [deg]: Standard Deviation East [deg]: Standard Deviation South [deg]: Standard Deviation West [deg]:
I 1.50 2.68 43.26 3.55
II 0.70 3.86 5.80 2.46
III 18.53 49.19 24.90 3.84
Ultrasonic Sensors
To make it possible for several ultrasonic sensors to work at the same time on the Arduino interrupts were implemented. This greatly improved the speed at which the sensors update together, however another issue might arise. The “echo_interrupt” function that was mentioned in the software section works by waiting for the value on its corresponding interrupt-pin to change. This happens either when a pulse returns or one is sent out, and by measuring the time with micros() when that happens the duration of the pulse can be calculated.
However an issue arises due to the fact that the interrupts are not able to interrupt each other, which is crucial for the code to work properly. What that means is that if the program is inside an interrupt when the signal returns to the sensor, there might be other interrupts queued to execute before that signal can be handled. This might result in a delay between the time that the signal
26
returns and when it is measured. Since the distance measured by the sensor is directly connected to this time reading, a test was conducted in order to measure the significance of this delay. The test was conducted by turning off all but one of the ultrasonic sensors and then pointing it at an object 1 meter away. The sensor was turned on and some time-measurements were taken. After that, the rest of the sensors were turned on, and while all of them were working separately the same distance was measured again.
Figure 15: Graph showing the pulse durations recorded in microseconds where 60 measurements were taken for both tests. 5900 microseconds should correspond to one meter
From these measurements a mean value was calculated for both of the test runs. Those were then compared to see what the difference would be.
Table 9: Table showing the mean values from the time measurements. Mean with Single
Sensor [µs]: Mean with All Sensors [µs]: Difference [µs]: Difference [cm]:
5927 5970 43 0.73
The ultrasonic sensors are not perfect and they might lose some signals that never return. To investigate these losses a test was conducted where the amount of signals sent, as well as the signals returned were recorded. An object was placed at distances varying from 10 cm to 200 cm to check if that would change the amount of loss. After 60 seconds the sensors were stopped and the readings were taken.
Table 10: Table showing the readings from the test to check for losses.
Distance [cm]: Signals Sent: Signals Returned: % Returned:
10 300 300 100 40 302 302 100 70 303 277 91.4 100 311 289 92.9 125 302 215 71.2 150 303 262 86.5 170 303 166 54.8 200 303 164 54.1 5500 5600 5700 5800 5900 6000 6100 6200 1 3 5 7 9 1113151719212325272931333537394143454749515355575961 Single Sensor All Sensors
27
4 D
ISCUSSION AND
C
ONCLUSIONS
4.1 Discussion
GPS Sensor
The GPS receiver’s role in the shirt is crucial for the navigation system, and it is reliant on it providing accurate and precise output, down to within a meter of error in any direction. There are many potential scenarios where anything above that is unacceptable, such as walking on the pavement next to a road with cars driving at high speeds. Thus, the test data should be judged in relation to those needs.
Considering such a scenario, it can be inferred from Table 6 that the sensor is too imprecise. Despite being completely still, the sensor delivered relatively varied readings, with one test, Test 4 day II, being the only test to provide acceptable readings – but only the latitudinal parameter. Most of the other tests provided some bad readings of 5-10 meters of standard deviation. Another point of issue is the expected value. Instead of relying on outside sources for GPS coordinates for the testing places that could then be compared to the measured expected values, it was decided that it was better to see how consistent the GPS sensor was with itself over different days. The combined actual difference is big for every test, but it is worth pointing out that if you look at Figure 12, there are no cases where the day I test produced points that intermingled with the day II test. Rather, the points appear to concentrated to themselves, especially in Test 3 and Test 4.
This seems to indicate that there is bias in the data causing all of the points in each respective test data to be translated sideways. This bias also seems to be constantly changing, since the data points are not consistently shifted from each other in a specific direction or degree, but rather arbitrarily – the Test 3 day I and day II data points are shifted along a horizontal axis, whereas the Test 4 day I and day II data points are shifted along a vertically axis.
Magnetometer
Compared to the GPS receiver, there are much lower requirements on the magnetometer. It can still work in the navigation algorithm even if it’s not providing pinpoint accuracy and precision. Having said that, the magnetometer appears to be very precise and somewhat accurate. In many of the tests, the standard deviation is in the single digit order of magnitude, which is very good. However, some really weird data was recorded in the beginning of the tests measuring south (as can be seen in Figure 14), which seems to have affected the variance of those tests very much. The fact that the measurements eventually seem to converge towards a value is good, but it would definitely be worth investigating why the readings are irregular when first going from east to south, even when changing location.
Looking at the expected values, the magnetometer seems to be consistent with itself in that each cardinal direction corresponds to a specific degree value in the magnetometer, with a small margin of error in terms of 5-10 degrees either way included. An error margin that small (9 degrees of error is the equivalent of a 9/360, or 2.5%, margin of error) could potentially be attributed to issues with the testing and not necessarily with the sensor itself.
28
Albeit the sensor is consistent, there is a very peculiar problem with it that is illustrated by Figure 14, which is that a 90 degree turn of the sensor does not correspond to a 90 degree change in the sensor readings. Fortunately, since this difference seems to be consistent, it should be possible to, after further testing, program software that will compensate for this and help make it give
adequate readings for the shirt. It is strongly suspected that it has to do with the tilting of the sensor in relation to the ground and the magnetic fields.
Ultrasonic Sensors
An issue arises for the obstacle avoidance part when it comes to deciding the distance at which the motors should start giving an output. When the user is inside of a building there are often walls around the person at very small distances. The amount of dangerous hazards are usually also very few, therefore the objects that the user is interested in is probably within 1 meter. If the motors were to start to vibrate at a larger sensor reading than that, it would probably mean that the motors would be vibrating at all times because of the walls. By limiting it to 1 meter the user would be able to sense the objects nearby while not getting overwhelmed by too many vibrations. However, when the user is walking outside there are no walls nearby, and there are a lot fewer objects that needs to be avoided. Instead there are a lot more hazards that could be dangerous and by the time they are within 1 meter of the user it could be too late for them to avoid it. Therefore when the user is outside, 1 meter is not enough and the vibration motors needs to start vibrating at a greater distance. This becomes an issue for the shirt which can be seen in Table 10. Within 1 meter almost all of the signals return, but when the sensor tries to measure distances approaching 2 meters a lot of the signals start falling off. As can be seen, when the object is 200 cm away almost half of the signals get lost. When a signal gets lost that means that the next reading taken by the ultrasonic sensor is going to be larger than it is supposed to, which is going to make it harder for the shirt to take accurate readings and it might cause confusion for the user. When it comes to the delay caused by the interrupts, it can be seen in Figure 15 as well as Table 9 that the time measurements does get a slightly delayed when the amount of interrupts increase. The delay is however very small and should at most result in the readings becoming a few centimeters too big.
This is very good since exact measurements are not something that is going to make a difference for the purpose of this project. The vibration motors are very good due to the fact that they can give a weaker or stronger signal depending on the PWM that is sent. However due to the way that the software is working, a difference in a few centimetres is only going to make a very small change in the PWM signal to the motors. This change is not something that the user of the shirt is going to take notice of.
29
4.2 Conclusions
In the end, in regards to the GPS sensor, it comes down to whether or not the shirt is used as an independent system, or if it is used along with more established tools such as a cane or a guide dog that can make up for its lack of precision. The GPS sensor might still be able to provide relevant information for the navigation system of the shirt as it is.
As the GPS sensor is right now it is not good enough to provide readings that are accurate and precise enough for the navigation system in the guiding shirt to be used safely without any other supplemental tool. This is unfortunate as one of the goals of the project was to try to eliminate the use of a cane or a guide dog.
The magnetometer on the other hand has a shot at working, provided that it is supplemented with compensational software. It will need some more test data to calibrate with but it should be doable considering how consistent its values are.
By looking at Table 10 it becomes apparent that for the ultrasonic sensors, the farther the distance is more signals are going to be lost. A lost signal means that the next one that returns to the sensor is going to be bigger than it’s supposed to. This might cause the vibration motor to flicker on and off which is going to be annoying for the user. Therefore it is recommended to keep the maximum distance that the vibration motors get an output from within a meter. This means that the obstacle avoidance part of the shirt is not in its current state going to have the range that was desired when using it outdoors. Indoors however it is going to have all the desired features from the ultrasonic sensors, both in terms of range as well as update speed.
What can be said for the overall performance of the shirt is that in its current state the navigation part of the shirt is able to act as a guide, telling the user if they are starting to walk the wrong way. It is however not able to work on such a specific level that it can work all on its own, for example it could never manage to keep the user on the sidewalk. It is also not possible to use it indoors due to the limited signal that a GPS can receive while indoors. On the other hand, the obstacle avoidance part performs really well indoors and at helping the user avoid nearby objects. It is however, due to its aforementioned limitations, not as good outdoors. With that being said it becomes apparent that the design of the shirt still needs a lot of work. However, it can also be seen that both the obstacle avoidance and the navigation parts of the vest could be taken to a level where they would be of use to a blind person.
31
5 R
ECOMMENDATIONS AND FUTURE WORK
GPS Sensor
One way to improve the GPS sensor’s reading is to introduce “Differential GPS”. Differential GPS is a method of enhancing the normal GPS by using fixed base stations whose coordinates were already well known, with their own GPS receiving capabilities. By continuously measuring the output of their own sensors and comparing it to true values, the local error can be calculated and nearby mobile GPS units can compensate for it. Differential GPS could be enough to make the current sensor work much better, and is definitely worth investigating as an alternative to having to buy a more expensive sensor.
Magnetometer
As mentioned in the previous chapter, the magnetometer is adequate if properly compensated. However there are magnetometer sensors out there that use accelerometers to compensate for sensor tilting, which might allow for better readings in situations where the user might not be on perfectly flat ground.
Ultrasonic Sensors
As it is right now, the 6 ultrasonic sensors can work together without causing too much delay for each other. However in the future it might be desired to increase the number of sensors and vibration motors in order to create a more complete grid across the chest. In that scenario the measuring delay might get to a level where it’s actually noticeable for the user. By that point changes might have to be made to the Software to optimize it further or perhaps an additional Arduino should be considered.
Right now the sensors are able to measure distances beyond the limitation of 1 meter that has been set. Due to lost signals however it should not be set any higher than this since that would cause the motor to flicker on and off. If one were to rewrite the software in a manner that could handle the lost signals better than it currently is, the maximum distance could be set higher. This would in turn mean that a slider could be implemented, where the user could manage the
33
R
EFERENCES
[1] D. Sang, G. Jones, Cambridge University Press, “Cambridge O Level Physics with CD-Rom”, 2012
[2] Image showing ultrasonic sensor.
http://www.generationrobots.com/en/content/65-ultrasonic-sonar-sensors-for-robots
Viewed: 2016-05-08
[3] Image showing vibration motor.
http://www.vibration-motor.com/images/pancake-coin-vibration-motor-production-line.jpg
Viewed: 2016-05-08
[4] H. Johansson, KTH Institutionen för Maskinkonstruktion Mekatronik, ”Elektroteknik”, 2013 [5] Illustration of planet Earth with magnetic field lines.
http://www.unc.edu/depts/oceanweb/turtles/geomag.gif
Viewed: 2016-05-08
[6] J. Sanchez, M.P Canton, CRC Press, “Space Image Processing Volume 1”, 1998 [7] TimerOne Library
https://code.google.com/archive/p/arduino-timerone/downloads
Viewed: 2016-05-16
[8] Datasheets for all the electronics
[a] https://cdn.sparkfun.com/datasheets/Robotics/B1034.FL45-00-015.pdf [b] https://cdn.sparkfun.com/assets/learn_tutorials/4/6/8/ GP3906-TLP_DataSheet_Rev_A01.pdf [c] https://www.sparkfun.com/datasheets/Components/HMC6352.pdf [d] http://www.kingston.com/datasheets/sdc4_us.pdf [e] http://www.electrokit.com/productFile/download/5901 [f] https://www.arduino.cc/en/Main/ArduinoBoardMega2560 [g] http://cdn.sparkfun.com/datasheets/Dev/Arduino/Shields/GPS_Logger_Shield_v20.pdf Viewed: 2016-05-08
35
A
PPENDIX
A:
A
DDITIONAL INFORMATION
Degree of Latitude and Longitude Conversion
The GPS sensor gives values in terms of latitude and longitude, which together make up a coordinate system that allows for unique positioning on the surface of the Earth.
The following equations and are used in this report to convert from degrees to meters:
1 111132.09 566.05cos(2 ) 120cos(4 ) 0.002cos(6 )
2 1111415.13cos( ) 94.55cos( ) 0.12cos( )
where δ1 and δ2 are the conversion factors in the unit of meter/degree, and λ is the latitude in degrees.
The first equation provides the meter per degree latitude conversion factor, and the second equation is the equivalent equation for the meter per degree longitude conversion factor [Sanchez, Canton, 1998]. Since the Earth is not a perfect square, these conversion factors are different depending on what latitudinal line the location these conversions are being calculated for is located. For this thesis’ purposes, a rough latitude value of 59.35 was used (refer to Table 4).
36
TRITA MMKB 2016:21 MDAB082