Thomas Lundberg
Peter Andrén
Thomas Wahlman
Olle Eriksson
Leif Sjögren
Peter Ekdahl
New technology for road surface measurement
Transverse profile and rut depth
VTI r
apport 961A
|
New technology for r
oad surface measur
www.vti.se/en/publications
VTI rapport 961A
VTI rapport 961A
New technology for road surface
measurement
Transverse profile and rut depth
Thomas Lundberg
Peter Andrén
Thomas Wahlman
Olle Eriksson
Leif Sjögren
Peter Ekdahl
Reg. No., VTI: 2015/0655-9.1 Publication: VTI rapport 961A Cover pictures: Ramböll
Abstract
The condition of the national coated road network is measured annually in Sweden and Finland. The measuring technology has been unchanged over a long period of time, which has its benefits. As the measurements are performed using the same technology, trends and measurement series are retained without any disruption. In addition, the technology currently used is reliable and can be procured at a price level that has fallen rather than risen over the years. The principal area of use for condition measurement is to provide maintenance work with an objective basis for the planning of surfacing, but when it is found that current objective condition data can only explain between 40 and 75 percent (depending on class of traffic) of the action actually taken on the road network, consideration must be given to whether new condition data need to be added. The information that is lacking is thought to be information on surface damage and cracks. This requires new measuring technology.
If new technology will be adopted, for the collection of condition data, the dependability of the basic measured quantities must be ensured before new options and measured quantities are examined. This study is therefore focused only on transverse-profile measurement and measures of unevenness in the transverse direction (rut depth and ridge height).
The study has examined two of the leading new technologies that operate with scanning lasers, LCMS from Pavemetrics and PPF from Fraunhofer. The outcome of the study shows that the technology is good, and that accuracy and repeatability are comparable to the present-day point-laser systems. It is also deemed possible to retain criteria and requirements for the procurement of measurement services when the new technology is used.
Title: New technology for road surface measurement: Transverse profile and
rut depth
Authors: Thomas Lundberg (VTI, www.orcid.org/0000-0002-9893-0067)
Peter Andrén (Datamani, www.orcid.org/0000-0002-4317-6351) Thomas Wahlman (Ramböll)
Olle Eriksson (VTI, www.orcid.org/0000-0002-5306-2753) Leif Sjögren (VTI, www.orcid.org/0000-0002-2397-0769) Peter Ekdahl (Ramböll)
Publisher: Swedish National Road and Transport Research Institute (VTI)
www.vti.se
Publication No.: VTI rapport 961A
Published: 2018
Reg. No., VTI: 2015/0655-9.1
ISSN: 0347–6030
Project: Description of method and development opportunities for road surface
measurement
Commissioned by: Swedish Transport Administration, Finnish Transport Agency Keywords: Road surface measurement, rut depth, transverse profile, scanning
laser
Language: English
Referat
I Sverige och Finland mäts tillståndet på det statliga belagda vägnätet årligen. Mättekniken har varit densamma under en lång tid vilket har sina fördelar. I och med att mätningarna utförs med samma mätteknik bibehålls trender och mätserier utan störningar. Den nuvarande tekniken är dessutom driftsäker och kan handlas upp till en prisnivå som genom åren snarare sjunkit än ökat. Det huvud-sakliga användningsområdet för tillståndsmätningen är att förse underhållsverksamheten med ett objektivt underlag för beläggningsplaneringen, men när det visar sig att nuvarande objektiva tillstånds-data endast kan förklara mellan 40 och 75 procent (beroende av trafikklass) av de åtgärder som verkligen görs på vägnätet, måste det övervägas om denna ska kompletteras med nya tillståndsdata. Den information som saknas tros vara information om ytskador och sprickor. Detta kräver ny mätteknik.
Om ny teknik ska börja anammas, för insamling av tillståndsdata, måste först de grundläggande mätstorheternas tillförlitlighet säkerställas, innan nya möjligheter och mätstorheter undersöks. Denna studie är därför endast inriktad på tvärprofilmätning och mått för ojämnhet i tvärled (spårdjup och spårrygg).
I studien har två av de ledande nya teknikerna som arbetar med skannande laser undersökts, LCMS från Pavemetrics och PPS från Fraunhofer. Resultatet av studien visar att tekniken är bra, noggrannhet och repeterbarhet går att jämföra med de nuvarande punktlasersystemen. Kriterier och krav för
upphandling av mättjänster där den nya tekniken används bedöms också kunna bibehållas.
Titel: Ny teknik för vägytemätning – Tvärprofil och spårdjup
Författare: Thomas Lundberg (VTI, www.orcid.org/0000-0002-9893-0067)
Peter Andrén (Datamani, www.orcid.org/0000-0002-4317-6351) Thomas Wahlman (Ramböll)
Olle Eriksson (VTI, www.orcid.org/0000-0002-5306-2753) Leif Sjögren (VTI, www.orcid.org/0000-0002-2397-0769) Peter Ekdahl (Ramböll)
Utgivare: VTI, Statens väg och transportforskningsinstitut
www.vti.se
Serie och nr: VTI rapport 961
Utgivningsår: 2018
VTI:s diarienr: 2015/0655–9.1
ISSN: 0347–6030
Projektnamn: Beskrivning av metod och utvecklingsmöjligheter för vägytemätning Uppdragsgivare: Trafikverket, Sverige, Trafikverket Finland
Nyckelord: Vägytemätning, spårdjup, tvärprofil, skannande laser
Språk: English
Foreword
This report has been made possible by funding from the Swedish Transport Administration and the Finnish Transport Agency. In Sweden, the project is part of the industry programme BVFF (Bana väg
för framtiden, Preparing the Way for the Future). VTI has managed the project together with Ramböll
and has also contributed with its own resources and in kind.
We wish to express our sincere gratitude to Lehman + Partner from Germany and Vars from the Czech Republic, who performed measurements on which the analysis and final conclusions are based. VTI and Ramböll also contributed measurements that have been used in the project.
Linköping, December 2017
Thomas Lundberg Project Manager
Quality review
External peer review was performed on 7 December 2017 by Fredrik Lindström of the Swedish Transport Administration. Thomas Lundberg made adjustments to the final report manuscript. Anita Ihs, research director, then reviewed and approved the report for publication on 8 January 2018. The conclusions and recommendations expressed are the authors’ own and do not necessarily reflect the views of VTI as a government agency.
Kvalitetsgranskning
Extern peer review har genomförts 7 december 2017 av Fredrik Lindström, Trafikverket. Thomas Lundberg har genomfört justeringar av slutligt rapportmanus. Avdelningschef Anita Ihs har därefter granskat och godkänt publikationen för publicering 18 januari 2018. De slutsatser och
rekommendationer som uttrycks är författarnas egna och speglar inte nödvändigtvis myndigheten VTI:s uppfattning.
Table of contents
Summary ...9
Sammanfattning ...11
1. Introduction and background ...13
1.1. Development of the measurement technology ...13
1.2. Options with scanning equipment ...17
2. Aim and limitations ...18
3. Method ...19
3.1. Measures to be tested ...19
3.2. Data processing ...23
3.3. Swedish Transport Administration requirements in procurement ...23
3.3.1. Requirements for test sections ...24
3.3.2. Requirements for project level sections ...27
3.3.3. Requirements for road-network loop ...28
3.4. Finnish Transport Agency requirements in procurement ...30
3.4.1. Production control method in Finland ...31
4. Description of measurement system and measurement programme ...33
4.1. Reference measurement ...33
4.2. Measurement with present-day technology ...36
4.3. Measurement with new technology ...37
4.3.1. Description of the sensor Fraunhofer PPS. ...39
4.3.2. Description of the sensor Pavemetrics LCMS ...40
4.4. Performed measurements ...41
5. Results ...43
5.1. Project level measurement ...43
5.1.1. Without automatic lateral correction...44
5.1.2. With automatic lateral correction ...55
5.2. Test sections ...60
5.2.1. Without automatic lateral correction...60
5.2.2. With automatic lateral correction ...67
5.2.3. Adjustment of lateral position according to shape of profile ...72
5.3. Road-network loops ...76
5.3.1. Requirements in Sweden...78
5.3.2. Requirements in Finland ...82
5.4. Conversion between point laser and scanning laser ...85
6. Conclusions ...92
6.1. Market-related consequences ...94
6.2. Technical consequences ...95
7. Proposals for continued development and evaluation ...98
References ...101
Annex 1. Results of repeatability test on Project level section E ...103
Annex 3. Results for validity and repeatability on test sections ...115 Annex 4. Results from the Finnish routine control method ...129 Annex 5. Validity for rut depth on test sections ...133
Summary
New technology for road surface measurement - Transverse profile and rut depth
by Thomas Lundberg (VTI), Peter Andrén (VTI), Thomas Wahlman (Ramböll), Olle Eriksson (VTI), Leif Sjögren (VTI) and Peter Ekdahl (Ramböll)
Scanning-laser technology, which permits comprehensive transverse profile measurement, has
developed greatly over the past decade. Today it is a technology that is commonly used both in Europe and internationally to describe the condition of the road network (road surface). The old technology, based on point lasers, is, however, still in use in Sweden and Finland. This technology is tried and tested and provides a dependable result. At the same time, maintenance work provides evidence that the measurements supplied by the point-laser systems are insufficient to provide an objective basis on which sections is chosen for action. The information that is lacking is the condition of the surface with regard to surface damage and cracks. With comprehensive transverse-profile measurement there are opportunities to obtain this information, thanks to the development taking place in the technology with increasing resolution in the transverse and longitudinal directions, combined with better accuracy. Before a study is made of quality and the prospects of detecting surface damage and cracks, it must be ensured that that the new technology can fulfil the basic functions (transverse-profile and rut-depth measurement). The purpose of this study was to examine this through a number of technical tests equivalent to those performed at the Transport Administrations in procurement of the road surface measurement service. The aspects included in the tests are:
1. measurement of road-network loop – repeatability and reproducibility 2. measurement of project level sections – repeatability
3. measurement of test sections – validity and repeatability.
The outcome of the study shows that the technology for comprehensive transverse-profile
measurement provides dependable values in measuring transverse profile and rut depth on the test sections and objects used. The methods and limit values normally used to approve the point-laser systems can also be used for the systems with the comprehensive measurement of transverse profile, with no impact on approved outcome. It should be mentioned that some aspects of the tests have not yielded an approved outcome (according to the procurement requirements), particularly in
measurement of the loop included in the study. We attribute this primarily to the human factor in ensuring the correct lateral positioning of the measuring vehicle.
Some minor changes are required in the method descriptions governing requirements and method for condition measurement to match the scanning technique. The changes required relate to how the transverse profile is to be filtered before further processing. There must additionally be incentives to persuade suppliers to invest in the new technology. The Transport Administrations must clarify conditions and requirements in procurements so that the technology achieves a breakthrough. Procurement of the technology solely to obtain a more detailed transverse profile is not sufficiently strong justification for the expected increase in costs the new technology entails. There is demand within the Swedish transport authorities for added value in the detection of surface damage and cracks, and there are opportunities with the new technology.
As the outcome of the study on transverse profile and rut depth is favourable, it provides opportunities to study what value the new technology can add. The obvious next step is to examine the possibility of detecting surface damage and cracks, which will be studied in a continuation project funded by the
Swedish Transport Administration (under the sector programme BVFF (Bana Väg För Framtiden, Clearing a Road for the Future).
Sammanfattning
Ny teknik för vägytemätning - Tvärprofil och spårdjup
av Thomas Lundberg (VTI), Peter Andrén (VTI), Thomas Wahlman (Ramböll), Olle Eriksson (VTI), Leif Sjögren (VTI) och Peter Ekdahl (Ramböll)
Tekniken med skannande laser som möjliggör heltäckande tvärprofilmätning har genomgått en stor utveckling det senaste decenniet. I dagsläget är det en vanligt använd teknik, i såväl Europa som internationellt, vid beskrivning av vägnätets (vägytans) tillstånd. I Sverige och Finland används dock fortfarande den gamla tekniken, baserad på punktlasrar. Tekniken är beprövad och ger ett tillförlitligt resultat. Samtidigt ger underhållsverksamheten indikationer på att de mått som punktlasersystemen levererar inte är tillräckliga för att ge ett objektivt underlag vid val av sträckor för åtgärd. Den
information som saknas är framförallt ytans tillstånd gällande ytskador och sprickor. Med heltäckande tvärprofilmätning finns möjligheter att få den informationen, tack vare den utveckling som sker av tekniken med ökande upplösning i tvär- och längsled i kombination med bättre noggrannhet. Innan en undersökning av kvaliteten och möjligheterna att detektera ytskador och sprickor genomförs, måste det säkerställas att den nya tekniken klarar att leverera de grundläggande funktionerna (tvärprofil- och spårdjupsmätningen). Syftet med denna studie har varit att undersöka just detta genom ett antal tekniska tester motsvarande de som genomförs vid Trafikverkens vid upphandling av
vägytemät¬tjänsten. De moment som ingått i testerna är:
1. mätning av vägnätsslinga – repeterbarhet och reproducerbarhet 2. mätning av objektsträckor – repeterbarhet
3. mätning av teststräckor – validitet och repeterbarhet.
Resultaten från studien visar att tekniken för heltäckande tvärprofilmätning ger tillförlitliga värden vid mätning av tvärprofil och spårdjup på de teststräckor och objekt som använts. De metoder och
gräns¬värden som normalt används för att godkänna punktlasersystemen kan också användas för systemen med den heltäckande tvärprofilmätningen, med bibehållet godkänt utfall. Det ska nämnas att vissa moment av testerna inte gett ett godkänt resultat (enligt upphandlingskrav), framförallt vid mätning av den slinga som ingår i studien. Detta hänvisar vi framförallt till den mänskliga faktorn vad gäller att säkerställa mätbilens korrekta sidolägesposition.
Det krävs vissa mindre förändringar av de metodbeskrivningar som reglerar krav och metod för tillståndsmätningen för att passa den skannande tekniken. De förändringar som krävs rör framförallt hur tvärprofilen ska filtreras innan vidare bearbetning. Vidare måste incitament finnas för att leverantörerna ska våga investera i den nya tekniken. Vid upphandlingar måste Trafikverken tydligt klargöra villkor och krav för att tekniken ska få genomslagskraft. En upphandling av den nya tekniken enbart för att få en mer detaljerad tvärprofil är inte en tillräckligt stark motivering för den förväntade kostnadsökning som den nya tekniken medför. Mervärden i form av detektering av ytskador och sprickor är efterfrågat inom Trafikverken och möjligheterna finns med den nya tekniken. I och med att resultatet av undersökningen avseende tvärprofil och spårdjup är positivt, ger det möjligheter att undersöka vilket mervärde den nya tekniken kan ge. Det uppenbara nästa steget är att undersöka möjligheten att detektera ytskador och sprickor vilket kommer att studeras i ett
fortsättningsprojekt finansierat av svenska Trafikverket (inom branschprogrammet BVFF, Bana Väg För Framtiden).
1.
Introduction and background
The state of the road surface is an important indicator of the road’s condition. Damage that is not visible on the surface is normally relatively minor. It can generally be said that the information needed to decide on the need for maintenance consists of the answers to three questions:
1. Is the road surface sufficiently intact (free of cracks)?
2. Is the road surface sufficiently even (absence of deformations, rutting, unevennesses and subsidence)?
3. Is the rate of change low?
It is not always economically optimal to look solely at the condition of the surface, nor does this cover all aspects and needs, although it does cover very many. With a limited budget, priorities must be set, and the choice between dealing with an uneven road segment with surface damage or a section of road with a good standard of surface but a weak road structure is a fairly simple one – action is obviously taken on the uneven segment with surface damage.
The method we currently use in Sweden and Finland to measure the condition of the road surface is known as road surface measurement with a survey vehicle. This is a technique safe for traffic that is carried out without a major impact on other road users, as measurement can be performed at speeds of between 15 km/h and 90 km/h. The technique is contactless and non-destructive, which is aimed for. It is well developed for its purpose and inexpensive, as large volumes can be measured at high quality over a relatively short period of time. The principal components in the equipment are the range-finding lasers (referred to in the text as lasers). The laser measures the distance between the vehicle and the road surface by triangulation at high speed and accuracy, normally 32,000 times per second.
1.1. Development of the measurement technology
Technology for measuring road-surface condition has been developed over the years. As always happens, this development takes place thanks to two simultaneous factors, the current technological front line, i.e. “what can be done” and the need for new information, i.e. “what is needed”. These do not always complement each other, but they drive development. The state of roads changes constantly, and always for the worse unless action is taken. Road condition was at first assessed manually and visually. The need for objective assessments and more quantifiable methods led to the use of straightedges, first made of wood and later metal. A point was measured where the vertical distance from the road surface deviated most from the straightedge. This was soon developed into non-contact methods that could measure at speed. Contactless measurement in this context means ultrasound or laser technology (no contact with the measured object).
Laser (light amplification by stimulated emission of radiation) became the most commonly used technology. The measurement was initially performed with discrete measuring points, particularly in the transverse direction. It was possible to measure almost continuously along the road in the
longitudinal direction, but sparsely across the road, generally only in one or two ruts along the road. Figure 1 Illustrates almost a hundred years of development, starting in 1920 at the bottom and then how development took place upwards in the diagram until 2017. In the transverse direction across the road, measurement expanded from at least three measurement points to more than 40 measurement points (Germany). In Sweden, measurement started with 26 measurement points (1975), but with contact with the road (Saab RST).
A pioneer in this area was Dr Ulf Sandberg (VTI) who, together with the Selcom company, tested one of its lasers for road purposes. Quite soon, after some fine adjustment and a large amount of testing, the laser had been adapted to measure the road surface. The idea creator Dr Peter W. Arnberg (VTI) initiated and realised the first multifunctional survey vehicle in which several lasers were combined
into something that came to be the first Laser RST. It was equipped with eleven lasers and two accelerometers, and by 1986 development had reached the stage where rutting, evenness and macrotexture could be measured in a measurement system adapted to routine use. The annual road network-wide inventory of national roads in Sweden using that very technology began the same year. Hand in hand with the introduction of new measurement technology and as new needs arose, more measured variables were introduced into the same measurement system.
When non-contact measurement was first introduced (in 1980), the number of measurement points was reduced to 11, principally for financial reasons (the laser sensors were relatively expensive). Following an investigation aimed at optimising the number of measurement points to be able to calculate rut depth sufficiently well, it was found that 17 measurement points was a good compromise between quality and cost. There was now a method by which data is collected continuously in the longitudinal direction, but in approximately 17 to 40 lines (measurement points) in the transverse direction. This means that there is a resolution of 1 mm sampling in the longitudinal direction, but 100 to 235 mm in the transverse direction.
Figure 1. Development of point density in measurement of road-surface condition.
The most recent development is focused on being able to measure continuous transverse profiles. This is actually nothing new: as long ago as 1968 a description was presented of how a line laser that was projected onto the road surface and a camera that read off the shape of the line was being tested in France. This must be regarded as a technology at the limits of what was technically possible at the time, if it is borne in mind that laser light technology appeared in the 1960s. Several trials and developments have taken place in measuring a continuous transverse profile using projected line or with a scanning point across the road. Today there are scanners that, using a laser beam, scan objects at longer distances (one to hundreds of metres) using LIDAR (light detection and ranging). The main unit is located at a point and then scans across a three-dimensional area and determines the distance to fixed objects, for example a bridge. A point cloud is formed that can visualise the surface. This means that, at the same time as collecting the constantly changing condition of the road surface, more static data is now also collected, such as ditch profiles and the presence of an embankment or cutting, as there is a wish to have this in digital form synchronised with condition data. These scanning methods have also been developed with increased accuracy. There are nowadays installations of this kind on moving survey vehicles.
An example of more recent measuring systems is the LCMS1, Laser Crack Measurement System from
Pavemetrics, Canada, which consists of two scanners located at roof height behind the survey vehicle, around 2 metres above the road surface. Two scanners are used to obtain higher accuracy.
Figure 22. VIA PPS from ViaTech, Norway, example of a 3D survey vehicle. Photograph ViaTech AS.
Another example is the Fraunhofer Pavement Profile Scanner PPS3, from the Fraunhofer Institute
in Germany, which uses the same technology as the LCMS, but with only one scanner.
VIA PPS4from ViaTech AS in Norway (Figure 2) uses a scanner (LIDAR Z+F profiler 9012) that
utilises a rotating mirror so that measurement can take place for the whole circuit and along the road profile, for example imaging a tunnel-wall profile.
PaveVision3D5 (Wang) is an American system described as being capable of surveying with
sub-millimetre accuracy at high speed.
1 http://www.pavemetrics.com/applications/road-inspection/laser-crack-measurement-system/ 2 Used with permission from ViaTech AS
3
https://www.ipm.fraunhofer.de/en/bu/object-shape-detection/applications/measurement-techniques-for-the-road.html
4 http://www.viatech.no/products.aspx?lang=en&id=6 5 Network level pavement evaluation with 1 mm 3D
Gocator from LMI has been integrated for pavement profiling in International Cybernetics Corporation's (ICC) road profilers.6
All these are complete systems, which indicates that they can survey road-surface characteristics such as transverse profile, surface damage and cracks, at traffic speed.
In addition to these, there are several systems that scan the surroundings and generate 360-degree films/images from the surroundings, such as Street Mapper7, and Road Scanner C8 from SITECO.
In other words, a clear ongoing trend can be seen towards linking the two methods partly to survey road-surface condition, which requires high accuracy, to the methods for collecting the surrounding road environment digitally. This increases the complexity in the design of measurement systems and the requirements regarding how measurements are to be performed, in particular specifications for how data is to be formatted and delivered. Substantial development will take place here.
In addition, there are other sensors or measuring instruments that are also used for high-precision measurement of the road surface. Some examples of these are variants of Gocator line lasers, which can scan profiles at high accuracy (µm). An implementation of this can be seen in the British company WDM's manually operated macrotexture meter TM29. In addition, there are sensors that can
principally be used statically to capture in a measurement and image a surface in three dimensions. An example of this is LMI’s Gocator 3D sensor10 which, using two cameras and an advanced LED light
that scans the object almost immediately, can image a small surface (100*150 mm) digitally in three dimensions, see Figure 3, where a pavement from a cycle path is illustrated.
Figure 3. A digitised asphalt surface of approx. 100*150 mm with heights displayed in colour; red represents peaks and blue low points.
6 https://lmi3d.com/solutions/industries/road 7 https://www.3dlasermapping.com/streetmapper-lidar-system/ 8 http://www.sitecoinf.it/en/solutions/road-scanner 9 https://www.wdm.co.uk/equipment/equipment-tm2/ 10 https://lmi3d.com/products/gocator
1.2. Options with scanning equipment
The new technology with scanner laser or line laser is being used increasingly in large parts of the world. The new technology has two main elements, the first being use of an emitting laser source that is dispersed using rotating mirrors while the second is an emitting laser source that is dispersed using a prism. A feature common to both technologies is that reflecting light from the road surface is received by a CCD receiver that converts the reflecting light (the photons) into electrical signals in order to determine range. As well as range finding, the technology enables an image of the exposed surface to be provided. This can be used to determine the lateral position of the survey vehicle in relation, for example, to a road marking. A difference in contrast is required between the objects to be detected and the surface, and a white road marking can be distinguished relatively easily from a dark road surface. The advantage that is gained in a change-over from a limited number of lasers (point lasers) to scanning laser is that an almost continuous profile is obtained. The question is, however, whether the technology is mature enough to be used in Sweden and Finland.
The focus in this project has been on those parameters and measures that can be calculated form the transverse profile of the road surface. In everyday language the term “scanning laser” is used for measurement of the road surface with one or more sensors that have high density between the measurement points in both the longitudinal and transverse directions, usually less than 10 mm, and that measure across a greater width, usually 4 m or more. The term sensor is proposed as a suitable name for this type of measurement for a comprehensive transverse profile as the technological solutions are different for different types of sensors. Some of the arguments that justify the use of a sensor for a comprehensive transverse profile instead of the currently used systems with point-laser sensors are listed below.
• Less sensitive with respect to lateral positioning. At present, the driver attempts to position the vehicle so that a particular point laser hits the deepest part of the selected wheel track.
• Greater density of measurement points across the road. This may be an advantage for example in the case of plastic deformations and heavy wear by studded tyres.
• Possibility of limiting the transverse profile so that it is measured without disturbance from road markings.
• A more detailed picture of the road surface makes it possible determine the cause of rutting (deformation and/or wear).
2.
Aim and limitations
In this project we are to determine whether the scanning laser technology is sufficiently mature to replace the point-laser technology that is in use today. More specifically, the project is limited to examining whether the results for measuring transverse profile and rut depth using new technology are sufficiently accurate to provide upheld quality so that trends can be maintained and used to forecast condition. Rut depth is an important measured variable in Sweden and Finland as these countries have studded-tyre traffic during the winter months, which together with the structural impact of heavy traffic contributes to rutting. The measured variable dictates the choice of surfacing action in both the short and long terms. The long-term planning of road surfacing is in need of a stable value as a basis for forecasts forward in time, and in the short term it is used for selective efforts and to detect deviations from trends.
This study has been commissioned by the transport administrations of two different countries (Sweden and Finland). The national requirements for transverse profile and rut depth partly diverge. The results of the tests are therefore presented in separate chapters so that it can be clearly shown whether the national requirements are met with the technology.
An important aspect of road surface measurement with a survey vehicle is that the result has to preserve a known and high level of quality. The method that exists in Sweden with annual tests where the measurement systems are checked against a reference, that has to be stable over time, ensures that the data collected can be used to predict condition ahead in time. The project is to shed light on how this works with scanning laser. In addition, proposals are to be presented on how technology can take the industry forward. One of the most important questions is whether and how we can keep trends intact if the technology is introduced.
A third question for the project concerns the lateral position of the survey vehicle. The instruction that has been given to the driver of the survey vehicle in Sweden has always been to follow the track that most of the traffic follows, i.e. to position the lasers for evenness measurement in the wheel tracks of cars (cc 150 mm). If the rutting is located close to the pavement edge, the driver has to position the vehicle so that all the lasers are located on the surfaced part of the road, i.e. in this situation the lateral position of the survey vehicle is adjusted towards the centre of the road. The scanning laser opens up new opportunities for automatic positioning of transverse-profile data and rut-depth data by image interpretation (recognition of the road marking). Thanks to the scanning technology normally
measuring a 4 m wide transverse profile, the “system” can position the transverse profile, select a part of the profile, according the position of the road marking on the road. It is to be elucidated whether it affects level and trends for rut depth.
3.
Method
The tests that are carried out in the study are done the same way as the tests that are normally carried out in Sweden and Finland in procurement procedures for the road surface-measuring service and in the approval of a measurement supplier to carry out object measurement. Two different types of measurement system with sensors for a comprehensive transverse profile have been included in the study: Fraunhofer PPS (Pavement Profile Scanner) and Pavemetrics LCMS (Laser Crack
Measurement System). A point-laser system with more measurement points than normal in Sweden and Finland is also tested. The measurement systems and the measurement programme are described in further detail in chapter 4. In addition, we describe a method by which data should be analysed with the aim of making a conversion from data collected by point-laser technology to data collected with scanning laser technology.
3.1. Measures to be tested
The study is intended to shed light on measures that can be linked to transverse-profile measurement. The measures for which requirements are set nationally, in Sweden and Finland, are checked
consistently. There is some difference in relation to which measures are used in Sweden and Finland, and the checks are consequently presented separately for the two countries. Table 1 describes and shows the measures we test.
Table 1. Measures to be checked.
Measure/Measured variable Sweden Finland Explanation
Mean transverse profile X The transverse profile of the road is imaged with a measurement width of 3.2 m. The transverse profile is normally imaged centred around the rutting that is present on the road. The transverse profile is normally imaged by all available
measurement points, but different configurations will be checked in the report. Calculation of rut depth and crossfall is based upon the transverse profile.
Figure 4. Mean transverse profile described by 17 measurement points on the measured width of 3.2 m.
Rut depth max
In the report, rut depth calculated with • 17 measurement points is
designated by the number 17 or the letter X.
• 33 measurement points is designated by the number 33 or the letter Y.
• Maximum number of
measurement points (161 or 321) is designated by all, max or the letter Z.
X X Deviations from the flat surface across the direction of travel caused by wear and deformations.
Rut depth calculated over the whole measurement width with all available measurement points. In Sweden, the index 17 and 15 is also used for the measure, which indicates two different measurement widths, 17 – 3.2 m and 15 – 2.6 m. Rut depth is calculated as the greatest perpendicular distance between a point in the profile up to a simulated wire tensed on top of the transverse profile, see Figure 5.
Figure 5. Principle of calculation of rut depth max. Rut depth max is the greater of the perpendicular deviations between a tensed wire at the high points of the profile and a measurement point in the profile, in this case s13.
Rut depth left X X Rut depth calculated from 60% (approx. 1.92 m) of the total measurement width for the left side of the profile (closet to middle of road). In Sweden, the index 17 and 15 is also used for the measure, which indicates two different
measurement widths, 17 – 3.2 m and 15 – 2.6 m.
Figure 6. Principle of calculation of rut depth left. Rut depth left is the greater of the perpendicular
deviations between a tensed wire at the high points of the right side of the profile and a measurement point in the profile, in this case s13.
Rut depth right X X Rut depth calculated from 60% of the total measurement width for the right side of the profile (next to verge). In Sweden, the index 17 and 15 is also used for the dimension, which indicates two different measurement widths, 17 – 3.2 m and 15 – 2.6 m.
Figure 7. Principle of calculation of rut depth right. Rut depth right is the greater of the
perpendicular deviations between a tensed wire at the high-points of the left side of the profile and a measurement point in the profile, in this case s5.
Height of ridge X The height of the ridge calculated from the whole measurement width. Height of ridge is calculated as the greatest perpendicular distance between a point in the profile down to a simulate wire stretched underneath the transverse profile.
Figure 8. Principle of calculation of height of ridge. Rut depth right is the greater of the
perpendicular deviations between a stretched wire at the low points in the middle 2 m of the profile and a measurement point in the profile, in this case s5.
Crossfall line X The slope of the road surface to the horizon through two measurement points in the transverse profile. The points are approx. 2 m apart and are centred around the middle of the transverse profile.
Figure 9. Principle of calculation of crossfall line. The crossfall line is calculated as the slope
between two points 2 m apart and the horizon, α.
Crossfall outer line X The slope of the road surface to the horizontal through two measurement points in the transverse profile. The points are the extremes in the transverse profile.
Figure 10. Principle of calculation of crossfall outer line. The crossfall outer line is calculated as the
slope between the two outer measurement points 3.2 m apart and the horizon, β.
We will test several different setups of measurement points to characterise the transverse profile as a basis for calculating the different measures of rut depth, see Figure 11. Crossfall will not be elucidated by the study as we do not consider it to be affected by the scanning technology. If the systems can measure the transverse profile with great accuracy, there are no other differences compared with how point-laser systems calculate crossfall, and we therefore do not consider it necessary to analyse the measure, particularly in view of the fact that the point-laser systems and the scanning systems use the same type of system for inertial navigation which is the key part of crossfall measurement.
Figure 11- Distance between measurement points and number of measurement points used in the study. Tested setups of number of measurement points to describe the transverse profile.
17 measurement points are used today (in 2017) in Sweden and Finland for measurement of the road’s transverse profile. Repeatability and validity theoretically become better the more measurement points are used to describe the transverse profile. It has been shown previously that the gain from using more measurement points to calculate rut depth is relatively small above 17 measurement points (Sjögren & Lundberg, 2005). In the offprint (Sjögren & Lundberg, 2005) it is stated that that it is a better
investment to have well-trained drivers who keep to the correct lateral position than to increase the number of measurement points.
3.2. Data processing
To ensure that rut depth is calculated by the same methods, all rut-depth values are calculated by VTI. Lehman+Partner (PPS) and Vars through Ramböll (LCMS) calculate 4 m wide transverse profiles with a longitudinal resolution of 0.1 m. The profiles are supplied to VTI, which calculates rut depth in accordance with the method description of the Swedish Transport Administration (Trafikverket, 2015-B) (same method as used in Finland) for further analysis. Information about lateral position in relation to a reference has been calculated by Lehman+Partner and Ramböll respectively, and the information has been included in the files containing transverse profiles.
3.3. Swedish Transport Administration requirements in procurement
In Sweden, the road surface measurement service is now procured in a selective tendering procedure in which technical tests are an element that determine the supplier's technical capability. A number of mandatory requirements are used to approve the supplier, and a result surpassing the requirements yields added value which is credited in the assessment of tenders. The technical tests are divided into three different parts, see Figure 12.
1. Road-network loops, repeatability and reproducibility 2. Project level sections, repeatability
3. Test sections, repeatability and validity
Figure 12. The loop is part of a road network, used for road-network control. Object section is a smaller part of the road network, used for project level-specific control. Test section is a small part of the road network that is also reference-measured, used for validity and repeatability control. Picture from PMSv311, Swedish Transport Administration.
3.3.1. Requirements for test sections
The evaluation of the measurement of the test sections is intended to examine the technical quality of the equipment. This is done on sections that have a guideline painted in the left track, see Figure 13.
Figure 13. Example of test section.
11 The Swedish Transport Administration's tool for information on surfaced roads (https://pmsv3.trafikverket.se/)
The length of the sections is 1,200 metres and is measured with five repetitions at three different speeds, a total of 15 repetitions. The speeds at which the survey is to be driven are 30 km/h, 50 km/h and 70 km/h. The driver is instructed to position the survey vehicle laterally so that the guideline is followed along the whole section. The sections are chosen with the aim of representing different levels of the measured variable or variables to be studied. Three test sections, each 1,200 m in length, were selected for the tests in this study. The three sections represent good to poor road standard with regard to rut depth. Two fundamental properties are tested, sufficiently good repeatability and validity.
3.3.1.1. Repeatability in measurement of test sections
Repeatability means how well the combination of driver and operator and survey vehicle can repeat their measurements at the three different speeds used. The requirements for repeatability are described in greater detail in the Swedish Transport Administration's technical documentation (Trafikverket, 2015-A).
The requirement for repeatability is used on averaged data over 20 m. A standard deviation is calculated from the 15 repetitions for each 20 m section. The three test sections contain a total of 180 sections of 20 m, and we consequently obtain 180 standard deviations. The 75th percentile of the 180 standard deviations is tested against the requirement for the measurement variable. This method is applied to all measurement variables apart from position and longitudinal and transverse profile. The repeatability requirements (75th percentile of the standard deviation per 20 m) that are tested from measurement of the test sections in this report are:
rut depth max <0.5 mm rut depth left <0.5 mm
3.3.1.2. Validity in measurement of test sections
Validity here means how well the intended variable is measured in comparison with a reference when the reference is adapted to the supplier's laser configuration (same number of measurement points and distance between measurement points). This means that the reference must contain more measurement points than the tested system to enable us to choose the measurement points in the reference profile that correspond to the configuration for the tested system. The results of measurement from the test sections are used in the comparison between the supplier and the reference measurement. Each test section is reference-measured with respect to one or more measured variables. The requirements for validity are described in greater detail in the Swedish Transport Administration's technical
documentation (Trafikverket, 2015-A).
The transverse profile, which is included in this test, is also checked at 20 m level. The averaged transverse profiles over 20 m are zeroed (the profile is rotated in the transverse direction so that the outer measurement points are set to zero). From the zeroed mean transverse profile, the middle two metres of the profile are selected for comparison with the reference transverse profile. To ensure that the lateral position does not affect the result, the selected part of the transverse profile is fitted to the reference profile using the following three steps:
1. An adjustment of lateral position is carried out when a tested transverse profile “slides” across the reference profile until maximum correlation is obtained. The profile is moved one
millimetre at a time at the same time as the correlation is calculated and registered.
2. A fine adjustment is carried in which the tested transverse profile is allowed to be adjusted in height, rotated and finely adjusted in lateral position until the least possible difference is registered between the profiles. When the tested profile has been optimally fitted to the reference profile (finely adjusted with respect to lateral position, height and rotation), point-by-point comparison between the profiles is carried out.
3. The difference between all the available measurement points from the tested profile and reference profile is determined. A certain proportion of the differences has to be within 0.5 mm.
The calculated rut depth is compared with the rut-depth values of the reference measurement by creating a difference per 20 m. The difference must be within a particular interval around zero. The size of the interval is fixed up to a particular level (break-point) for measured variable (low measured values) and greater tolerance is allowed for large measured values. The principle is illustrated by Figure 14.
Figure 14. Principle of testing for validity on test section.
The requirements used for validity are described by Formula 1and Table 2. 𝑇𝑅 ≥ 𝑅𝑒𝑞𝑢𝑖𝑟𝑒𝑚𝑒𝑛𝑡
𝑅𝑒𝑓𝑖 = 𝑅𝑒𝑓𝑒𝑟𝑒𝑛𝑐𝑒 𝑣𝑎𝑙𝑢𝑒 𝑓𝑜𝑟 𝑜𝑏𝑠𝑒𝑟𝑣𝑎𝑡𝑖𝑜𝑛 𝑖
𝑆𝑢𝑝𝑖 = 𝑆𝑢𝑝𝑝𝑙𝑖𝑒𝑟′𝑠 𝑣𝑎𝑙𝑢𝑒 𝑓𝑜𝑟 𝑜𝑏𝑠𝑒𝑟𝑣𝑎𝑡𝑖𝑜𝑛 𝑖
𝑇𝑅 = 𝑅𝑒𝑠𝑢𝑙𝑡 𝑜𝑓 𝑡𝑒𝑠𝑡
𝑇𝑅1= Number OK below and including breakpoint
TR2= Number OK above breakpoint
𝑛 = 𝑁𝑢𝑚𝑏𝑒𝑟 𝑜𝑓 𝑜𝑏𝑠𝑒𝑟𝑣𝑎𝑡𝑖𝑜𝑛𝑠 𝐿𝑖𝑚𝑖𝑡 = 𝐹𝑖𝑥𝑒𝑑 𝑡𝑜𝑙𝑒𝑟𝑎𝑛𝑐𝑒 𝑢𝑝 𝑡𝑜 𝑏𝑟𝑒𝑎𝑘𝑝𝑜𝑖𝑛𝑡 𝑆𝑙𝑜𝑝𝑒 = 𝐼𝑛𝑐𝑟𝑒𝑎𝑠𝑒𝑑 𝑡𝑜𝑙𝑒𝑟𝑎𝑛𝑐𝑒 𝑏𝑒𝑦𝑜𝑛𝑑 𝑏𝑟𝑒𝑎𝑘𝑝𝑜𝑖𝑛𝑡 Formula 1 𝑖𝑓 𝑅𝑒𝑓𝑖≤ 𝐵𝑒𝑎𝑘𝑝𝑜𝑖𝑛𝑡; 𝑇𝑅1= ∑ (|𝑅𝑒𝑓𝑖− 𝑆𝑢𝑝𝑖| ≤ 𝐿𝑖𝑚𝑖𝑡) 𝑛 𝑖 𝑖𝑓 𝑅𝑒𝑓𝑖> 𝐵𝑟𝑒𝑎𝑘𝑝𝑜𝑖𝑛𝑡; 𝑇𝑅2= ∑ (|𝑅𝑒𝑓𝑖− 𝑆𝑢𝑝𝑖| ≤ 𝐿𝑖𝑚𝑖𝑡 + (𝑅𝑒𝑓𝑖− 𝐵𝑟𝑒𝑎𝑘𝑝𝑜𝑖𝑛𝑡) ∗ 𝑆𝑙𝑜𝑝𝑒) 𝑛 𝑖 𝑇𝑅 =𝑇𝑅1+ 𝑇𝑅2 𝑛
Table 2. Parameters and requirement limits for validity testing of rut depth.
Variable Breakpoint Slope Limit Requirement
Rut depth max 7.5 mm 5% 1.0 mm 80%
Rut depth left 7.5 mm 5% 1.0 mm 75 %
We have chosen not to study the validity of crossfall as the sensors included for slope which are used to measure crossfall are the same as in a point-laser and scanning system. This means that there is no reason to study crossfall, even though it is an important parameter in several of the measures
calculated from the transverse profile, for example water depth/water area.
3.3.2. Requirements for project level sections
Project level measurement is carried out principally on newly laid sections to check the quality of the contractor’s resurfacing work. A project level measurement is often used to settle penalty levels, and the measurement therefore has an extra dimension requiring particularly high reliability. The supplier of measurements must be able to demonstrate that repeatability is high (sufficiently good) for it to be possible for the measurement to be used for settlement, and there is therefore a control method with requirements to ensure this. Two project level sections were selected in the project where the measurement systems performed project level measurements according to the usual procedures. The sections are each 4 km in length on a section of road with the SMA16 type of surface (stone mastic asphalt concrete with maximum stone size 16 mm) laid in 2016. Each object is measured with at least three runs.
The requirements are described in greater detail in the Swedish Transport Administration's technical documentation (Trafikverket, 2015-C). The requirements can be summarised by the following points.
• A median value for three runs is calculated for each 20 m value along the section.
• Means and standard deviations for 400 m sections are calculated (control objects) of 20 m values for each measurement and measured variable, including for the median values described in the point above.
• The repeatability of the measurements is tested for each control object against the limits stated below.
- Test is performed on measurement values and standard deviations for the control objects (400 m sections) for the measured variable concerned. A check is made between the mean of the median values and one of the three runs that deviates most. The deviation is checked against the limit values. An equivalent check is performed for the standard deviations. • If the check leads to failure in any of the tests, the values of another run are added to the
calculation for the variables that fail. The results of the three most similar runs, assessed on the basis of means above 400 m, are selected and renewed median calculation and testing against the limits are performed.
Limited values: Rut depth:
– the mean value, over 400 m, for each measurement run may deviate by a maximum of 15% or 0.4 mm (from the mean of the median values)
– the standard deviation, over 400 m, for each measurement run may deviate by a maximum of 25% or 0.5 mm (from the standard deviation of the median values).
3.3.3. Requirements for road-network loop
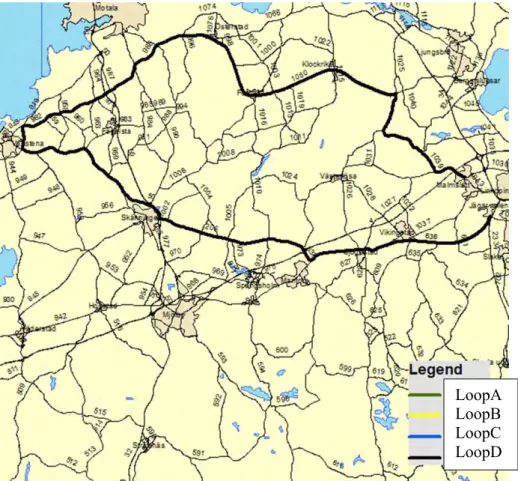
Measurement of the road-network loop is aimed at checking the measurement system in a routine environment for road-network measurement. Road-network measurement is understood to mean condition measurement of large areas, usually for a road authority for data supply to a PM (Pavement Management) system. The loop is chosen so that several different road types are included, from those that carry high levels of traffic to those that carry low levels (see Figure 15). The total length of the loop is 93 km (one circuit). The loop is measured in five circuits as a basis for checking repeatability and reproducibility.
Repeatability is determined within one individual equipment, and comparability is checked between one individual equipment and a standard survey vehicle using point laser.
In routine measurement under the direction of the Swedish Transport Administration, a control programme is carried out in which the ordinary measurement is checked by control measurements when a different survey vehicle and driver perform the measurement. This test will be also be performed and reported in this study.
Figure 15. Description of the road-network loop (Loop D, black) which is included in the test.
3.3.3.1. Checking of repeatability
Repeatability in measurement of the road-network loops decides how well measurement system, driver and operator, can repeat their own measurement.
LoopA LoopB LoopC LoopD
The loop to be analysed is divided into 400 m sections. The division is done separately for each measurement section (the loop consists of several measurement sections). The calculation of 400 m sections is based on means of 20 m data and 1 m data. A 400 m section is valid and is used in the evaluation if the mean value for the individual 400 m section is calculated from the measured values for at least 380 m of data (max 20 m loss or pause per 400 m).
The parameters used for repeatability are measurement error and relative measurement error. This is done as follows:
The 400 m sections are indexed with j over the whole loop.
nj in the formulae below relates to the number of valid repeated measurements on 400 m section j. The
repetitions are indexed with i. For repeatability, the 400 m sections for which nj ≥ 2 are used in the
analysis, others are excluded. For reproducibility, the 400 m sections for which nj ≥ 2 per survey
vehicle are used in the analysis, others are excluded.
ij
is the mean value of measurement i for 400 m section j.j
.
is the mean value of
ij for all valid measurements for 400 m section j...
is the mean value of
.j when averaging is done over all valid 400 sections.Formula 2 Calculation of measurement error and relative measurement error on road-network loops.
1
)
(
1 2 .
j n i ij j jn
MSE
j
is the variance between the valid measurements for 400 m section j. tot
MSE
is the mean value ofMSE
j when averaging is done over all valid 400 m sections.The measurement error is calculated as
MSE
tot . Relative measurement error is calculated as..
totMSE
.
The requirements set for measurement error and relative measurement error are presented in Table 3.
Table 3 Requirement for repeatability on road-network loop.
Variable Relative measurement error Measurement error
Rut depth (max and left) ≤5 % ≤0.4 mm.
3.3.3.2. Check of reproducibility
Reproducibility decides how well the tested measurement system resemble the point-laser systems in routine road-network measurement. Comparisons are made between the line-laser systems and the point-laser system.
The same principle is applied in checking the requirements for repeatability (Chapter 3.3.3.1). Measurement error and relative measurement error are used to determine the result. The requirements used for reproducibility are shown in Table 4.
Table 4 Requirement for reproducibility of road-network loop.
Variable Relative measurement error Measurement error
Rut depth (max and left) ≤6 % ≤0.6 mm.
3.3.3.3. Production control method
During a routine measurement at road-network level, a supplier must perform extra control measurements which are to be equivalent to at least 5% of the length of routine measurement.
Requirements are set for equality between routine measurement and control measurement. The control measurement has to be performed by a different survey vehicle, where a different driver performs the measurement. The requirements have to ensure that the routine measurement is performed correctly. All checks are performed on a complete measurement area where data is averaged over 400 m. In our case, the loop forms a check area and the routine measurement may consist of measurement by the point-laser system. The requirements to be met are based on three elements, sufficiently good correlation (correlation coefficient), spread (proportion within the check interval) and systematic difference. All three parts must be fulfilled for the measurement to be approved. An enumeration of the variables used in the control method and applicable limit values follow below.
Xp = mean value for routine measurement for a 400 m section
Xk = mean value for control measurement for a 400 m section
𝑋𝑝
̅̅̅̅ = mean value for routine measurement for all Xp in the control area 𝑋𝑘
̅̅̅̅ = mean value for control measurement for all Xk in the control area
Y=Xp-Xk, difference between the mean values for a 400 m section
XM= (Xp+Xk)/2, mean value of control and routine measurement for a 400 m section
n = the number of 400 m sections in the control area. Formula 3 Calculation of routine control.
X=
n
X
p
X
k
n
1
, systematic difference for the control area.
𝑟 = ∑(𝑋𝑝−𝑋̅̅̅̅)(𝑋𝑝 𝑘−𝑋𝑘)
√∑(𝑋𝑝−𝑋̅̅̅̅)𝑝2∑(𝑋𝑘−𝑋̅̅̅̅)𝑘 2
correlation coefficient for the control area
Table 5. Limits for approval of the routine control method.
Measured variable 80% within interval Correlation Systematic difference
Rut depth max and left (mm) - (0.5+0.1×XM) < Y < 0.5+0.1×XM r ≥ 0.90 -0.5 < X < 0.5
3.4. Finnish Transport Agency requirements in procurement
Finland has a similar arrangement to Sweden in its procurement of the road surface measurement service. Many of the procedures and requirements described in Chapter 3.3 can therefore also be
applied in Finland. The routine control method, on the other hand, is structured differently and will therefore be tested and reported as a separate part of the project.
3.4.1. Production control method in Finland
As in Sweden, extra control measurements are performed which are to verify that the routine
measurement at road-network level has been performed correctly. The control method is performed on the basis of 100 m sections (only whole 100 m sections are used).
The method can be summarised in the following points:
• A difference is created between the control measurement (Xk) and the routine measurement
(Xt), designated Y.
• The limit values classify great deviations for rut depth (max, left and right) and ridge height in a group for “the measured value exceeds the quality limit”, designated Qn.
• In addition, there is an extra limit value that classifies the result of rut depth max as “significant exceeding of the quality limit”, designated Qs.
• A proportion of the excesses is calculated for whole check area (in our case the loop, the number of observations is designated X) and is designated Qn% or Qs%.
Formula 4 Check parameters for the Finnish routine control method.
𝑄𝑛%= 𝑄𝑛− 𝑄𝑠 𝑋 × 100 𝑄𝑠% = 𝑄𝑠 𝑋 × 100
Table 6. Values for significant exceeding of the quality limit for the Finnish routine control method
Measured variable Unit Measurement range for runn+1 Limit
Rut depth max mm Xk < 10 -1 ≤ Y ≤ 1
Rut depth max mm 10 ≤ Xk < 18 -(Xk×10%) ≤ Y ≤ Xk × 10% Rut depth max mm Xk ≥ 18 -(Xk×15%) ≤ Y ≤ Xk × 15% Rut depth left/right mm Xk < 8 -1.5 ≤ Y ≤ 1.5
Rut depth left/right mm Xk ≥ 8 -(Xk×20%) ≤ Y ≤ Xk × 20% Height of ridge mm -10 < Xk < 10 -1 ≤ Y ≤ 1
Table 7. Values for significant exceeding of the quality limit for the Finnish routine control method
Variable Unit Measurement range for run
n+1 Limit
Rut depth max mm Xk < 8 -1.5 ≤ Y ≤ 1.5
Rut depth max mm 8 ≤ Xk < 18 -(Xk×20%) ≤ Y ≤ Xk × 20% Rut depth max mm Xk ≥ 18 -(Xk×25%) ≤ Y ≤ Xk × 25%
4.
Description of measurement system and measurement
programme
The results presented in the report are based on measurements done within the project in combination with measurements used by the Swedish Transport Administration for annual checking of suppliers of the road-surface measurement service for object measurement and road-network management. As we handle several different measurement systems in the project, the operators and drivers who are accustomed to managing “their” system also carried out the measurement concerned.
When talking about road-surface measurements, it is usual to classify them into categories: • Road-network measurement
• Project level measurement
A road-network measurement is carried out over a larger area, often for the purpose of providing a decision-support system (Pavement Management System) with data. The road authority is often the purchaser of this service, which is normal contracted for a prolonged period. One measurement is performed per section, and the national measurement strategy decides which roads are to be measured and how often they are to be measured. In addition to the tests carried out in conjunction with
tendering for the service, control measurements are performed in production to ensure adequate quality.
A project level measurement is used in particular to check the quality of a new pavement.
There may be different types of contracts, and the entity ordering the measurement may be either the contractor which has carried out the resurfacing work or the road's “owner” (the Transport
Administration). A supplier of project level measurement is approved to carry out this type of measurement in a special control procedure. A project level measurement is often tendered for
competitively, where the “approved” suppliers compete for the assignment. Price decides the award of contract. Quality control is also carried out in a project level measurement to ensure the high level of quality required to be able to regulate penalty fines in the event of substandard resurfacing quality
4.1. Reference measurement
A reference measurement is performed as a separate measurement with a measurement system that (usually) differs from the measurement system to be tested. The purpose of the measurement is to have a traceable and stable measured value that can be used as a comparative measure over a long period of time. The accuracy of the reference system should be at least on a par with the system to be checked. The tolerances permitted around the reference value are an important part of the measurement method. A less precise reference method is combined with a somewhat greater tolerance, in such a way that we can gain acceptance for various references, see Figure 16.
Figure 16. Above a reference close to a true value with a narrow tolerance for approval. Below a reference with greater deviations from a true value with relatively wide tolerance for approval.
Reference measurement is performed only on the test sections. The reference system that has been used in this project is VTI-XPS (VTI Cross Profile Scanner). VTI-XPS is a relatively new reference system that replaced VTI-TVP (VTI cross profilometer) ahead of the 2014 tendering procedure for the road-surface measurement service in Sweden. It is a measurement system consisting of distance-measuring sensors, distance measurement and positioning and slope sensors. The measurement system is installed on a trailer and linked to a car, see the film below and Figure 17.
Figure 17. Reference system VTI-XPS for measurement of mean transverse profile, crossfall and position.
As previously mentioned in chapter 3.3.1, the test sections are provided with a guideline, see Figure 18. The guideline is intended to help the driver of both the reference system and tested measurement vehicles to maintain correct lateral position in the measurement.
Figure 18. Test section with guideline for lateral position of survey vehicles.
The reference section is marked in the left wheel track so that the driver will easily have the guideline in his field of view in measurement. The measurement is performed with a TMA-equipped (Truck Mounted Attenuator) following vehicle at low speed (normally 20 km/h) in order to be able to follow the guideline as precisely as possible. Five repeated measurements are performed, which are used to calculate reference values. On passage, the measurement is started with the aid of a reflector
positioned on the start line of the test section which provides an indication in the data stream with a signal via the photosensor of the measurement system. The measurement is finished in the same way.
1200 m Guideline Direction of travel
The measurement sensors included are seven line lasers from LMI, Gocator 2375, which each cover a part of the total 3.6 m wide transverse profile. The lasers are located so that there is a certain overlap (the adjacent lasers measure on the same part of the road surface), and the software therefore controls the lasers so that every other laser measures simultaneously in order not to interfere with its
“neighbour”. The lasers are calibrated against a milk surface in order to obtain a horizontal surface with minimal deviations from an absolutely plane and horizontal surface (crossfall and rut depth close to zero). The middle part of the 3.6 m wide profile, consisting of 3.2 m, is used as reference data for the transverse profile of the road. A measurement sensor has a certain level of noise, including these sensors, and the sensor's signal is therefore filtered with a third-order 150 mm Butterworth filter (forward-reverse). The other significant measurement sensor in the system is a sensor for positioning with inertial navigation which also keeps track of the slopes of the vehicle (trailer). The component that describes the slope of the vehicle (trailer) in the transverse direction is used to determine the crossfall of the road in combination with the measurement of the transverse profile. A unit from Oxford Technical Solution, Survey+ is used for this purpose. As well as these measurement sensors, the trailer is equipped with an incremental angle sensor to measure distance travelled and a
photosensor for automatic starting and stopping of the measurement system. The whole system is powered by two car batteries. Figure 17 shows the system in action.
The reference system has a measured accuracy better than 0.5 mm. Figure 19 shows five repeated transverse profiles as a mean over 20 m. The profiles have the same starting point but are otherwise uncorrected for crossfall.
Figure 19. Five repeated measurements with VTIXPS on test section A. The profile is represented by a mean value over 20 m. The X-axis shows distance in mm across the road. The Y-axis shows distance in mm in the height direction.
4.2. Measurement with present-day technology
The primary purposes of the measured results from the equipment used at road-network level in Sweden and Finland today (in 2017) are to describe how condition develops on the road network and for resurfacing planning. They are to be compared with the scanning measurement systems in this project. The technology in present-day equipment is based on point lasers, unlike the scanning equipment (comprehensive transverse profile) which is to be tested in this study. 17 measurement points are normally used in Sweden and Finland on the measurement width of 3.2 m as a standard setup when the transverse profile is to be described and the rut depth calculated. Narrow roads and narrow lanes are characterised by 15 measurement points (the two outermost ones are not used in the calculation) over the measurement width of 2.6 m. There is a description of what requirements a survey vehicle has to fulfil in both Finland and Sweden. There are national technical documents for which each transport administration is responsible (Trafikverket, 2015-B).